
Key Insights
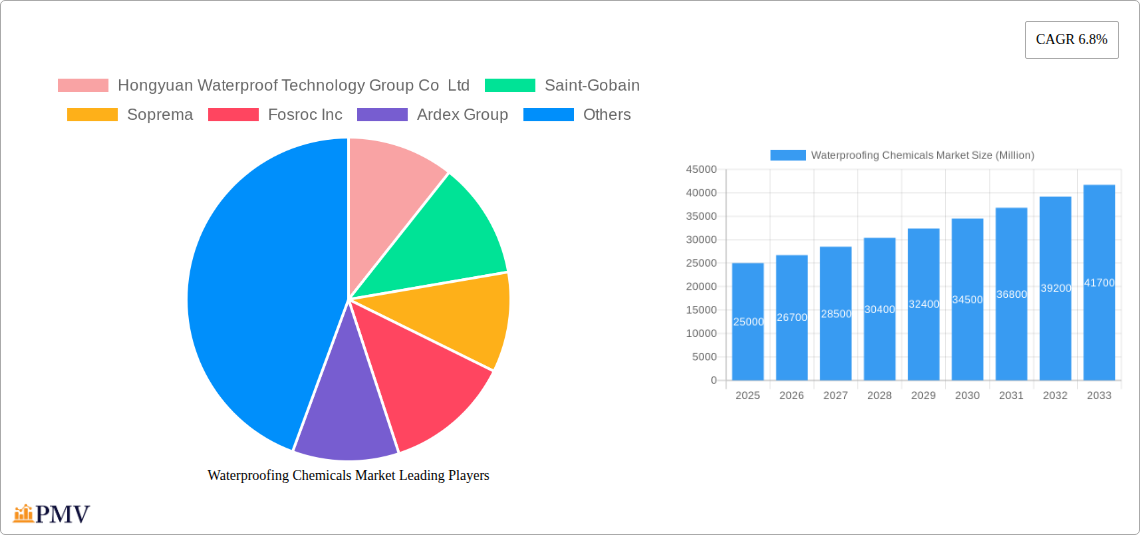
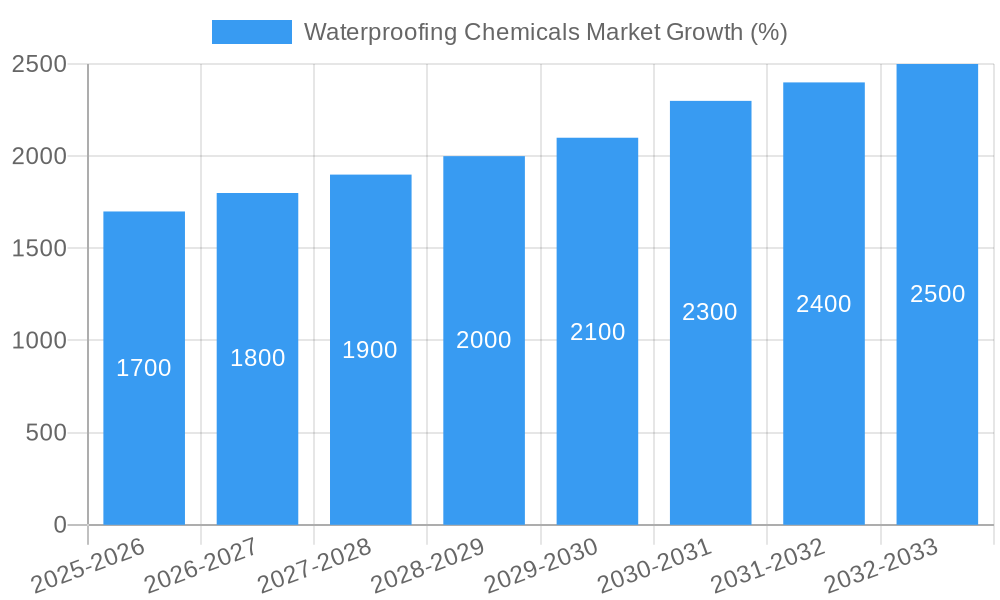
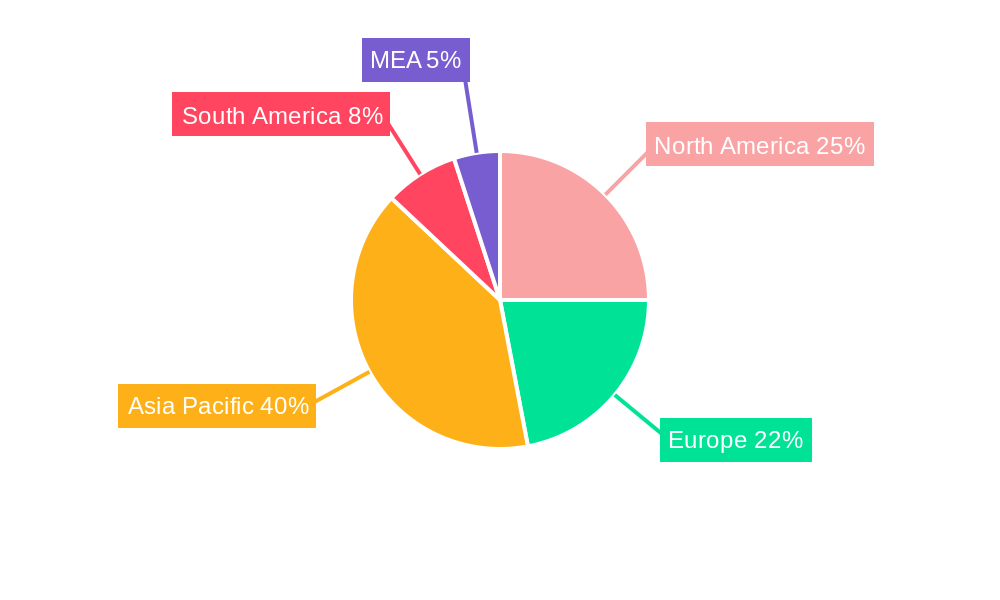
The global waterproofing chemicals market is experiencing robust growth, projected to reach a substantial value by 2033. A compound annual growth rate (CAGR) of 6.8% from 2019 to 2024 indicates a consistently expanding market, driven primarily by the burgeoning construction industry globally, particularly in developing economies experiencing rapid urbanization and infrastructure development. Increasing demand for durable and high-performance building materials, coupled with stringent building codes emphasizing water resistance, fuels this expansion. The residential sector remains a significant market segment, followed by infrastructure and commercial projects. Technological advancements in waterproofing materials, such as the development of environmentally friendly water-based solutions and high-performance epoxy and polyurethane-based systems, contribute to market growth. However, factors such as price volatility of raw materials and stringent environmental regulations pose potential restraints. The market is segmented by end-use sector (residential, commercial, industrial, infrastructure) and technology (epoxy, polyurethane, water-based, others). Key players, including Hongyuan Waterproof Technology Group, Saint-Gobain, Soprema, Fosroc, Ardex, MAPEI, Sika, Keshun Waterproof Technology, Standard Industries, and Oriental Yuhong, compete fiercely, leveraging their technological expertise and global reach. Regional analysis reveals significant growth potential in Asia-Pacific, driven by large-scale infrastructure projects and rapid urbanization in countries like China and India. North America and Europe also hold substantial market shares, owing to established construction sectors and high adoption rates of advanced waterproofing technologies.
The forecast period (2025-2033) anticipates continued growth, potentially exceeding earlier projections due to anticipated investments in infrastructure globally and sustained demand in the residential sector. Market players are focusing on innovation and sustainable solutions to cater to environmental concerns and emerging construction trends. Strategic partnerships, mergers and acquisitions, and geographical expansion are expected to shape the market's competitive landscape in the coming years. Factors like climate change, which increases the risk of water damage, will further bolster the demand for effective waterproofing solutions. The overall market outlook for waterproofing chemicals remains positive, signifying substantial opportunities for businesses operating in this dynamic sector.
Waterproofing Chemicals Market: A Comprehensive Report (2019-2033)
This in-depth report provides a comprehensive analysis of the global Waterproofing Chemicals Market, covering the period 2019-2033. With a base year of 2025 and an estimated year of 2025, this report offers valuable insights into market size, segmentation, growth drivers, challenges, and competitive dynamics. The forecast period extends from 2025 to 2033, building upon the historical period of 2019-2024. This report is crucial for businesses, investors, and stakeholders seeking to understand and navigate the complexities of this dynamic market.
Waterproofing Chemicals Market Market Structure & Competitive Dynamics
The global waterproofing chemicals market exhibits a moderately concentrated structure, with several key players holding significant market share. The market is characterized by a dynamic innovation ecosystem, with ongoing research and development efforts focused on enhancing product performance, sustainability, and application versatility. Regulatory frameworks, particularly those concerning environmental protection and worker safety, significantly influence market dynamics. Product substitutes, such as membrane-based waterproofing systems, present competitive pressure. End-user trends, driven by increasing urbanization and infrastructure development, shape market demand. Mergers and acquisitions (M&A) activity further shapes the competitive landscape. For instance, the xx Million acquisition of United Gilsonite Laboratories by Sika AG illustrates the strategic moves of major players to expand their market presence. The average M&A deal value in the waterproofing chemicals sector during 2019-2024 was approximately xx Million, with a total deal value of approximately xx Million. Market share data for key players is presented below:
- Saint-Gobain: xx%
- Sika AG: xx%
- MAPEI S.p.A: xx%
- Soprema: xx%
- Others: xx%
Waterproofing Chemicals Market Industry Trends & Insights
The global waterproofing chemicals market is experiencing robust growth, driven by several key factors. The rising global infrastructure spending, particularly in developing economies, fuels significant demand for waterproofing solutions. Technological advancements, particularly in the development of high-performance, eco-friendly materials, are reshaping the market landscape. Consumer preferences are shifting towards durable, sustainable, and easy-to-apply products. The competitive intensity in the market is high, with companies striving to differentiate their offerings through innovation and strategic partnerships. The market exhibits a Compound Annual Growth Rate (CAGR) of xx% during the forecast period (2025-2033). Market penetration remains high in developed regions but is rapidly expanding in emerging markets due to growing construction activity. The increasing adoption of green building practices and stringent environmental regulations also drive the demand for eco-friendly waterproofing chemicals. Technological disruptions such as the introduction of innovative formulations and application techniques are continually reshaping the market. These factors are creating significant opportunities for growth and innovation within the industry.
Dominant Markets & Segments in Waterproofing Chemicals Market
The Asia-Pacific region currently dominates the global waterproofing chemicals market, primarily driven by rapid urbanization, robust infrastructure development, and rising construction activities in countries like China and India. Significant growth is also anticipated in other developing regions, especially in the Middle East and Africa. Within the end-use sector, infrastructure projects account for a significant portion of the market demand, followed by residential and commercial sectors.
Key Drivers:
- Infrastructure Development: Government investments in large-scale infrastructure projects, such as roads, bridges, and dams, are key growth drivers.
- Urbanization: Rapid population growth and urbanization are increasing the demand for housing and commercial buildings.
- Economic Growth: Strong economic growth in several regions drives investments in construction and infrastructure.
- Government Regulations: Stringent building codes and environmental regulations are promoting the adoption of high-performance waterproofing solutions.
Dominance Analysis:
The dominance of the Asia-Pacific region stems from its large population base, rapid economic growth, and expanding construction sector. The infrastructure segment's leading position reflects the scale of infrastructure projects underway globally. The growing preference for durable and long-lasting structures also increases the usage of waterproofing chemicals in residential and commercial construction.
Among the technology segments, polyurethane-based waterproofing chemicals hold a prominent market share due to their superior performance characteristics such as flexibility, durability, and excellent adhesion.
Waterproofing Chemicals Market Product Innovations
Recent advancements in waterproofing chemicals focus on enhanced durability, sustainability, and ease of application. The introduction of products such as SOPREMA's Alsan Flashing Neo, which eliminates the need for primers, showcases the industry's commitment to innovation. Companies are also focusing on developing water-based, low-VOC products to meet stringent environmental regulations and consumer preferences. This trend toward sustainability is driving growth in the water-based segment. The integration of smart technologies is also a promising innovation direction that can result in further efficiency gains and improved product life spans.
Report Segmentation & Scope
The report segments the waterproofing chemicals market based on end-use sector (Commercial, Industrial and Institutional, Infrastructure, Residential) and technology (Epoxy-based, Polyurethane-based, Water-based, Other Technologies).
End-Use Sector:
- Commercial: This segment is expected to witness steady growth, driven by the construction of new commercial buildings and the renovation of existing ones.
- Industrial and Institutional: This segment is characterized by large-scale projects requiring robust waterproofing solutions. Growth is driven by industrial expansion and institutional investments.
- Infrastructure: This is a significant segment, with growth fueled by government spending on infrastructure projects.
- Residential: This segment shows substantial growth potential, driven by rising urbanization and increased housing demand.
Technology:
- Epoxy-based: This technology offers high strength and durability but may present environmental concerns related to VOC emissions.
- Polyurethane-based: This segment enjoys high market share due to flexibility and durability.
- Water-based: This environmentally friendly option is gaining traction due to its low VOC content.
- Other Technologies: This includes various other technologies that offer niche solutions to specific waterproofing needs.
Each segment's growth projections, market sizes, and competitive dynamics are analyzed in detail within the report.
Key Drivers of Waterproofing Chemicals Market Growth
Several factors contribute to the market's growth. Increasing urbanization and infrastructure development in emerging economies significantly boost demand for waterproofing solutions. Stringent building codes and regulations mandating effective waterproofing measures also drive market growth. Technological advancements leading to improved product performance, enhanced durability, and environmentally friendly options further fuel market expansion. The rising awareness of the need for effective waterproofing to prevent structural damage and water-related problems is also a significant factor.
Challenges in the Waterproofing Chemicals Market Sector
The waterproofing chemicals market faces several challenges. Fluctuations in raw material prices can significantly impact production costs. Stringent environmental regulations necessitate the development of eco-friendly solutions, adding to R&D expenses. Intense competition from existing players and emerging entrants puts pressure on profit margins. Supply chain disruptions and transportation costs pose additional challenges. These factors could potentially impede market growth unless proactively addressed.
Leading Players in the Waterproofing Chemicals Market Market
- Hongyuan Waterproof Technology Group Co Ltd
- Saint-Gobain
- Soprema
- Fosroc Inc
- Ardex Group
- MAPEI S p A
- Sika AG
- Keshun Waterproof Technology Co ltd
- Standard Industries Inc
- Oriental Yuhong
Key Developments in Waterproofing Chemicals Market Sector
- January 2022: SOPREMA launched Alsan Flashing Neo, a next-generation waterproofing chemical eliminating the need for primers. This innovation enhances application efficiency and expands market reach.
- May 2022: Sika AG's acquisition of United Gilsonite Laboratories strengthens its US market position and expands its product portfolio. This strategic move enhances its competitive advantage.
- November 2022: MAPEI's investment in Sopro Bauchemie increases production capacity and R&D capabilities, boosting its innovation potential and market competitiveness.
Strategic Waterproofing Chemicals Market Market Outlook
The future of the waterproofing chemicals market looks promising, with continued growth driven by global infrastructure development, urbanization, and technological advancements. Strategic opportunities exist for companies focusing on sustainable, high-performance products and innovative application methods. Companies that adapt to changing regulations, optimize their supply chains, and invest in research and development will be well-positioned for success in this dynamic market. The market's potential for expansion in developing economies presents lucrative opportunities for both established players and new entrants.
Waterproofing Chemicals Market Segmentation
-
1. End Use Sector
- 1.1. Commercial
- 1.2. Industrial and Institutional
- 1.3. Infrastructure
- 1.4. Residential
-
2. Technology
- 2.1. Epoxy-based
- 2.2. Polyurethane-based
- 2.3. Water-based
- 2.4. Other Technologies
Waterproofing Chemicals Market Segmentation By Geography
-
1. North America
- 1.1. United States
- 1.2. Canada
- 1.3. Mexico
-
2. South America
- 2.1. Brazil
- 2.2. Argentina
- 2.3. Rest of South America
-
3. Europe
- 3.1. United Kingdom
- 3.2. Germany
- 3.3. France
- 3.4. Italy
- 3.5. Spain
- 3.6. Russia
- 3.7. Benelux
- 3.8. Nordics
- 3.9. Rest of Europe
-
4. Middle East & Africa
- 4.1. Turkey
- 4.2. Israel
- 4.3. GCC
- 4.4. North Africa
- 4.5. South Africa
- 4.6. Rest of Middle East & Africa
-
5. Asia Pacific
- 5.1. China
- 5.2. India
- 5.3. Japan
- 5.4. South Korea
- 5.5. ASEAN
- 5.6. Oceania
- 5.7. Rest of Asia Pacific
Waterproofing Chemicals Market REPORT HIGHLIGHTS
| Aspects | Details |
|---|---|
| Study Period | 2019-2033 |
| Base Year | 2024 |
| Estimated Year | 2025 |
| Forecast Period | 2025-2033 |
| Historical Period | 2019-2024 |
| Growth Rate | CAGR of 6.8% from 2019-2033 |
| Segmentation |
|
Table of Contents
- 1. Introduction
- 1.1. Research Scope
- 1.2. Market Segmentation
- 1.3. Research Methodology
- 1.4. Definitions and Assumptions
- 2. Executive Summary
- 2.1. Introduction
- 3. Market Dynamics
- 3.1. Introduction
- 3.2. Market Drivers
- 3.2.1. ; Banning/ Limiting Use of Plastics used in packaging applications
- 3.3. Market Restrains
- 3.3.1. ; Harmful Amines in Dyes; Paperless Green Initiatives
- 3.4. Market Trends
- 3.4.1. OTHER KEY INDUSTRY TRENDS COVERED IN THE REPORT
- 4. Market Factor Analysis
- 4.1. Porters Five Forces
- 4.2. Supply/Value Chain
- 4.3. PESTEL analysis
- 4.4. Market Entropy
- 4.5. Patent/Trademark Analysis
- 5. Global Waterproofing Chemicals Market Analysis, Insights and Forecast, 2019-2031
- 5.1. Market Analysis, Insights and Forecast - by End Use Sector
- 5.1.1. Commercial
- 5.1.2. Industrial and Institutional
- 5.1.3. Infrastructure
- 5.1.4. Residential
- 5.2. Market Analysis, Insights and Forecast - by Technology
- 5.2.1. Epoxy-based
- 5.2.2. Polyurethane-based
- 5.2.3. Water-based
- 5.2.4. Other Technologies
- 5.3. Market Analysis, Insights and Forecast - by Region
- 5.3.1. North America
- 5.3.2. South America
- 5.3.3. Europe
- 5.3.4. Middle East & Africa
- 5.3.5. Asia Pacific
- 5.1. Market Analysis, Insights and Forecast - by End Use Sector
- 6. North America Waterproofing Chemicals Market Analysis, Insights and Forecast, 2019-2031
- 6.1. Market Analysis, Insights and Forecast - by End Use Sector
- 6.1.1. Commercial
- 6.1.2. Industrial and Institutional
- 6.1.3. Infrastructure
- 6.1.4. Residential
- 6.2. Market Analysis, Insights and Forecast - by Technology
- 6.2.1. Epoxy-based
- 6.2.2. Polyurethane-based
- 6.2.3. Water-based
- 6.2.4. Other Technologies
- 6.1. Market Analysis, Insights and Forecast - by End Use Sector
- 7. South America Waterproofing Chemicals Market Analysis, Insights and Forecast, 2019-2031
- 7.1. Market Analysis, Insights and Forecast - by End Use Sector
- 7.1.1. Commercial
- 7.1.2. Industrial and Institutional
- 7.1.3. Infrastructure
- 7.1.4. Residential
- 7.2. Market Analysis, Insights and Forecast - by Technology
- 7.2.1. Epoxy-based
- 7.2.2. Polyurethane-based
- 7.2.3. Water-based
- 7.2.4. Other Technologies
- 7.1. Market Analysis, Insights and Forecast - by End Use Sector
- 8. Europe Waterproofing Chemicals Market Analysis, Insights and Forecast, 2019-2031
- 8.1. Market Analysis, Insights and Forecast - by End Use Sector
- 8.1.1. Commercial
- 8.1.2. Industrial and Institutional
- 8.1.3. Infrastructure
- 8.1.4. Residential
- 8.2. Market Analysis, Insights and Forecast - by Technology
- 8.2.1. Epoxy-based
- 8.2.2. Polyurethane-based
- 8.2.3. Water-based
- 8.2.4. Other Technologies
- 8.1. Market Analysis, Insights and Forecast - by End Use Sector
- 9. Middle East & Africa Waterproofing Chemicals Market Analysis, Insights and Forecast, 2019-2031
- 9.1. Market Analysis, Insights and Forecast - by End Use Sector
- 9.1.1. Commercial
- 9.1.2. Industrial and Institutional
- 9.1.3. Infrastructure
- 9.1.4. Residential
- 9.2. Market Analysis, Insights and Forecast - by Technology
- 9.2.1. Epoxy-based
- 9.2.2. Polyurethane-based
- 9.2.3. Water-based
- 9.2.4. Other Technologies
- 9.1. Market Analysis, Insights and Forecast - by End Use Sector
- 10. Asia Pacific Waterproofing Chemicals Market Analysis, Insights and Forecast, 2019-2031
- 10.1. Market Analysis, Insights and Forecast - by End Use Sector
- 10.1.1. Commercial
- 10.1.2. Industrial and Institutional
- 10.1.3. Infrastructure
- 10.1.4. Residential
- 10.2. Market Analysis, Insights and Forecast - by Technology
- 10.2.1. Epoxy-based
- 10.2.2. Polyurethane-based
- 10.2.3. Water-based
- 10.2.4. Other Technologies
- 10.1. Market Analysis, Insights and Forecast - by End Use Sector
- 11. North America Waterproofing Chemicals Market Analysis, Insights and Forecast, 2019-2031
- 11.1. Market Analysis, Insights and Forecast - By Country/Sub-region
- 11.1.1 United States
- 11.1.2 Canada
- 11.1.3 Mexico
- 12. Europe Waterproofing Chemicals Market Analysis, Insights and Forecast, 2019-2031
- 12.1. Market Analysis, Insights and Forecast - By Country/Sub-region
- 12.1.1 Germany
- 12.1.2 France
- 12.1.3 Italy
- 12.1.4 United Kingdom
- 12.1.5 Netherlands
- 12.1.6 Rest of Europe
- 13. Asia Pacific Waterproofing Chemicals Market Analysis, Insights and Forecast, 2019-2031
- 13.1. Market Analysis, Insights and Forecast - By Country/Sub-region
- 13.1.1 China
- 13.1.2 Japan
- 13.1.3 India
- 13.1.4 South Korea
- 13.1.5 Taiwan
- 13.1.6 Australia
- 13.1.7 Rest of Asia-Pacific
- 14. South America Waterproofing Chemicals Market Analysis, Insights and Forecast, 2019-2031
- 14.1. Market Analysis, Insights and Forecast - By Country/Sub-region
- 14.1.1 Brazil
- 14.1.2 Argentina
- 14.1.3 Rest of South America
- 15. MEA Waterproofing Chemicals Market Analysis, Insights and Forecast, 2019-2031
- 15.1. Market Analysis, Insights and Forecast - By Country/Sub-region
- 15.1.1 Middle East
- 15.1.2 Africa
- 16. Competitive Analysis
- 16.1. Global Market Share Analysis 2024
- 16.2. Company Profiles
- 16.2.1 Hongyuan Waterproof Technology Group Co Ltd
- 16.2.1.1. Overview
- 16.2.1.2. Products
- 16.2.1.3. SWOT Analysis
- 16.2.1.4. Recent Developments
- 16.2.1.5. Financials (Based on Availability)
- 16.2.2 Saint-Gobain
- 16.2.2.1. Overview
- 16.2.2.2. Products
- 16.2.2.3. SWOT Analysis
- 16.2.2.4. Recent Developments
- 16.2.2.5. Financials (Based on Availability)
- 16.2.3 Soprema
- 16.2.3.1. Overview
- 16.2.3.2. Products
- 16.2.3.3. SWOT Analysis
- 16.2.3.4. Recent Developments
- 16.2.3.5. Financials (Based on Availability)
- 16.2.4 Fosroc Inc
- 16.2.4.1. Overview
- 16.2.4.2. Products
- 16.2.4.3. SWOT Analysis
- 16.2.4.4. Recent Developments
- 16.2.4.5. Financials (Based on Availability)
- 16.2.5 Ardex Group
- 16.2.5.1. Overview
- 16.2.5.2. Products
- 16.2.5.3. SWOT Analysis
- 16.2.5.4. Recent Developments
- 16.2.5.5. Financials (Based on Availability)
- 16.2.6 MAPEI S p A
- 16.2.6.1. Overview
- 16.2.6.2. Products
- 16.2.6.3. SWOT Analysis
- 16.2.6.4. Recent Developments
- 16.2.6.5. Financials (Based on Availability)
- 16.2.7 Sika AG
- 16.2.7.1. Overview
- 16.2.7.2. Products
- 16.2.7.3. SWOT Analysis
- 16.2.7.4. Recent Developments
- 16.2.7.5. Financials (Based on Availability)
- 16.2.8 Keshun Waterproof Technology Co ltd
- 16.2.8.1. Overview
- 16.2.8.2. Products
- 16.2.8.3. SWOT Analysis
- 16.2.8.4. Recent Developments
- 16.2.8.5. Financials (Based on Availability)
- 16.2.9 Standard Industries Inc
- 16.2.9.1. Overview
- 16.2.9.2. Products
- 16.2.9.3. SWOT Analysis
- 16.2.9.4. Recent Developments
- 16.2.9.5. Financials (Based on Availability)
- 16.2.10 Oriental Yuhong
- 16.2.10.1. Overview
- 16.2.10.2. Products
- 16.2.10.3. SWOT Analysis
- 16.2.10.4. Recent Developments
- 16.2.10.5. Financials (Based on Availability)
- 16.2.1 Hongyuan Waterproof Technology Group Co Ltd
List of Figures
- Figure 1: Global Waterproofing Chemicals Market Revenue Breakdown (Million, %) by Region 2024 & 2032
- Figure 2: Global Waterproofing Chemicals Market Volume Breakdown (K Tons, %) by Region 2024 & 2032
- Figure 3: North America Waterproofing Chemicals Market Revenue (Million), by Country 2024 & 2032
- Figure 4: North America Waterproofing Chemicals Market Volume (K Tons), by Country 2024 & 2032
- Figure 5: North America Waterproofing Chemicals Market Revenue Share (%), by Country 2024 & 2032
- Figure 6: North America Waterproofing Chemicals Market Volume Share (%), by Country 2024 & 2032
- Figure 7: Europe Waterproofing Chemicals Market Revenue (Million), by Country 2024 & 2032
- Figure 8: Europe Waterproofing Chemicals Market Volume (K Tons), by Country 2024 & 2032
- Figure 9: Europe Waterproofing Chemicals Market Revenue Share (%), by Country 2024 & 2032
- Figure 10: Europe Waterproofing Chemicals Market Volume Share (%), by Country 2024 & 2032
- Figure 11: Asia Pacific Waterproofing Chemicals Market Revenue (Million), by Country 2024 & 2032
- Figure 12: Asia Pacific Waterproofing Chemicals Market Volume (K Tons), by Country 2024 & 2032
- Figure 13: Asia Pacific Waterproofing Chemicals Market Revenue Share (%), by Country 2024 & 2032
- Figure 14: Asia Pacific Waterproofing Chemicals Market Volume Share (%), by Country 2024 & 2032
- Figure 15: South America Waterproofing Chemicals Market Revenue (Million), by Country 2024 & 2032
- Figure 16: South America Waterproofing Chemicals Market Volume (K Tons), by Country 2024 & 2032
- Figure 17: South America Waterproofing Chemicals Market Revenue Share (%), by Country 2024 & 2032
- Figure 18: South America Waterproofing Chemicals Market Volume Share (%), by Country 2024 & 2032
- Figure 19: MEA Waterproofing Chemicals Market Revenue (Million), by Country 2024 & 2032
- Figure 20: MEA Waterproofing Chemicals Market Volume (K Tons), by Country 2024 & 2032
- Figure 21: MEA Waterproofing Chemicals Market Revenue Share (%), by Country 2024 & 2032
- Figure 22: MEA Waterproofing Chemicals Market Volume Share (%), by Country 2024 & 2032
- Figure 23: North America Waterproofing Chemicals Market Revenue (Million), by End Use Sector 2024 & 2032
- Figure 24: North America Waterproofing Chemicals Market Volume (K Tons), by End Use Sector 2024 & 2032
- Figure 25: North America Waterproofing Chemicals Market Revenue Share (%), by End Use Sector 2024 & 2032
- Figure 26: North America Waterproofing Chemicals Market Volume Share (%), by End Use Sector 2024 & 2032
- Figure 27: North America Waterproofing Chemicals Market Revenue (Million), by Technology 2024 & 2032
- Figure 28: North America Waterproofing Chemicals Market Volume (K Tons), by Technology 2024 & 2032
- Figure 29: North America Waterproofing Chemicals Market Revenue Share (%), by Technology 2024 & 2032
- Figure 30: North America Waterproofing Chemicals Market Volume Share (%), by Technology 2024 & 2032
- Figure 31: North America Waterproofing Chemicals Market Revenue (Million), by Country 2024 & 2032
- Figure 32: North America Waterproofing Chemicals Market Volume (K Tons), by Country 2024 & 2032
- Figure 33: North America Waterproofing Chemicals Market Revenue Share (%), by Country 2024 & 2032
- Figure 34: North America Waterproofing Chemicals Market Volume Share (%), by Country 2024 & 2032
- Figure 35: South America Waterproofing Chemicals Market Revenue (Million), by End Use Sector 2024 & 2032
- Figure 36: South America Waterproofing Chemicals Market Volume (K Tons), by End Use Sector 2024 & 2032
- Figure 37: South America Waterproofing Chemicals Market Revenue Share (%), by End Use Sector 2024 & 2032
- Figure 38: South America Waterproofing Chemicals Market Volume Share (%), by End Use Sector 2024 & 2032
- Figure 39: South America Waterproofing Chemicals Market Revenue (Million), by Technology 2024 & 2032
- Figure 40: South America Waterproofing Chemicals Market Volume (K Tons), by Technology 2024 & 2032
- Figure 41: South America Waterproofing Chemicals Market Revenue Share (%), by Technology 2024 & 2032
- Figure 42: South America Waterproofing Chemicals Market Volume Share (%), by Technology 2024 & 2032
- Figure 43: South America Waterproofing Chemicals Market Revenue (Million), by Country 2024 & 2032
- Figure 44: South America Waterproofing Chemicals Market Volume (K Tons), by Country 2024 & 2032
- Figure 45: South America Waterproofing Chemicals Market Revenue Share (%), by Country 2024 & 2032
- Figure 46: South America Waterproofing Chemicals Market Volume Share (%), by Country 2024 & 2032
- Figure 47: Europe Waterproofing Chemicals Market Revenue (Million), by End Use Sector 2024 & 2032
- Figure 48: Europe Waterproofing Chemicals Market Volume (K Tons), by End Use Sector 2024 & 2032
- Figure 49: Europe Waterproofing Chemicals Market Revenue Share (%), by End Use Sector 2024 & 2032
- Figure 50: Europe Waterproofing Chemicals Market Volume Share (%), by End Use Sector 2024 & 2032
- Figure 51: Europe Waterproofing Chemicals Market Revenue (Million), by Technology 2024 & 2032
- Figure 52: Europe Waterproofing Chemicals Market Volume (K Tons), by Technology 2024 & 2032
- Figure 53: Europe Waterproofing Chemicals Market Revenue Share (%), by Technology 2024 & 2032
- Figure 54: Europe Waterproofing Chemicals Market Volume Share (%), by Technology 2024 & 2032
- Figure 55: Europe Waterproofing Chemicals Market Revenue (Million), by Country 2024 & 2032
- Figure 56: Europe Waterproofing Chemicals Market Volume (K Tons), by Country 2024 & 2032
- Figure 57: Europe Waterproofing Chemicals Market Revenue Share (%), by Country 2024 & 2032
- Figure 58: Europe Waterproofing Chemicals Market Volume Share (%), by Country 2024 & 2032
- Figure 59: Middle East & Africa Waterproofing Chemicals Market Revenue (Million), by End Use Sector 2024 & 2032
- Figure 60: Middle East & Africa Waterproofing Chemicals Market Volume (K Tons), by End Use Sector 2024 & 2032
- Figure 61: Middle East & Africa Waterproofing Chemicals Market Revenue Share (%), by End Use Sector 2024 & 2032
- Figure 62: Middle East & Africa Waterproofing Chemicals Market Volume Share (%), by End Use Sector 2024 & 2032
- Figure 63: Middle East & Africa Waterproofing Chemicals Market Revenue (Million), by Technology 2024 & 2032
- Figure 64: Middle East & Africa Waterproofing Chemicals Market Volume (K Tons), by Technology 2024 & 2032
- Figure 65: Middle East & Africa Waterproofing Chemicals Market Revenue Share (%), by Technology 2024 & 2032
- Figure 66: Middle East & Africa Waterproofing Chemicals Market Volume Share (%), by Technology 2024 & 2032
- Figure 67: Middle East & Africa Waterproofing Chemicals Market Revenue (Million), by Country 2024 & 2032
- Figure 68: Middle East & Africa Waterproofing Chemicals Market Volume (K Tons), by Country 2024 & 2032
- Figure 69: Middle East & Africa Waterproofing Chemicals Market Revenue Share (%), by Country 2024 & 2032
- Figure 70: Middle East & Africa Waterproofing Chemicals Market Volume Share (%), by Country 2024 & 2032
- Figure 71: Asia Pacific Waterproofing Chemicals Market Revenue (Million), by End Use Sector 2024 & 2032
- Figure 72: Asia Pacific Waterproofing Chemicals Market Volume (K Tons), by End Use Sector 2024 & 2032
- Figure 73: Asia Pacific Waterproofing Chemicals Market Revenue Share (%), by End Use Sector 2024 & 2032
- Figure 74: Asia Pacific Waterproofing Chemicals Market Volume Share (%), by End Use Sector 2024 & 2032
- Figure 75: Asia Pacific Waterproofing Chemicals Market Revenue (Million), by Technology 2024 & 2032
- Figure 76: Asia Pacific Waterproofing Chemicals Market Volume (K Tons), by Technology 2024 & 2032
- Figure 77: Asia Pacific Waterproofing Chemicals Market Revenue Share (%), by Technology 2024 & 2032
- Figure 78: Asia Pacific Waterproofing Chemicals Market Volume Share (%), by Technology 2024 & 2032
- Figure 79: Asia Pacific Waterproofing Chemicals Market Revenue (Million), by Country 2024 & 2032
- Figure 80: Asia Pacific Waterproofing Chemicals Market Volume (K Tons), by Country 2024 & 2032
- Figure 81: Asia Pacific Waterproofing Chemicals Market Revenue Share (%), by Country 2024 & 2032
- Figure 82: Asia Pacific Waterproofing Chemicals Market Volume Share (%), by Country 2024 & 2032
List of Tables
- Table 1: Global Waterproofing Chemicals Market Revenue Million Forecast, by Region 2019 & 2032
- Table 2: Global Waterproofing Chemicals Market Volume K Tons Forecast, by Region 2019 & 2032
- Table 3: Global Waterproofing Chemicals Market Revenue Million Forecast, by End Use Sector 2019 & 2032
- Table 4: Global Waterproofing Chemicals Market Volume K Tons Forecast, by End Use Sector 2019 & 2032
- Table 5: Global Waterproofing Chemicals Market Revenue Million Forecast, by Technology 2019 & 2032
- Table 6: Global Waterproofing Chemicals Market Volume K Tons Forecast, by Technology 2019 & 2032
- Table 7: Global Waterproofing Chemicals Market Revenue Million Forecast, by Region 2019 & 2032
- Table 8: Global Waterproofing Chemicals Market Volume K Tons Forecast, by Region 2019 & 2032
- Table 9: Global Waterproofing Chemicals Market Revenue Million Forecast, by Country 2019 & 2032
- Table 10: Global Waterproofing Chemicals Market Volume K Tons Forecast, by Country 2019 & 2032
- Table 11: United States Waterproofing Chemicals Market Revenue (Million) Forecast, by Application 2019 & 2032
- Table 12: United States Waterproofing Chemicals Market Volume (K Tons) Forecast, by Application 2019 & 2032
- Table 13: Canada Waterproofing Chemicals Market Revenue (Million) Forecast, by Application 2019 & 2032
- Table 14: Canada Waterproofing Chemicals Market Volume (K Tons) Forecast, by Application 2019 & 2032
- Table 15: Mexico Waterproofing Chemicals Market Revenue (Million) Forecast, by Application 2019 & 2032
- Table 16: Mexico Waterproofing Chemicals Market Volume (K Tons) Forecast, by Application 2019 & 2032
- Table 17: Global Waterproofing Chemicals Market Revenue Million Forecast, by Country 2019 & 2032
- Table 18: Global Waterproofing Chemicals Market Volume K Tons Forecast, by Country 2019 & 2032
- Table 19: Germany Waterproofing Chemicals Market Revenue (Million) Forecast, by Application 2019 & 2032
- Table 20: Germany Waterproofing Chemicals Market Volume (K Tons) Forecast, by Application 2019 & 2032
- Table 21: France Waterproofing Chemicals Market Revenue (Million) Forecast, by Application 2019 & 2032
- Table 22: France Waterproofing Chemicals Market Volume (K Tons) Forecast, by Application 2019 & 2032
- Table 23: Italy Waterproofing Chemicals Market Revenue (Million) Forecast, by Application 2019 & 2032
- Table 24: Italy Waterproofing Chemicals Market Volume (K Tons) Forecast, by Application 2019 & 2032
- Table 25: United Kingdom Waterproofing Chemicals Market Revenue (Million) Forecast, by Application 2019 & 2032
- Table 26: United Kingdom Waterproofing Chemicals Market Volume (K Tons) Forecast, by Application 2019 & 2032
- Table 27: Netherlands Waterproofing Chemicals Market Revenue (Million) Forecast, by Application 2019 & 2032
- Table 28: Netherlands Waterproofing Chemicals Market Volume (K Tons) Forecast, by Application 2019 & 2032
- Table 29: Rest of Europe Waterproofing Chemicals Market Revenue (Million) Forecast, by Application 2019 & 2032
- Table 30: Rest of Europe Waterproofing Chemicals Market Volume (K Tons) Forecast, by Application 2019 & 2032
- Table 31: Global Waterproofing Chemicals Market Revenue Million Forecast, by Country 2019 & 2032
- Table 32: Global Waterproofing Chemicals Market Volume K Tons Forecast, by Country 2019 & 2032
- Table 33: China Waterproofing Chemicals Market Revenue (Million) Forecast, by Application 2019 & 2032
- Table 34: China Waterproofing Chemicals Market Volume (K Tons) Forecast, by Application 2019 & 2032
- Table 35: Japan Waterproofing Chemicals Market Revenue (Million) Forecast, by Application 2019 & 2032
- Table 36: Japan Waterproofing Chemicals Market Volume (K Tons) Forecast, by Application 2019 & 2032
- Table 37: India Waterproofing Chemicals Market Revenue (Million) Forecast, by Application 2019 & 2032
- Table 38: India Waterproofing Chemicals Market Volume (K Tons) Forecast, by Application 2019 & 2032
- Table 39: South Korea Waterproofing Chemicals Market Revenue (Million) Forecast, by Application 2019 & 2032
- Table 40: South Korea Waterproofing Chemicals Market Volume (K Tons) Forecast, by Application 2019 & 2032
- Table 41: Taiwan Waterproofing Chemicals Market Revenue (Million) Forecast, by Application 2019 & 2032
- Table 42: Taiwan Waterproofing Chemicals Market Volume (K Tons) Forecast, by Application 2019 & 2032
- Table 43: Australia Waterproofing Chemicals Market Revenue (Million) Forecast, by Application 2019 & 2032
- Table 44: Australia Waterproofing Chemicals Market Volume (K Tons) Forecast, by Application 2019 & 2032
- Table 45: Rest of Asia-Pacific Waterproofing Chemicals Market Revenue (Million) Forecast, by Application 2019 & 2032
- Table 46: Rest of Asia-Pacific Waterproofing Chemicals Market Volume (K Tons) Forecast, by Application 2019 & 2032
- Table 47: Global Waterproofing Chemicals Market Revenue Million Forecast, by Country 2019 & 2032
- Table 48: Global Waterproofing Chemicals Market Volume K Tons Forecast, by Country 2019 & 2032
- Table 49: Brazil Waterproofing Chemicals Market Revenue (Million) Forecast, by Application 2019 & 2032
- Table 50: Brazil Waterproofing Chemicals Market Volume (K Tons) Forecast, by Application 2019 & 2032
- Table 51: Argentina Waterproofing Chemicals Market Revenue (Million) Forecast, by Application 2019 & 2032
- Table 52: Argentina Waterproofing Chemicals Market Volume (K Tons) Forecast, by Application 2019 & 2032
- Table 53: Rest of South America Waterproofing Chemicals Market Revenue (Million) Forecast, by Application 2019 & 2032
- Table 54: Rest of South America Waterproofing Chemicals Market Volume (K Tons) Forecast, by Application 2019 & 2032
- Table 55: Global Waterproofing Chemicals Market Revenue Million Forecast, by Country 2019 & 2032
- Table 56: Global Waterproofing Chemicals Market Volume K Tons Forecast, by Country 2019 & 2032
- Table 57: Middle East Waterproofing Chemicals Market Revenue (Million) Forecast, by Application 2019 & 2032
- Table 58: Middle East Waterproofing Chemicals Market Volume (K Tons) Forecast, by Application 2019 & 2032
- Table 59: Africa Waterproofing Chemicals Market Revenue (Million) Forecast, by Application 2019 & 2032
- Table 60: Africa Waterproofing Chemicals Market Volume (K Tons) Forecast, by Application 2019 & 2032
- Table 61: Global Waterproofing Chemicals Market Revenue Million Forecast, by End Use Sector 2019 & 2032
- Table 62: Global Waterproofing Chemicals Market Volume K Tons Forecast, by End Use Sector 2019 & 2032
- Table 63: Global Waterproofing Chemicals Market Revenue Million Forecast, by Technology 2019 & 2032
- Table 64: Global Waterproofing Chemicals Market Volume K Tons Forecast, by Technology 2019 & 2032
- Table 65: Global Waterproofing Chemicals Market Revenue Million Forecast, by Country 2019 & 2032
- Table 66: Global Waterproofing Chemicals Market Volume K Tons Forecast, by Country 2019 & 2032
- Table 67: United States Waterproofing Chemicals Market Revenue (Million) Forecast, by Application 2019 & 2032
- Table 68: United States Waterproofing Chemicals Market Volume (K Tons) Forecast, by Application 2019 & 2032
- Table 69: Canada Waterproofing Chemicals Market Revenue (Million) Forecast, by Application 2019 & 2032
- Table 70: Canada Waterproofing Chemicals Market Volume (K Tons) Forecast, by Application 2019 & 2032
- Table 71: Mexico Waterproofing Chemicals Market Revenue (Million) Forecast, by Application 2019 & 2032
- Table 72: Mexico Waterproofing Chemicals Market Volume (K Tons) Forecast, by Application 2019 & 2032
- Table 73: Global Waterproofing Chemicals Market Revenue Million Forecast, by End Use Sector 2019 & 2032
- Table 74: Global Waterproofing Chemicals Market Volume K Tons Forecast, by End Use Sector 2019 & 2032
- Table 75: Global Waterproofing Chemicals Market Revenue Million Forecast, by Technology 2019 & 2032
- Table 76: Global Waterproofing Chemicals Market Volume K Tons Forecast, by Technology 2019 & 2032
- Table 77: Global Waterproofing Chemicals Market Revenue Million Forecast, by Country 2019 & 2032
- Table 78: Global Waterproofing Chemicals Market Volume K Tons Forecast, by Country 2019 & 2032
- Table 79: Brazil Waterproofing Chemicals Market Revenue (Million) Forecast, by Application 2019 & 2032
- Table 80: Brazil Waterproofing Chemicals Market Volume (K Tons) Forecast, by Application 2019 & 2032
- Table 81: Argentina Waterproofing Chemicals Market Revenue (Million) Forecast, by Application 2019 & 2032
- Table 82: Argentina Waterproofing Chemicals Market Volume (K Tons) Forecast, by Application 2019 & 2032
- Table 83: Rest of South America Waterproofing Chemicals Market Revenue (Million) Forecast, by Application 2019 & 2032
- Table 84: Rest of South America Waterproofing Chemicals Market Volume (K Tons) Forecast, by Application 2019 & 2032
- Table 85: Global Waterproofing Chemicals Market Revenue Million Forecast, by End Use Sector 2019 & 2032
- Table 86: Global Waterproofing Chemicals Market Volume K Tons Forecast, by End Use Sector 2019 & 2032
- Table 87: Global Waterproofing Chemicals Market Revenue Million Forecast, by Technology 2019 & 2032
- Table 88: Global Waterproofing Chemicals Market Volume K Tons Forecast, by Technology 2019 & 2032
- Table 89: Global Waterproofing Chemicals Market Revenue Million Forecast, by Country 2019 & 2032
- Table 90: Global Waterproofing Chemicals Market Volume K Tons Forecast, by Country 2019 & 2032
- Table 91: United Kingdom Waterproofing Chemicals Market Revenue (Million) Forecast, by Application 2019 & 2032
- Table 92: United Kingdom Waterproofing Chemicals Market Volume (K Tons) Forecast, by Application 2019 & 2032
- Table 93: Germany Waterproofing Chemicals Market Revenue (Million) Forecast, by Application 2019 & 2032
- Table 94: Germany Waterproofing Chemicals Market Volume (K Tons) Forecast, by Application 2019 & 2032
- Table 95: France Waterproofing Chemicals Market Revenue (Million) Forecast, by Application 2019 & 2032
- Table 96: France Waterproofing Chemicals Market Volume (K Tons) Forecast, by Application 2019 & 2032
- Table 97: Italy Waterproofing Chemicals Market Revenue (Million) Forecast, by Application 2019 & 2032
- Table 98: Italy Waterproofing Chemicals Market Volume (K Tons) Forecast, by Application 2019 & 2032
- Table 99: Spain Waterproofing Chemicals Market Revenue (Million) Forecast, by Application 2019 & 2032
- Table 100: Spain Waterproofing Chemicals Market Volume (K Tons) Forecast, by Application 2019 & 2032
- Table 101: Russia Waterproofing Chemicals Market Revenue (Million) Forecast, by Application 2019 & 2032
- Table 102: Russia Waterproofing Chemicals Market Volume (K Tons) Forecast, by Application 2019 & 2032
- Table 103: Benelux Waterproofing Chemicals Market Revenue (Million) Forecast, by Application 2019 & 2032
- Table 104: Benelux Waterproofing Chemicals Market Volume (K Tons) Forecast, by Application 2019 & 2032
- Table 105: Nordics Waterproofing Chemicals Market Revenue (Million) Forecast, by Application 2019 & 2032
- Table 106: Nordics Waterproofing Chemicals Market Volume (K Tons) Forecast, by Application 2019 & 2032
- Table 107: Rest of Europe Waterproofing Chemicals Market Revenue (Million) Forecast, by Application 2019 & 2032
- Table 108: Rest of Europe Waterproofing Chemicals Market Volume (K Tons) Forecast, by Application 2019 & 2032
- Table 109: Global Waterproofing Chemicals Market Revenue Million Forecast, by End Use Sector 2019 & 2032
- Table 110: Global Waterproofing Chemicals Market Volume K Tons Forecast, by End Use Sector 2019 & 2032
- Table 111: Global Waterproofing Chemicals Market Revenue Million Forecast, by Technology 2019 & 2032
- Table 112: Global Waterproofing Chemicals Market Volume K Tons Forecast, by Technology 2019 & 2032
- Table 113: Global Waterproofing Chemicals Market Revenue Million Forecast, by Country 2019 & 2032
- Table 114: Global Waterproofing Chemicals Market Volume K Tons Forecast, by Country 2019 & 2032
- Table 115: Turkey Waterproofing Chemicals Market Revenue (Million) Forecast, by Application 2019 & 2032
- Table 116: Turkey Waterproofing Chemicals Market Volume (K Tons) Forecast, by Application 2019 & 2032
- Table 117: Israel Waterproofing Chemicals Market Revenue (Million) Forecast, by Application 2019 & 2032
- Table 118: Israel Waterproofing Chemicals Market Volume (K Tons) Forecast, by Application 2019 & 2032
- Table 119: GCC Waterproofing Chemicals Market Revenue (Million) Forecast, by Application 2019 & 2032
- Table 120: GCC Waterproofing Chemicals Market Volume (K Tons) Forecast, by Application 2019 & 2032
- Table 121: North Africa Waterproofing Chemicals Market Revenue (Million) Forecast, by Application 2019 & 2032
- Table 122: North Africa Waterproofing Chemicals Market Volume (K Tons) Forecast, by Application 2019 & 2032
- Table 123: South Africa Waterproofing Chemicals Market Revenue (Million) Forecast, by Application 2019 & 2032
- Table 124: South Africa Waterproofing Chemicals Market Volume (K Tons) Forecast, by Application 2019 & 2032
- Table 125: Rest of Middle East & Africa Waterproofing Chemicals Market Revenue (Million) Forecast, by Application 2019 & 2032
- Table 126: Rest of Middle East & Africa Waterproofing Chemicals Market Volume (K Tons) Forecast, by Application 2019 & 2032
- Table 127: Global Waterproofing Chemicals Market Revenue Million Forecast, by End Use Sector 2019 & 2032
- Table 128: Global Waterproofing Chemicals Market Volume K Tons Forecast, by End Use Sector 2019 & 2032
- Table 129: Global Waterproofing Chemicals Market Revenue Million Forecast, by Technology 2019 & 2032
- Table 130: Global Waterproofing Chemicals Market Volume K Tons Forecast, by Technology 2019 & 2032
- Table 131: Global Waterproofing Chemicals Market Revenue Million Forecast, by Country 2019 & 2032
- Table 132: Global Waterproofing Chemicals Market Volume K Tons Forecast, by Country 2019 & 2032
- Table 133: China Waterproofing Chemicals Market Revenue (Million) Forecast, by Application 2019 & 2032
- Table 134: China Waterproofing Chemicals Market Volume (K Tons) Forecast, by Application 2019 & 2032
- Table 135: India Waterproofing Chemicals Market Revenue (Million) Forecast, by Application 2019 & 2032
- Table 136: India Waterproofing Chemicals Market Volume (K Tons) Forecast, by Application 2019 & 2032
- Table 137: Japan Waterproofing Chemicals Market Revenue (Million) Forecast, by Application 2019 & 2032
- Table 138: Japan Waterproofing Chemicals Market Volume (K Tons) Forecast, by Application 2019 & 2032
- Table 139: South Korea Waterproofing Chemicals Market Revenue (Million) Forecast, by Application 2019 & 2032
- Table 140: South Korea Waterproofing Chemicals Market Volume (K Tons) Forecast, by Application 2019 & 2032
- Table 141: ASEAN Waterproofing Chemicals Market Revenue (Million) Forecast, by Application 2019 & 2032
- Table 142: ASEAN Waterproofing Chemicals Market Volume (K Tons) Forecast, by Application 2019 & 2032
- Table 143: Oceania Waterproofing Chemicals Market Revenue (Million) Forecast, by Application 2019 & 2032
- Table 144: Oceania Waterproofing Chemicals Market Volume (K Tons) Forecast, by Application 2019 & 2032
- Table 145: Rest of Asia Pacific Waterproofing Chemicals Market Revenue (Million) Forecast, by Application 2019 & 2032
- Table 146: Rest of Asia Pacific Waterproofing Chemicals Market Volume (K Tons) Forecast, by Application 2019 & 2032
Frequently Asked Questions
1. What is the projected Compound Annual Growth Rate (CAGR) of the Waterproofing Chemicals Market?
The projected CAGR is approximately 6.8%.
2. Which companies are prominent players in the Waterproofing Chemicals Market?
Key companies in the market include Hongyuan Waterproof Technology Group Co Ltd, Saint-Gobain, Soprema, Fosroc Inc, Ardex Group, MAPEI S p A, Sika AG, Keshun Waterproof Technology Co ltd, Standard Industries Inc, Oriental Yuhong.
3. What are the main segments of the Waterproofing Chemicals Market?
The market segments include End Use Sector, Technology.
4. Can you provide details about the market size?
The market size is estimated to be USD XX Million as of 2022.
5. What are some drivers contributing to market growth?
; Banning/ Limiting Use of Plastics used in packaging applications.
6. What are the notable trends driving market growth?
OTHER KEY INDUSTRY TRENDS COVERED IN THE REPORT.
7. Are there any restraints impacting market growth?
; Harmful Amines in Dyes; Paperless Green Initiatives.
8. Can you provide examples of recent developments in the market?
November 2022: MAPEI invested in its German subsidiary, Sopro Bauchemie, which manufactures concrete admixtures, anchors & grouts, dry-mix mortars, and waterproofing solutions, to expand its production capacity and upgrade its research and development facilities.May 2022: Sika AG recently completed its acquisition of United Gilsonite Laboratories, a company based in the United States. This move was aimed at bolstering Sika AG's range of waterproofing solutions within the US market.January 2022: SOPREMA has developed a next-generation waterproofing chemical called Alsan Flashing Neo, which can waterproof any substrate without a primer.
9. What pricing options are available for accessing the report?
Pricing options include single-user, multi-user, and enterprise licenses priced at USD 3800, USD 4500, and USD 5800 respectively.
10. Is the market size provided in terms of value or volume?
The market size is provided in terms of value, measured in Million and volume, measured in K Tons.
11. Are there any specific market keywords associated with the report?
Yes, the market keyword associated with the report is "Waterproofing Chemicals Market," which aids in identifying and referencing the specific market segment covered.
12. How do I determine which pricing option suits my needs best?
The pricing options vary based on user requirements and access needs. Individual users may opt for single-user licenses, while businesses requiring broader access may choose multi-user or enterprise licenses for cost-effective access to the report.
13. Are there any additional resources or data provided in the Waterproofing Chemicals Market report?
While the report offers comprehensive insights, it's advisable to review the specific contents or supplementary materials provided to ascertain if additional resources or data are available.
14. How can I stay updated on further developments or reports in the Waterproofing Chemicals Market?
To stay informed about further developments, trends, and reports in the Waterproofing Chemicals Market, consider subscribing to industry newsletters, following relevant companies and organizations, or regularly checking reputable industry news sources and publications.
Methodology
Step 1 - Identification of Relevant Samples Size from Population Database


Step 2 - Approaches for Defining Global Market Size (Value, Volume* & Price*)

Note*: In applicable scenarios
Step 3 - Data Sources
Primary Research
- Web Analytics
- Survey Reports
- Research Institute
- Latest Research Reports
- Opinion Leaders
Secondary Research
- Annual Reports
- White Paper
- Latest Press Release
- Industry Association
- Paid Database
- Investor Presentations

Step 4 - Data Triangulation
Involves using different sources of information in order to increase the validity of a study
These sources are likely to be stakeholders in a program - participants, other researchers, program staff, other community members, and so on.
Then we put all data in single framework & apply various statistical tools to find out the dynamic on the market.
During the analysis stage, feedback from the stakeholder groups would be compared to determine areas of agreement as well as areas of divergence


