
Key Insights
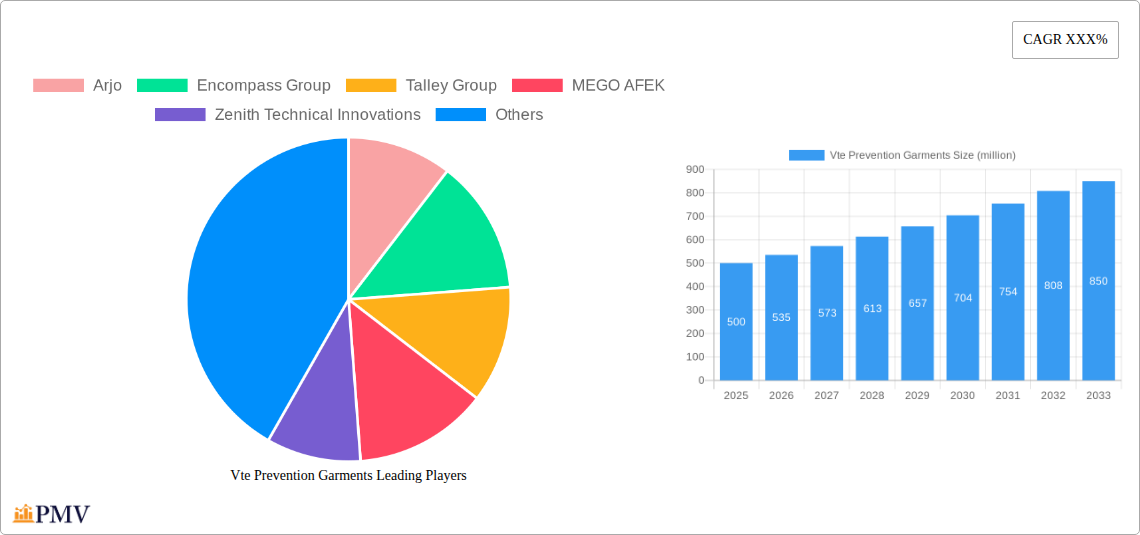
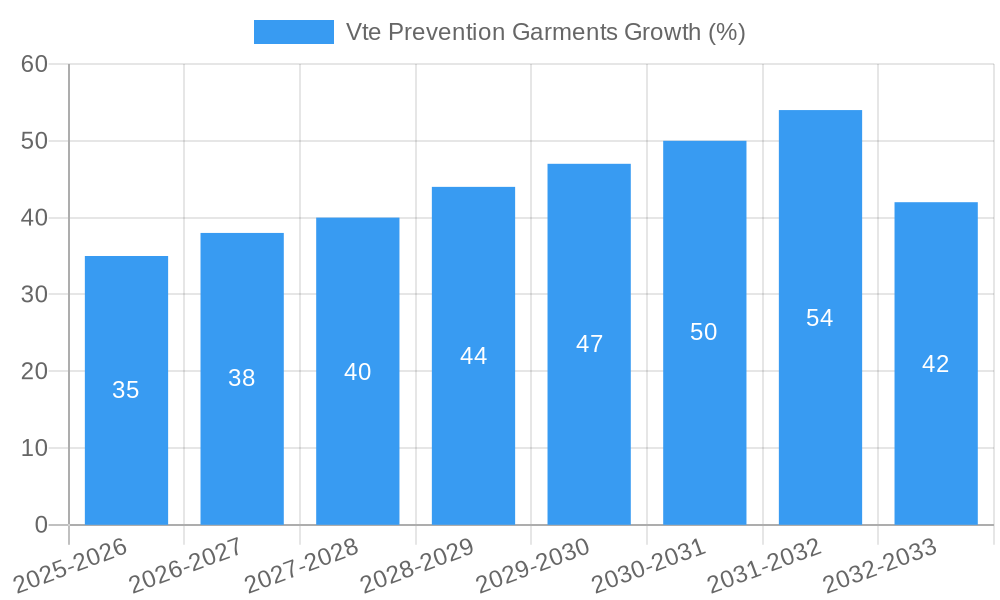
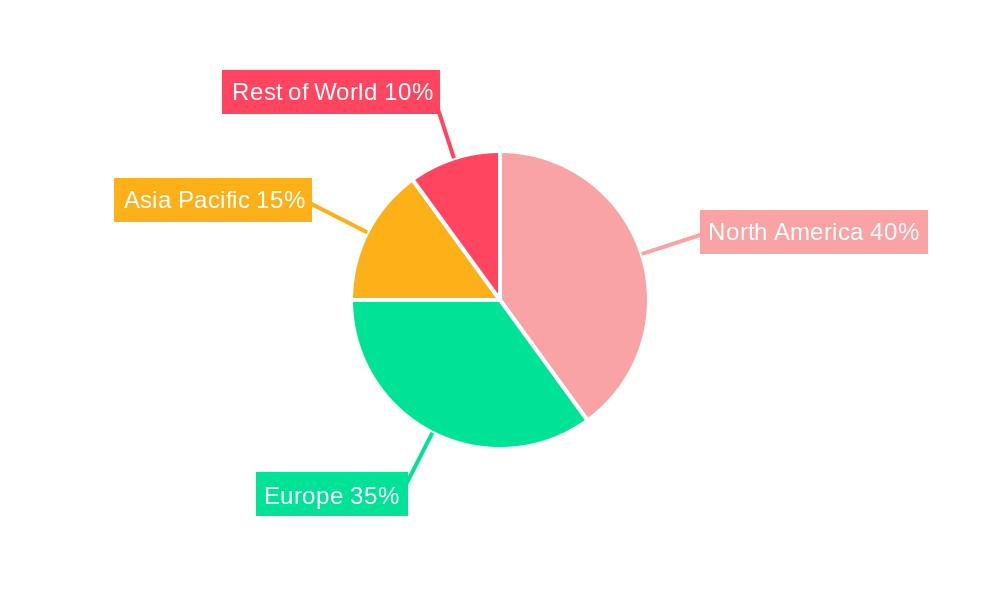
The VTE Prevention Garments market is experiencing robust growth, driven by increasing awareness of venous thromboembolism (VTE) risks, rising geriatric populations, and advancements in garment technology. The market, estimated at $500 million in 2025, is projected to achieve a Compound Annual Growth Rate (CAGR) of 7% from 2025 to 2033, reaching approximately $850 million by 2033. Key growth drivers include the increasing prevalence of sedentary lifestyles and long-duration travel, leading to a greater susceptibility to VTE. Furthermore, technological innovations focusing on improved comfort, enhanced compression levels, and the incorporation of smart features are fueling market expansion. Major players like Arjo, Encompass Group, and Normatec are driving competition through product diversification and strategic partnerships. However, the market faces certain restraints, including high initial costs associated with specialized garments and potential skin irritation or discomfort for certain users. The market is segmented by garment type (knee-high, thigh-high, full-leg), material (elastic, non-elastic), and end-user (hospitals, home care). Regional variations in healthcare spending and VTE prevalence influence market penetration, with North America and Europe currently dominating the market share. Future growth will be significantly impacted by the increasing adoption of preventative measures in healthcare facilities and the growing awareness of VTE among consumers.
The competitive landscape is characterized by a mix of established players and emerging companies. Companies are focusing on R&D to develop innovative products that address market needs for enhanced comfort, breathability, and efficacy. Marketing strategies emphasizing the long-term benefits of VTE prevention and reducing the cost-burden associated with VTE treatment are also crucial for driving market growth. Regulatory approvals and reimbursements play a key role in determining market access, particularly in the hospital and healthcare settings. Further research into the effectiveness of different garment designs and materials will be critical to shaping future market trends and improving patient outcomes. Overall, the VTE Prevention Garments market presents a significant opportunity for growth and innovation, driven by a confluence of factors related to public health, technological advancements, and increasing healthcare spending.
Comprehensive Report: VTE Prevention Garments Market Analysis (2019-2033)
This detailed report provides a comprehensive analysis of the global VTE Prevention Garments market, offering invaluable insights for industry stakeholders, investors, and researchers. The study period spans from 2019 to 2033, with 2025 serving as the base and estimated year. The report projects market trends and forecasts from 2025 to 2033, analyzing data from the historical period of 2019-2024. The market is valued at $XX million in 2025 and is projected to reach $XX million by 2033, exhibiting a CAGR of XX%.
VTE Prevention Garments Market Structure & Competitive Dynamics
The VTE prevention garments market exhibits a moderately consolidated structure, with several key players holding significant market share. Arjo, Encompass Group, Talley Group, MEGO AFEK, Zenith Technical Innovations, Normatec, Bio Compression Systems, and ThermoTek USA are among the prominent companies shaping the competitive landscape. Market share is dynamic, with ongoing innovation and M&A activity influencing market concentration. In 2024, the top five players collectively held approximately 60% of the global market share. The estimated value of M&A deals in the sector during 2019-2024 was $XX million, reflecting a growing trend of consolidation and strategic acquisitions. Regulatory frameworks, particularly those concerning medical device approvals and safety standards, significantly impact market dynamics. Product substitutes, such as pharmaceutical interventions, pose competitive challenges, while increasing awareness of VTE risks drives demand for prevention garments. End-user trends are favoring innovative designs offering enhanced comfort and efficacy.
- Market Concentration: Moderately consolidated with top 5 players holding 60% market share (2024).
- Innovation Ecosystems: Active collaborations between manufacturers and healthcare providers.
- Regulatory Frameworks: Stringent regulations impacting market entry and product approvals.
- Product Substitutes: Pharmaceutical interventions present a competitive challenge.
- End-User Trends: Demand for comfortable and effective garments is growing.
- M&A Activities: $XX million in M&A deal value (2019-2024).
VTE Prevention Garments Industry Trends & Insights
The VTE prevention garments market is experiencing robust growth, driven primarily by rising prevalence of venous thromboembolism (VTE), increasing awareness of VTE prevention among healthcare professionals and patients, technological advancements leading to improved garment designs and efficacy, and a growing aging population globally. The market is also influenced by consumer preference for comfortable and discreet garments, alongside favorable reimbursement policies in several countries. Technological disruptions include the incorporation of advanced materials, improved compression technology, and smart sensors for personalized monitoring. Competitive dynamics involve product differentiation, pricing strategies, and distribution network expansion. The market is witnessing a notable increase in the adoption of gradient compression garments, driven by their superior efficacy in preventing VTE. The estimated market penetration of gradient compression garments is approximately XX% in 2025.
Dominant Markets & Segments in VTE Prevention Garments
The North American region dominates the global VTE prevention garments market, accounting for approximately XX% of the total market revenue in 2025. This dominance is attributed to several factors:
- Strong Healthcare Infrastructure: Well-developed healthcare systems and advanced medical facilities.
- High Prevalence of VTE: Higher incidence of VTE cases compared to other regions.
- Favorable Reimbursement Policies: Medicare and Medicaid coverage significantly boost market demand.
- High Awareness Levels: Increased awareness among healthcare professionals and patients regarding VTE prevention.
- Technological Advancements: Early adoption of innovative VTE prevention garments.
The hospital segment holds a significant share, driven by the high number of patients at risk of VTE and the emphasis on preventative measures within healthcare settings.
VTE Prevention Garments Product Innovations
Recent product innovations focus on enhanced comfort, improved compression technology, and the integration of smart features. Manufacturers are incorporating advanced materials like breathable fabrics and antimicrobial agents to enhance user experience. The development of garments with adjustable compression levels and integrated sensors for personalized monitoring are gaining traction. These innovations address key market needs, improving patient compliance and treatment effectiveness.
Report Segmentation & Scope
The report segments the VTE prevention garments market based on several factors:
By Product Type: This includes knee-high stockings, thigh-high stockings, full-body garments, and others. Each segment presents unique growth trajectories and competitive landscapes. For example, the knee-high stockings segment is expected to maintain a significant market share, while the full-body garments segment showcases higher growth potential.
By End-User: The market is segmented into hospitals, clinics, ambulatory surgery centers, and home care settings, with differing market dynamics and growth rates within each.
By Distribution Channel: This includes hospitals, pharmacies, online retailers, and others.
Key Drivers of VTE Prevention Garments Growth
The market's growth is fueled by several key drivers: rising prevalence of VTE, an aging global population, increasing healthcare expenditure, and technological advancements leading to the development of more comfortable and effective garments. Stringent regulations mandating VTE prevention protocols in hospitals and other healthcare settings also contribute to the market expansion. Furthermore, rising awareness campaigns promoting VTE prevention among the general population and healthcare providers are significantly impacting market growth.
Challenges in the VTE Prevention Garments Sector
Challenges include stringent regulatory requirements for medical device approval, potential supply chain disruptions impacting material sourcing and manufacturing, and intense competition among existing players. High production costs and the relatively high price points of advanced garments can limit accessibility and market penetration, particularly in developing economies. The market faces pricing pressure due to the increasing number of product offerings and the potential for generic versions to emerge.
Leading Players in the VTE Prevention Garments Market
- Arjo
- Encompass Group
- Talley Group
- MEGO AFEK
- Zenith Technical Innovations
- Normatec
- Bio Compression Systems
- ThermoTek USA
Key Developments in VTE Prevention Garments Sector
- 2022-Q4: Arjo launched a new line of VTE prevention garments incorporating smart sensor technology.
- 2023-Q1: Encompass Group acquired a smaller competitor, expanding its product portfolio.
- 2024-Q2: New FDA guidelines on VTE prevention influenced product development and market strategies. (Further specific developments would need to be added based on actual market data.)
Strategic VTE Prevention Garments Market Outlook
The VTE prevention garments market holds substantial growth potential driven by continuous technological innovations, increasing awareness of VTE prevention, and the expanding aging population. Strategic opportunities include expanding into emerging markets, developing personalized prevention solutions, and fostering collaborations with healthcare providers to promote market penetration. Focus on cost-effective manufacturing, along with strategic partnerships and acquisitions, will play crucial roles in shaping the market landscape.
Vte Prevention Garments Segmentation
-
1. Application
- 1.1. Hospitals
- 1.2. Surgical Centers
- 1.3. Other
-
2. Type
- 2.1. Lower Extremity
- 2.2. Upper Extremity
Vte Prevention Garments Segmentation By Geography
-
1. North America
- 1.1. United States
- 1.2. Canada
- 1.3. Mexico
-
2. South America
- 2.1. Brazil
- 2.2. Argentina
- 2.3. Rest of South America
-
3. Europe
- 3.1. United Kingdom
- 3.2. Germany
- 3.3. France
- 3.4. Italy
- 3.5. Spain
- 3.6. Russia
- 3.7. Benelux
- 3.8. Nordics
- 3.9. Rest of Europe
-
4. Middle East & Africa
- 4.1. Turkey
- 4.2. Israel
- 4.3. GCC
- 4.4. North Africa
- 4.5. South Africa
- 4.6. Rest of Middle East & Africa
-
5. Asia Pacific
- 5.1. China
- 5.2. India
- 5.3. Japan
- 5.4. South Korea
- 5.5. ASEAN
- 5.6. Oceania
- 5.7. Rest of Asia Pacific
Vte Prevention Garments REPORT HIGHLIGHTS
| Aspects | Details |
|---|---|
| Study Period | 2019-2033 |
| Base Year | 2024 |
| Estimated Year | 2025 |
| Forecast Period | 2025-2033 |
| Historical Period | 2019-2024 |
| Growth Rate | CAGR of XXX% from 2019-2033 |
| Segmentation |
|
Table of Contents
- 1. Introduction
- 1.1. Research Scope
- 1.2. Market Segmentation
- 1.3. Research Methodology
- 1.4. Definitions and Assumptions
- 2. Executive Summary
- 2.1. Introduction
- 3. Market Dynamics
- 3.1. Introduction
- 3.2. Market Drivers
- 3.3. Market Restrains
- 3.4. Market Trends
- 4. Market Factor Analysis
- 4.1. Porters Five Forces
- 4.2. Supply/Value Chain
- 4.3. PESTEL analysis
- 4.4. Market Entropy
- 4.5. Patent/Trademark Analysis
- 5. Global Vte Prevention Garments Analysis, Insights and Forecast, 2019-2031
- 5.1. Market Analysis, Insights and Forecast - by Application
- 5.1.1. Hospitals
- 5.1.2. Surgical Centers
- 5.1.3. Other
- 5.2. Market Analysis, Insights and Forecast - by Type
- 5.2.1. Lower Extremity
- 5.2.2. Upper Extremity
- 5.3. Market Analysis, Insights and Forecast - by Region
- 5.3.1. North America
- 5.3.2. South America
- 5.3.3. Europe
- 5.3.4. Middle East & Africa
- 5.3.5. Asia Pacific
- 5.1. Market Analysis, Insights and Forecast - by Application
- 6. North America Vte Prevention Garments Analysis, Insights and Forecast, 2019-2031
- 6.1. Market Analysis, Insights and Forecast - by Application
- 6.1.1. Hospitals
- 6.1.2. Surgical Centers
- 6.1.3. Other
- 6.2. Market Analysis, Insights and Forecast - by Type
- 6.2.1. Lower Extremity
- 6.2.2. Upper Extremity
- 6.1. Market Analysis, Insights and Forecast - by Application
- 7. South America Vte Prevention Garments Analysis, Insights and Forecast, 2019-2031
- 7.1. Market Analysis, Insights and Forecast - by Application
- 7.1.1. Hospitals
- 7.1.2. Surgical Centers
- 7.1.3. Other
- 7.2. Market Analysis, Insights and Forecast - by Type
- 7.2.1. Lower Extremity
- 7.2.2. Upper Extremity
- 7.1. Market Analysis, Insights and Forecast - by Application
- 8. Europe Vte Prevention Garments Analysis, Insights and Forecast, 2019-2031
- 8.1. Market Analysis, Insights and Forecast - by Application
- 8.1.1. Hospitals
- 8.1.2. Surgical Centers
- 8.1.3. Other
- 8.2. Market Analysis, Insights and Forecast - by Type
- 8.2.1. Lower Extremity
- 8.2.2. Upper Extremity
- 8.1. Market Analysis, Insights and Forecast - by Application
- 9. Middle East & Africa Vte Prevention Garments Analysis, Insights and Forecast, 2019-2031
- 9.1. Market Analysis, Insights and Forecast - by Application
- 9.1.1. Hospitals
- 9.1.2. Surgical Centers
- 9.1.3. Other
- 9.2. Market Analysis, Insights and Forecast - by Type
- 9.2.1. Lower Extremity
- 9.2.2. Upper Extremity
- 9.1. Market Analysis, Insights and Forecast - by Application
- 10. Asia Pacific Vte Prevention Garments Analysis, Insights and Forecast, 2019-2031
- 10.1. Market Analysis, Insights and Forecast - by Application
- 10.1.1. Hospitals
- 10.1.2. Surgical Centers
- 10.1.3. Other
- 10.2. Market Analysis, Insights and Forecast - by Type
- 10.2.1. Lower Extremity
- 10.2.2. Upper Extremity
- 10.1. Market Analysis, Insights and Forecast - by Application
- 11. Competitive Analysis
- 11.1. Global Market Share Analysis 2024
- 11.2. Company Profiles
- 11.2.1 Arjo
- 11.2.1.1. Overview
- 11.2.1.2. Products
- 11.2.1.3. SWOT Analysis
- 11.2.1.4. Recent Developments
- 11.2.1.5. Financials (Based on Availability)
- 11.2.2 Encompass Group
- 11.2.2.1. Overview
- 11.2.2.2. Products
- 11.2.2.3. SWOT Analysis
- 11.2.2.4. Recent Developments
- 11.2.2.5. Financials (Based on Availability)
- 11.2.3 Talley Group
- 11.2.3.1. Overview
- 11.2.3.2. Products
- 11.2.3.3. SWOT Analysis
- 11.2.3.4. Recent Developments
- 11.2.3.5. Financials (Based on Availability)
- 11.2.4 MEGO AFEK
- 11.2.4.1. Overview
- 11.2.4.2. Products
- 11.2.4.3. SWOT Analysis
- 11.2.4.4. Recent Developments
- 11.2.4.5. Financials (Based on Availability)
- 11.2.5 Zenith Technical Innovations
- 11.2.5.1. Overview
- 11.2.5.2. Products
- 11.2.5.3. SWOT Analysis
- 11.2.5.4. Recent Developments
- 11.2.5.5. Financials (Based on Availability)
- 11.2.6 Normatec
- 11.2.6.1. Overview
- 11.2.6.2. Products
- 11.2.6.3. SWOT Analysis
- 11.2.6.4. Recent Developments
- 11.2.6.5. Financials (Based on Availability)
- 11.2.7 Bio Compression Systems
- 11.2.7.1. Overview
- 11.2.7.2. Products
- 11.2.7.3. SWOT Analysis
- 11.2.7.4. Recent Developments
- 11.2.7.5. Financials (Based on Availability)
- 11.2.8 ThermoTek USA
- 11.2.8.1. Overview
- 11.2.8.2. Products
- 11.2.8.3. SWOT Analysis
- 11.2.8.4. Recent Developments
- 11.2.8.5. Financials (Based on Availability)
- 11.2.1 Arjo
List of Figures
- Figure 1: Global Vte Prevention Garments Revenue Breakdown (million, %) by Region 2024 & 2032
- Figure 2: North America Vte Prevention Garments Revenue (million), by Application 2024 & 2032
- Figure 3: North America Vte Prevention Garments Revenue Share (%), by Application 2024 & 2032
- Figure 4: North America Vte Prevention Garments Revenue (million), by Type 2024 & 2032
- Figure 5: North America Vte Prevention Garments Revenue Share (%), by Type 2024 & 2032
- Figure 6: North America Vte Prevention Garments Revenue (million), by Country 2024 & 2032
- Figure 7: North America Vte Prevention Garments Revenue Share (%), by Country 2024 & 2032
- Figure 8: South America Vte Prevention Garments Revenue (million), by Application 2024 & 2032
- Figure 9: South America Vte Prevention Garments Revenue Share (%), by Application 2024 & 2032
- Figure 10: South America Vte Prevention Garments Revenue (million), by Type 2024 & 2032
- Figure 11: South America Vte Prevention Garments Revenue Share (%), by Type 2024 & 2032
- Figure 12: South America Vte Prevention Garments Revenue (million), by Country 2024 & 2032
- Figure 13: South America Vte Prevention Garments Revenue Share (%), by Country 2024 & 2032
- Figure 14: Europe Vte Prevention Garments Revenue (million), by Application 2024 & 2032
- Figure 15: Europe Vte Prevention Garments Revenue Share (%), by Application 2024 & 2032
- Figure 16: Europe Vte Prevention Garments Revenue (million), by Type 2024 & 2032
- Figure 17: Europe Vte Prevention Garments Revenue Share (%), by Type 2024 & 2032
- Figure 18: Europe Vte Prevention Garments Revenue (million), by Country 2024 & 2032
- Figure 19: Europe Vte Prevention Garments Revenue Share (%), by Country 2024 & 2032
- Figure 20: Middle East & Africa Vte Prevention Garments Revenue (million), by Application 2024 & 2032
- Figure 21: Middle East & Africa Vte Prevention Garments Revenue Share (%), by Application 2024 & 2032
- Figure 22: Middle East & Africa Vte Prevention Garments Revenue (million), by Type 2024 & 2032
- Figure 23: Middle East & Africa Vte Prevention Garments Revenue Share (%), by Type 2024 & 2032
- Figure 24: Middle East & Africa Vte Prevention Garments Revenue (million), by Country 2024 & 2032
- Figure 25: Middle East & Africa Vte Prevention Garments Revenue Share (%), by Country 2024 & 2032
- Figure 26: Asia Pacific Vte Prevention Garments Revenue (million), by Application 2024 & 2032
- Figure 27: Asia Pacific Vte Prevention Garments Revenue Share (%), by Application 2024 & 2032
- Figure 28: Asia Pacific Vte Prevention Garments Revenue (million), by Type 2024 & 2032
- Figure 29: Asia Pacific Vte Prevention Garments Revenue Share (%), by Type 2024 & 2032
- Figure 30: Asia Pacific Vte Prevention Garments Revenue (million), by Country 2024 & 2032
- Figure 31: Asia Pacific Vte Prevention Garments Revenue Share (%), by Country 2024 & 2032
List of Tables
- Table 1: Global Vte Prevention Garments Revenue million Forecast, by Region 2019 & 2032
- Table 2: Global Vte Prevention Garments Revenue million Forecast, by Application 2019 & 2032
- Table 3: Global Vte Prevention Garments Revenue million Forecast, by Type 2019 & 2032
- Table 4: Global Vte Prevention Garments Revenue million Forecast, by Region 2019 & 2032
- Table 5: Global Vte Prevention Garments Revenue million Forecast, by Application 2019 & 2032
- Table 6: Global Vte Prevention Garments Revenue million Forecast, by Type 2019 & 2032
- Table 7: Global Vte Prevention Garments Revenue million Forecast, by Country 2019 & 2032
- Table 8: United States Vte Prevention Garments Revenue (million) Forecast, by Application 2019 & 2032
- Table 9: Canada Vte Prevention Garments Revenue (million) Forecast, by Application 2019 & 2032
- Table 10: Mexico Vte Prevention Garments Revenue (million) Forecast, by Application 2019 & 2032
- Table 11: Global Vte Prevention Garments Revenue million Forecast, by Application 2019 & 2032
- Table 12: Global Vte Prevention Garments Revenue million Forecast, by Type 2019 & 2032
- Table 13: Global Vte Prevention Garments Revenue million Forecast, by Country 2019 & 2032
- Table 14: Brazil Vte Prevention Garments Revenue (million) Forecast, by Application 2019 & 2032
- Table 15: Argentina Vte Prevention Garments Revenue (million) Forecast, by Application 2019 & 2032
- Table 16: Rest of South America Vte Prevention Garments Revenue (million) Forecast, by Application 2019 & 2032
- Table 17: Global Vte Prevention Garments Revenue million Forecast, by Application 2019 & 2032
- Table 18: Global Vte Prevention Garments Revenue million Forecast, by Type 2019 & 2032
- Table 19: Global Vte Prevention Garments Revenue million Forecast, by Country 2019 & 2032
- Table 20: United Kingdom Vte Prevention Garments Revenue (million) Forecast, by Application 2019 & 2032
- Table 21: Germany Vte Prevention Garments Revenue (million) Forecast, by Application 2019 & 2032
- Table 22: France Vte Prevention Garments Revenue (million) Forecast, by Application 2019 & 2032
- Table 23: Italy Vte Prevention Garments Revenue (million) Forecast, by Application 2019 & 2032
- Table 24: Spain Vte Prevention Garments Revenue (million) Forecast, by Application 2019 & 2032
- Table 25: Russia Vte Prevention Garments Revenue (million) Forecast, by Application 2019 & 2032
- Table 26: Benelux Vte Prevention Garments Revenue (million) Forecast, by Application 2019 & 2032
- Table 27: Nordics Vte Prevention Garments Revenue (million) Forecast, by Application 2019 & 2032
- Table 28: Rest of Europe Vte Prevention Garments Revenue (million) Forecast, by Application 2019 & 2032
- Table 29: Global Vte Prevention Garments Revenue million Forecast, by Application 2019 & 2032
- Table 30: Global Vte Prevention Garments Revenue million Forecast, by Type 2019 & 2032
- Table 31: Global Vte Prevention Garments Revenue million Forecast, by Country 2019 & 2032
- Table 32: Turkey Vte Prevention Garments Revenue (million) Forecast, by Application 2019 & 2032
- Table 33: Israel Vte Prevention Garments Revenue (million) Forecast, by Application 2019 & 2032
- Table 34: GCC Vte Prevention Garments Revenue (million) Forecast, by Application 2019 & 2032
- Table 35: North Africa Vte Prevention Garments Revenue (million) Forecast, by Application 2019 & 2032
- Table 36: South Africa Vte Prevention Garments Revenue (million) Forecast, by Application 2019 & 2032
- Table 37: Rest of Middle East & Africa Vte Prevention Garments Revenue (million) Forecast, by Application 2019 & 2032
- Table 38: Global Vte Prevention Garments Revenue million Forecast, by Application 2019 & 2032
- Table 39: Global Vte Prevention Garments Revenue million Forecast, by Type 2019 & 2032
- Table 40: Global Vte Prevention Garments Revenue million Forecast, by Country 2019 & 2032
- Table 41: China Vte Prevention Garments Revenue (million) Forecast, by Application 2019 & 2032
- Table 42: India Vte Prevention Garments Revenue (million) Forecast, by Application 2019 & 2032
- Table 43: Japan Vte Prevention Garments Revenue (million) Forecast, by Application 2019 & 2032
- Table 44: South Korea Vte Prevention Garments Revenue (million) Forecast, by Application 2019 & 2032
- Table 45: ASEAN Vte Prevention Garments Revenue (million) Forecast, by Application 2019 & 2032
- Table 46: Oceania Vte Prevention Garments Revenue (million) Forecast, by Application 2019 & 2032
- Table 47: Rest of Asia Pacific Vte Prevention Garments Revenue (million) Forecast, by Application 2019 & 2032
Frequently Asked Questions
1. What is the projected Compound Annual Growth Rate (CAGR) of the Vte Prevention Garments?
The projected CAGR is approximately XXX%.
2. Which companies are prominent players in the Vte Prevention Garments?
Key companies in the market include Arjo, Encompass Group, Talley Group, MEGO AFEK, Zenith Technical Innovations, Normatec, Bio Compression Systems, ThermoTek USA.
3. What are the main segments of the Vte Prevention Garments?
The market segments include Application, Type.
4. Can you provide details about the market size?
The market size is estimated to be USD XXX million as of 2022.
5. What are some drivers contributing to market growth?
N/A
6. What are the notable trends driving market growth?
N/A
7. Are there any restraints impacting market growth?
N/A
8. Can you provide examples of recent developments in the market?
N/A
9. What pricing options are available for accessing the report?
Pricing options include single-user, multi-user, and enterprise licenses priced at USD 4250.00, USD 6375.00, and USD 8500.00 respectively.
10. Is the market size provided in terms of value or volume?
The market size is provided in terms of value, measured in million.
11. Are there any specific market keywords associated with the report?
Yes, the market keyword associated with the report is "Vte Prevention Garments," which aids in identifying and referencing the specific market segment covered.
12. How do I determine which pricing option suits my needs best?
The pricing options vary based on user requirements and access needs. Individual users may opt for single-user licenses, while businesses requiring broader access may choose multi-user or enterprise licenses for cost-effective access to the report.
13. Are there any additional resources or data provided in the Vte Prevention Garments report?
While the report offers comprehensive insights, it's advisable to review the specific contents or supplementary materials provided to ascertain if additional resources or data are available.
14. How can I stay updated on further developments or reports in the Vte Prevention Garments?
To stay informed about further developments, trends, and reports in the Vte Prevention Garments, consider subscribing to industry newsletters, following relevant companies and organizations, or regularly checking reputable industry news sources and publications.
Methodology
Step 1 - Identification of Relevant Samples Size from Population Database


Step 2 - Approaches for Defining Global Market Size (Value, Volume* & Price*)

Note*: In applicable scenarios
Step 3 - Data Sources
Primary Research
- Web Analytics
- Survey Reports
- Research Institute
- Latest Research Reports
- Opinion Leaders
Secondary Research
- Annual Reports
- White Paper
- Latest Press Release
- Industry Association
- Paid Database
- Investor Presentations

Step 4 - Data Triangulation
Involves using different sources of information in order to increase the validity of a study
These sources are likely to be stakeholders in a program - participants, other researchers, program staff, other community members, and so on.
Then we put all data in single framework & apply various statistical tools to find out the dynamic on the market.
During the analysis stage, feedback from the stakeholder groups would be compared to determine areas of agreement as well as areas of divergence


