

Key Insights
The global vodka market, valued at approximately $44.2 billion in 2025, is projected for significant expansion, forecasting a compound annual growth rate (CAGR) of 5.5% between 2025 and 2033. This robust growth is propelled by rising disposable incomes in emerging economies, increasing consumer expenditure on premium alcoholic beverages, and a growing preference for sophisticated cocktails. The surge in vodka-based ready-to-drink (RTD) cocktails and strategic marketing efforts by leading brands, focusing on innovation and brand image, are also key drivers. The market is segmented by distribution channels (on-trade, off-trade), type (flavored, non-flavored), and category (mass, premium, super-premium). Premium and super-premium segments are anticipated to outpace mass-market growth due to consumer willingness to invest in higher-quality products. North America and Europe currently dominate the market, with Asia presenting substantial future growth opportunities. Potential restraints include fluctuating economic conditions and alcohol consumption regulations.
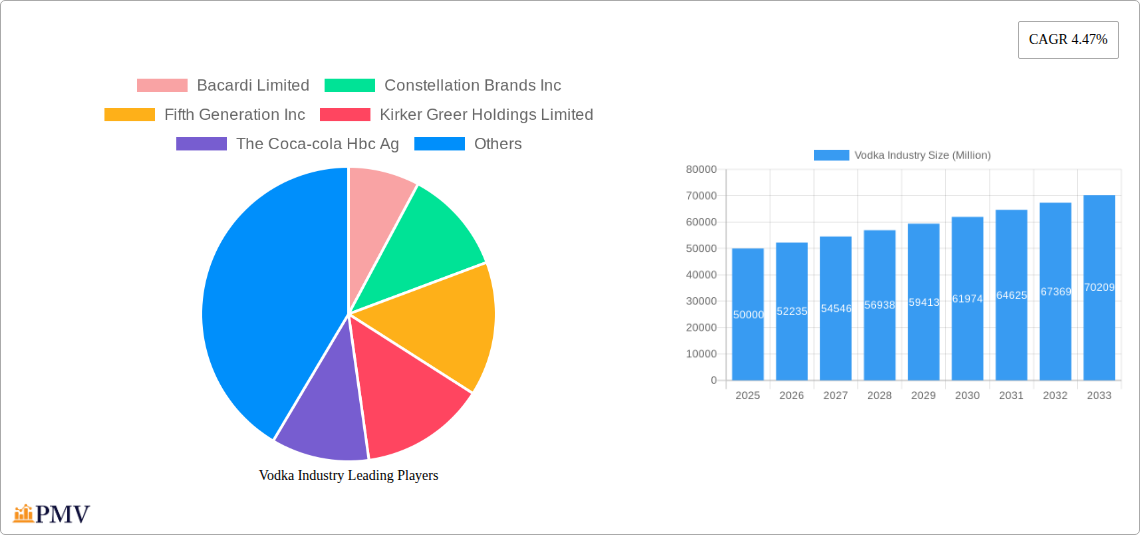
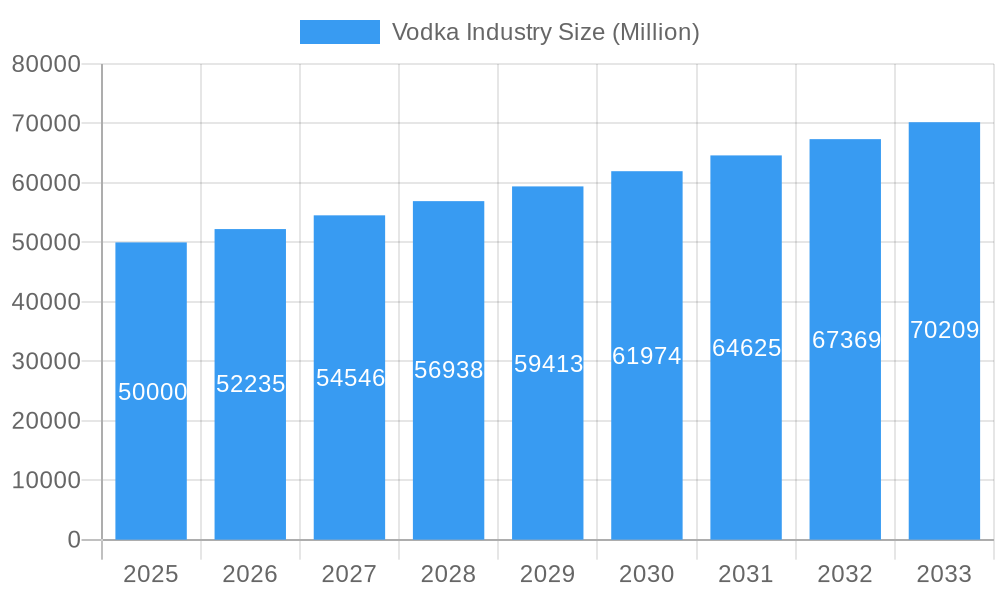
Vodka Industry Market Size (In Billion)
Continued market expansion is anticipated, fueled by innovative flavor introductions, the rise of craft vodka brands, and the growing e-commerce presence. Major industry players like Bacardi, Diageo, and Pernod Ricard are strategically investing in R&D, brand development, and acquisitions to secure market leadership. The competitive environment is dynamic, with established and emerging companies contending for market share. Future market trajectory will hinge on adapting to evolving consumer preferences, leveraging technological advancements, and embracing sustainable business practices.
Vodka Industry Company Market Share
Vodka Industry Market Report: 2019-2033
This comprehensive report provides an in-depth analysis of the global vodka industry, covering market size, segmentation, competitive landscape, and future growth prospects from 2019 to 2033. With a focus on key players like Bacardi Limited, Constellation Brands Inc., Diageo PLC, and Pernod Ricard, this report offers actionable insights for industry stakeholders. The report utilizes data from the historical period (2019-2024), the base year (2025), and projects growth through the forecast period (2025-2033). The global vodka market is estimated to be worth xx Million in 2025.
Vodka Industry Market Structure & Competitive Dynamics
The global vodka market exhibits a moderately concentrated structure, with a few major players holding significant market share. However, a dynamic competitive landscape exists, characterized by both intense rivalry among established brands and the emergence of new entrants, particularly in the flavored vodka segment. Innovation plays a crucial role, with companies continuously developing new flavors, packaging, and marketing strategies to attract consumers. Regulatory frameworks, varying across different countries, significantly impact market dynamics, particularly regarding alcohol content, labeling, and advertising. Product substitutes, such as gin, tequila, and whiskey, pose competitive threats, while shifts in consumer preferences, including growing health consciousness and demand for premium and craft vodkas, influence market trends. Mergers and acquisitions (M&A) activities have been significant, with deal values reaching xx Million in recent years, leading to consolidation and expansion of market share among key players.
- Market Concentration: High, with top 5 players holding approximately xx% market share in 2024.
- M&A Activity: Significant consolidation observed with deal values exceeding xx Million annually in the past 5 years. Examples include [Insert specific M&A examples with values, if available].
- Innovation Ecosystems: Highly dynamic, driven by new flavor profiles, premiumization, and sustainable packaging solutions.
- Regulatory Frameworks: Differ significantly across regions, impacting pricing, marketing, and product development.
Vodka Industry Industry Trends & Insights
The global vodka market is experiencing robust growth, driven primarily by increasing consumer disposable incomes, particularly in emerging markets. The Compound Annual Growth Rate (CAGR) from 2025 to 2033 is projected to be xx%, propelled by changing consumer preferences towards premium and super-premium vodka varieties. Technological advancements are reshaping the industry, with innovations in production, packaging, and distribution influencing market dynamics. E-commerce channels are witnessing substantial growth, impacting traditional distribution channels. Consumer preferences are shifting toward healthier options, with a rise in demand for low-calorie and organic vodka. The competitive landscape is increasingly dynamic, with both established and new players vying for market share through product innovation, strategic partnerships, and aggressive marketing campaigns. Market penetration of flavored vodkas is expected to reach xx% by 2033. Premiumization is another key trend, with consumers showing a preference for higher-priced, high-quality vodka.
Dominant Markets & Segments in Vodka Industry
The North American and European regions currently dominate the global vodka market, accounting for over xx% of the total revenue. Within these regions, specific countries like the USA and Russia hold significant market share. Market segmentation analysis reveals the following:
- By Distribution Channel:
- On-Trade: Bars, restaurants, and nightclubs remain significant channels but are impacted by changing consumer preferences and regulations.
- Off-Trade: Retail stores, supermarkets, and online platforms are experiencing substantial growth, driving market expansion.
- By Type:
- Flavored: Experiencing rapid growth due to consumer demand for diverse taste profiles.
- Non-Flavored: Remains a large segment, with established brands maintaining dominance.
- By Category:
- Mass: A price-sensitive market segment experiencing slower growth.
- Premium: Strong growth driven by increasing consumer disposable income and a preference for higher quality.
- Super-Premium: The fastest-growing segment, driven by discerning consumer demand for luxury products.
Key Drivers for Dominant Regions/Segments:
- Economic growth: Strong GDP growth in North America and Europe is a key driver.
- Consumer spending: Rising disposable incomes fuel demand for premium products.
- Tourism: High tourism in popular destinations drives on-trade sales.
Vodka Industry Product Innovations
Recent years have witnessed a surge in vodka product innovation, largely focused on new flavor profiles, premium packaging, and eco-friendly production methods. Flavored vodkas, infused with fruits, herbs, and spices, have gained immense popularity. The premium segment showcases innovative packaging designs and limited editions to cater to discerning consumers. The focus on sustainability is also evident in the adoption of eco-friendly packaging materials and responsible production processes. These innovations reflect the industry's response to shifting consumer preferences and competitive pressures.
Report Segmentation & Scope
This report segments the vodka market based on distribution channels (On-Trade, Off-Trade), product type (Flavored, Non-Flavored), and price category (Mass, Premium, Super-Premium). Each segment's growth projections are analyzed, considering market size, competitive intensity, and key drivers. The On-Trade segment is expected to witness a CAGR of xx% during the forecast period, while the Off-Trade segment is projected to grow at xx%. Flavored vodka is anticipated to achieve a higher growth rate than its non-flavored counterpart due to increased consumer interest in diverse flavor profiles. The Premium and Super-Premium segments are expected to outperform the Mass segment due to rising consumer demand for high-quality products. Competitive dynamics within each segment are analyzed, considering the presence of established players and emerging brands.
Key Drivers of Vodka Industry Growth
Several factors contribute to the growth of the vodka industry, including increasing consumer disposable income globally leading to higher spending on premium alcoholic beverages. The rising popularity of cocktails and mixed drinks, which frequently feature vodka, also boosts demand. Technological advancements in production and distribution enhance efficiency and scalability. Favorable regulatory environments in some key markets further promote growth. Finally, effective marketing and branding strategies by leading players successfully drive brand awareness and loyalty.
Challenges in the Vodka Industry Sector
The vodka industry faces challenges, including increasing health concerns about alcohol consumption, impacting consumer behavior and government regulations. Supply chain disruptions and fluctuating raw material costs can negatively affect profitability. Intense competition among existing players and the entry of new brands puts pressure on pricing and market share. Stringent regulatory environments in some regions impose limitations on marketing and distribution, affecting brand reach. These factors, when combined, result in decreased profitability and operational challenges for market participants.
Leading Players in the Vodka Industry Market
- Bacardi Limited
- Constellation Brands Inc
- Fifth Generation Inc
- Kirker Greer Holdings Limited
- The Coca-cola Hbc Ag
- Luctor International
- Pernod Ricard
- LVMH Moet Hennessy Louis Vuitton (Belvedere Vodka)
- Becle SAB de CV
- Diageo PLC
Key Developments in Vodka Industry Sector
- February 2023: Diageo launched the Cherry Drop Smirnoff variety, a new flavored vodka with 37.5% ABV, expanding its product portfolio and targeting the flavored vodka segment.
- September 2022: Brown-Forman Corporation announced plans to distribute its brands, including Finlandia Vodka, in Slovakia from September 2023, aiming to expand its market reach in Europe.
- August 2022: Constellation Brands launched 'Fresca Mixed,' a new line of premium, pre-mixed cocktails including Vodka Spritz, expanding into the ready-to-drink (RTD) market.
Strategic Vodka Industry Market Outlook
The future of the vodka industry appears promising, fueled by the continued growth of the premium and super-premium segments. Strategic opportunities lie in expanding into emerging markets, focusing on product innovation to meet evolving consumer preferences (e.g., health-conscious options), and leveraging digital marketing channels to enhance brand awareness. Companies that successfully adapt to changing consumer trends and invest in sustainable practices are expected to achieve strong growth in the coming years. The RTD (Ready-to-Drink) segment presents a significant growth avenue.
Vodka Industry Segmentation
-
1. Type
- 1.1. Flavored
- 1.2. Non-Flavored
-
2. Category
- 2.1. Mass
- 2.2. Premium
- 2.3. Super-Premium
-
3. Distribution Channel
- 3.1. On-Trade
-
3.2. Off-Trade
- 3.2.1. Supermarkets/Hypermarkets
- 3.2.2. Specialty Stores
- 3.2.3. Online Retailers
- 3.2.4. Other Distribution Channels
Vodka Industry Segmentation By Geography
-
1. North America
- 1.1. United States
- 1.2. Canada
- 1.3. Mexico
- 1.4. Rest of North America
-
2. Europe
- 2.1. Spain
- 2.2. United Kingdom
- 2.3. Germany
- 2.4. France
- 2.5. Italy
- 2.6. Russia
- 2.7. Rest of Europe
-
3. Asia Pacific
- 3.1. China
- 3.2. Japan
- 3.3. India
- 3.4. Australia
- 3.5. Taiwan
- 3.6. Singapore
- 3.7. South Korea
- 3.8. Rest of Asia Pacific
-
4. South America
- 4.1. Brazil
- 4.2. Argentina
- 4.3. Rest of South America
-
5. Middle East and Africa
- 5.1. United Arab Emirates
- 5.2. South Africa
- 5.3. Rest of Middle East and Africa
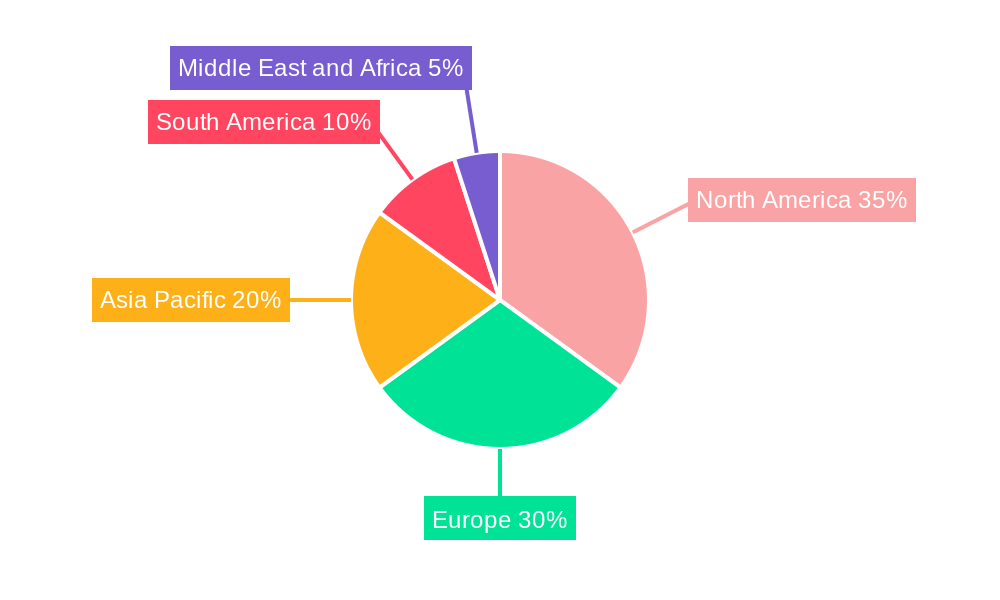
Vodka Industry Regional Market Share
Geographic Coverage of Vodka Industry
Vodka Industry REPORT HIGHLIGHTS
| Aspects | Details |
|---|---|
| Study Period | 2020-2034 |
| Base Year | 2025 |
| Estimated Year | 2026 |
| Forecast Period | 2026-2034 |
| Historical Period | 2020-2025 |
| Growth Rate | CAGR of 5.5% from 2020-2034 |
| Segmentation |
|
Table of Contents
- 1. Introduction
- 1.1. Research Scope
- 1.2. Market Segmentation
- 1.3. Research Objective
- 1.4. Definitions and Assumptions
- 2. Executive Summary
- 2.1. Market Snapshot
- 3. Market Dynamics
- 3.1. Market Drivers
- 3.2. Market Restrains
- 3.3. Market Trends
- 3.4. Market Opportunities
- 4. Market Factor Analysis
- 4.1. Porters Five Forces
- 4.1.1. Bargaining Power of Suppliers
- 4.1.2. Bargaining Power of Buyers
- 4.1.3. Threat of New Entrants
- 4.1.4. Threat of Substitutes
- 4.1.5. Competitive Rivalry
- 4.2. PESTEL analysis
- 4.3. BCG Analysis
- 4.3.1. Stars (High Growth, High Market Share)
- 4.3.2. Cash Cows (Low Growth, High Market Share)
- 4.3.3. Question Mark (High Growth, Low Market Share)
- 4.3.4. Dogs (Low Growth, Low Market Share)
- 4.4. Ansoff Matrix Analysis
- 4.5. Supply Chain Analysis
- 4.6. Regulatory Landscape
- 4.7. Current Market Potential and Opportunity Assessment (TAM–SAM–SOM Framework)
- 4.8. PMV Analyst Note
- 4.1. Porters Five Forces
- 5. Market Analysis, Insights and Forecast 2021-2033
- 5.1. Market Analysis, Insights and Forecast - by Type
- 5.1.1. Flavored
- 5.1.2. Non-Flavored
- 5.2. Market Analysis, Insights and Forecast - by Category
- 5.2.1. Mass
- 5.2.2. Premium
- 5.2.3. Super-Premium
- 5.3. Market Analysis, Insights and Forecast - by Distribution Channel
- 5.3.1. On-Trade
- 5.3.2. Off-Trade
- 5.3.2.1. Supermarkets/Hypermarkets
- 5.3.2.2. Specialty Stores
- 5.3.2.3. Online Retailers
- 5.3.2.4. Other Distribution Channels
- 5.4. Market Analysis, Insights and Forecast - by Region
- 5.4.1. North America
- 5.4.2. Europe
- 5.4.3. Asia Pacific
- 5.4.4. South America
- 5.4.5. Middle East and Africa
- 5.1. Market Analysis, Insights and Forecast - by Type
- 6. Global Vodka Industry Analysis, Insights and Forecast, 2021-2033
- 6.1. Market Analysis, Insights and Forecast - by Type
- 6.1.1. Flavored
- 6.1.2. Non-Flavored
- 6.2. Market Analysis, Insights and Forecast - by Category
- 6.2.1. Mass
- 6.2.2. Premium
- 6.2.3. Super-Premium
- 6.3. Market Analysis, Insights and Forecast - by Distribution Channel
- 6.3.1. On-Trade
- 6.3.2. Off-Trade
- 6.3.2.1. Supermarkets/Hypermarkets
- 6.3.2.2. Specialty Stores
- 6.3.2.3. Online Retailers
- 6.3.2.4. Other Distribution Channels
- 6.1. Market Analysis, Insights and Forecast - by Type
- 7. North America Vodka Industry Analysis, Insights and Forecast, 2020-2032
- 7.1. Market Analysis, Insights and Forecast - by Type
- 7.1.1. Flavored
- 7.1.2. Non-Flavored
- 7.2. Market Analysis, Insights and Forecast - by Category
- 7.2.1. Mass
- 7.2.2. Premium
- 7.2.3. Super-Premium
- 7.3. Market Analysis, Insights and Forecast - by Distribution Channel
- 7.3.1. On-Trade
- 7.3.2. Off-Trade
- 7.3.2.1. Supermarkets/Hypermarkets
- 7.3.2.2. Specialty Stores
- 7.3.2.3. Online Retailers
- 7.3.2.4. Other Distribution Channels
- 7.1. Market Analysis, Insights and Forecast - by Type
- 8. Europe Vodka Industry Analysis, Insights and Forecast, 2020-2032
- 8.1. Market Analysis, Insights and Forecast - by Type
- 8.1.1. Flavored
- 8.1.2. Non-Flavored
- 8.2. Market Analysis, Insights and Forecast - by Category
- 8.2.1. Mass
- 8.2.2. Premium
- 8.2.3. Super-Premium
- 8.3. Market Analysis, Insights and Forecast - by Distribution Channel
- 8.3.1. On-Trade
- 8.3.2. Off-Trade
- 8.3.2.1. Supermarkets/Hypermarkets
- 8.3.2.2. Specialty Stores
- 8.3.2.3. Online Retailers
- 8.3.2.4. Other Distribution Channels
- 8.1. Market Analysis, Insights and Forecast - by Type
- 9. Asia Pacific Vodka Industry Analysis, Insights and Forecast, 2020-2032
- 9.1. Market Analysis, Insights and Forecast - by Type
- 9.1.1. Flavored
- 9.1.2. Non-Flavored
- 9.2. Market Analysis, Insights and Forecast - by Category
- 9.2.1. Mass
- 9.2.2. Premium
- 9.2.3. Super-Premium
- 9.3. Market Analysis, Insights and Forecast - by Distribution Channel
- 9.3.1. On-Trade
- 9.3.2. Off-Trade
- 9.3.2.1. Supermarkets/Hypermarkets
- 9.3.2.2. Specialty Stores
- 9.3.2.3. Online Retailers
- 9.3.2.4. Other Distribution Channels
- 9.1. Market Analysis, Insights and Forecast - by Type
- 10. South America Vodka Industry Analysis, Insights and Forecast, 2020-2032
- 10.1. Market Analysis, Insights and Forecast - by Type
- 10.1.1. Flavored
- 10.1.2. Non-Flavored
- 10.2. Market Analysis, Insights and Forecast - by Category
- 10.2.1. Mass
- 10.2.2. Premium
- 10.2.3. Super-Premium
- 10.3. Market Analysis, Insights and Forecast - by Distribution Channel
- 10.3.1. On-Trade
- 10.3.2. Off-Trade
- 10.3.2.1. Supermarkets/Hypermarkets
- 10.3.2.2. Specialty Stores
- 10.3.2.3. Online Retailers
- 10.3.2.4. Other Distribution Channels
- 10.1. Market Analysis, Insights and Forecast - by Type
- 11. Middle East and Africa Vodka Industry Analysis, Insights and Forecast, 2020-2032
- 11.1. Market Analysis, Insights and Forecast - by Type
- 11.1.1. Flavored
- 11.1.2. Non-Flavored
- 11.2. Market Analysis, Insights and Forecast - by Category
- 11.2.1. Mass
- 11.2.2. Premium
- 11.2.3. Super-Premium
- 11.3. Market Analysis, Insights and Forecast - by Distribution Channel
- 11.3.1. On-Trade
- 11.3.2. Off-Trade
- 11.3.2.1. Supermarkets/Hypermarkets
- 11.3.2.2. Specialty Stores
- 11.3.2.3. Online Retailers
- 11.3.2.4. Other Distribution Channels
- 11.1. Market Analysis, Insights and Forecast - by Type
- 12. Competitive Analysis
- 12.1. Company Profiles
- 12.1.1 Bacardi Limited
- 12.1.1.1. Company Overview
- 12.1.1.2. Products
- 12.1.1.3. Company Financials
- 12.1.1.4. SWOT Analysis
- 12.1.2 Constellation Brands Inc
- 12.1.2.1. Company Overview
- 12.1.2.2. Products
- 12.1.2.3. Company Financials
- 12.1.2.4. SWOT Analysis
- 12.1.3 Fifth Generation Inc
- 12.1.3.1. Company Overview
- 12.1.3.2. Products
- 12.1.3.3. Company Financials
- 12.1.3.4. SWOT Analysis
- 12.1.4 Kirker Greer Holdings Limited
- 12.1.4.1. Company Overview
- 12.1.4.2. Products
- 12.1.4.3. Company Financials
- 12.1.4.4. SWOT Analysis
- 12.1.5 The Coca-cola Hbc Ag
- 12.1.5.1. Company Overview
- 12.1.5.2. Products
- 12.1.5.3. Company Financials
- 12.1.5.4. SWOT Analysis
- 12.1.6 Luctor International*List Not Exhaustive
- 12.1.6.1. Company Overview
- 12.1.6.2. Products
- 12.1.6.3. Company Financials
- 12.1.6.4. SWOT Analysis
- 12.1.7 Pernod Ricard
- 12.1.7.1. Company Overview
- 12.1.7.2. Products
- 12.1.7.3. Company Financials
- 12.1.7.4. SWOT Analysis
- 12.1.8 LVMH Moet Hennessy Louis Vuitton (Belvedere Vodka
- 12.1.8.1. Company Overview
- 12.1.8.2. Products
- 12.1.8.3. Company Financials
- 12.1.8.4. SWOT Analysis
- 12.1.9 Becle SAB de
- 12.1.9.1. Company Overview
- 12.1.9.2. Products
- 12.1.9.3. Company Financials
- 12.1.9.4. SWOT Analysis
- 12.1.10 Diageo PLC
- 12.1.10.1. Company Overview
- 12.1.10.2. Products
- 12.1.10.3. Company Financials
- 12.1.10.4. SWOT Analysis
- 12.1.1 Bacardi Limited
- 12.2. Market Entropy
- 12.2.1 Company's Key Areas Served
- 12.2.2 Recent Developments
- 12.3. Company Market Share Analysis 2025
- 12.3.1 Top 5 Companies Market Share Analysis
- 12.3.2 Top 3 Companies Market Share Analysis
- 12.4. List of Potential Customers
- 13. Research Methodology
List of Figures
- Figure 1: Global Vodka Industry Revenue Breakdown (billion, %) by Region 2025 & 2033
- Figure 2: North America Vodka Industry Revenue (billion), by Type 2025 & 2033
- Figure 3: North America Vodka Industry Revenue Share (%), by Type 2025 & 2033
- Figure 4: North America Vodka Industry Revenue (billion), by Category 2025 & 2033
- Figure 5: North America Vodka Industry Revenue Share (%), by Category 2025 & 2033
- Figure 6: North America Vodka Industry Revenue (billion), by Distribution Channel 2025 & 2033
- Figure 7: North America Vodka Industry Revenue Share (%), by Distribution Channel 2025 & 2033
- Figure 8: North America Vodka Industry Revenue (billion), by Country 2025 & 2033
- Figure 9: North America Vodka Industry Revenue Share (%), by Country 2025 & 2033
- Figure 10: Europe Vodka Industry Revenue (billion), by Type 2025 & 2033
- Figure 11: Europe Vodka Industry Revenue Share (%), by Type 2025 & 2033
- Figure 12: Europe Vodka Industry Revenue (billion), by Category 2025 & 2033
- Figure 13: Europe Vodka Industry Revenue Share (%), by Category 2025 & 2033
- Figure 14: Europe Vodka Industry Revenue (billion), by Distribution Channel 2025 & 2033
- Figure 15: Europe Vodka Industry Revenue Share (%), by Distribution Channel 2025 & 2033
- Figure 16: Europe Vodka Industry Revenue (billion), by Country 2025 & 2033
- Figure 17: Europe Vodka Industry Revenue Share (%), by Country 2025 & 2033
- Figure 18: Asia Pacific Vodka Industry Revenue (billion), by Type 2025 & 2033
- Figure 19: Asia Pacific Vodka Industry Revenue Share (%), by Type 2025 & 2033
- Figure 20: Asia Pacific Vodka Industry Revenue (billion), by Category 2025 & 2033
- Figure 21: Asia Pacific Vodka Industry Revenue Share (%), by Category 2025 & 2033
- Figure 22: Asia Pacific Vodka Industry Revenue (billion), by Distribution Channel 2025 & 2033
- Figure 23: Asia Pacific Vodka Industry Revenue Share (%), by Distribution Channel 2025 & 2033
- Figure 24: Asia Pacific Vodka Industry Revenue (billion), by Country 2025 & 2033
- Figure 25: Asia Pacific Vodka Industry Revenue Share (%), by Country 2025 & 2033
- Figure 26: South America Vodka Industry Revenue (billion), by Type 2025 & 2033
- Figure 27: South America Vodka Industry Revenue Share (%), by Type 2025 & 2033
- Figure 28: South America Vodka Industry Revenue (billion), by Category 2025 & 2033
- Figure 29: South America Vodka Industry Revenue Share (%), by Category 2025 & 2033
- Figure 30: South America Vodka Industry Revenue (billion), by Distribution Channel 2025 & 2033
- Figure 31: South America Vodka Industry Revenue Share (%), by Distribution Channel 2025 & 2033
- Figure 32: South America Vodka Industry Revenue (billion), by Country 2025 & 2033
- Figure 33: South America Vodka Industry Revenue Share (%), by Country 2025 & 2033
- Figure 34: Middle East and Africa Vodka Industry Revenue (billion), by Type 2025 & 2033
- Figure 35: Middle East and Africa Vodka Industry Revenue Share (%), by Type 2025 & 2033
- Figure 36: Middle East and Africa Vodka Industry Revenue (billion), by Category 2025 & 2033
- Figure 37: Middle East and Africa Vodka Industry Revenue Share (%), by Category 2025 & 2033
- Figure 38: Middle East and Africa Vodka Industry Revenue (billion), by Distribution Channel 2025 & 2033
- Figure 39: Middle East and Africa Vodka Industry Revenue Share (%), by Distribution Channel 2025 & 2033
- Figure 40: Middle East and Africa Vodka Industry Revenue (billion), by Country 2025 & 2033
- Figure 41: Middle East and Africa Vodka Industry Revenue Share (%), by Country 2025 & 2033
List of Tables
- Table 1: Global Vodka Industry Revenue billion Forecast, by Type 2020 & 2033
- Table 2: Global Vodka Industry Revenue billion Forecast, by Category 2020 & 2033
- Table 3: Global Vodka Industry Revenue billion Forecast, by Distribution Channel 2020 & 2033
- Table 4: Global Vodka Industry Revenue billion Forecast, by Region 2020 & 2033
- Table 5: Global Vodka Industry Revenue billion Forecast, by Type 2020 & 2033
- Table 6: Global Vodka Industry Revenue billion Forecast, by Category 2020 & 2033
- Table 7: Global Vodka Industry Revenue billion Forecast, by Distribution Channel 2020 & 2033
- Table 8: Global Vodka Industry Revenue billion Forecast, by Country 2020 & 2033
- Table 9: United States Vodka Industry Revenue (billion) Forecast, by Application 2020 & 2033
- Table 10: Canada Vodka Industry Revenue (billion) Forecast, by Application 2020 & 2033
- Table 11: Mexico Vodka Industry Revenue (billion) Forecast, by Application 2020 & 2033
- Table 12: Rest of North America Vodka Industry Revenue (billion) Forecast, by Application 2020 & 2033
- Table 13: Global Vodka Industry Revenue billion Forecast, by Type 2020 & 2033
- Table 14: Global Vodka Industry Revenue billion Forecast, by Category 2020 & 2033
- Table 15: Global Vodka Industry Revenue billion Forecast, by Distribution Channel 2020 & 2033
- Table 16: Global Vodka Industry Revenue billion Forecast, by Country 2020 & 2033
- Table 17: Spain Vodka Industry Revenue (billion) Forecast, by Application 2020 & 2033
- Table 18: United Kingdom Vodka Industry Revenue (billion) Forecast, by Application 2020 & 2033
- Table 19: Germany Vodka Industry Revenue (billion) Forecast, by Application 2020 & 2033
- Table 20: France Vodka Industry Revenue (billion) Forecast, by Application 2020 & 2033
- Table 21: Italy Vodka Industry Revenue (billion) Forecast, by Application 2020 & 2033
- Table 22: Russia Vodka Industry Revenue (billion) Forecast, by Application 2020 & 2033
- Table 23: Rest of Europe Vodka Industry Revenue (billion) Forecast, by Application 2020 & 2033
- Table 24: Global Vodka Industry Revenue billion Forecast, by Type 2020 & 2033
- Table 25: Global Vodka Industry Revenue billion Forecast, by Category 2020 & 2033
- Table 26: Global Vodka Industry Revenue billion Forecast, by Distribution Channel 2020 & 2033
- Table 27: Global Vodka Industry Revenue billion Forecast, by Country 2020 & 2033
- Table 28: China Vodka Industry Revenue (billion) Forecast, by Application 2020 & 2033
- Table 29: Japan Vodka Industry Revenue (billion) Forecast, by Application 2020 & 2033
- Table 30: India Vodka Industry Revenue (billion) Forecast, by Application 2020 & 2033
- Table 31: Australia Vodka Industry Revenue (billion) Forecast, by Application 2020 & 2033
- Table 32: Taiwan Vodka Industry Revenue (billion) Forecast, by Application 2020 & 2033
- Table 33: Singapore Vodka Industry Revenue (billion) Forecast, by Application 2020 & 2033
- Table 34: South Korea Vodka Industry Revenue (billion) Forecast, by Application 2020 & 2033
- Table 35: Rest of Asia Pacific Vodka Industry Revenue (billion) Forecast, by Application 2020 & 2033
- Table 36: Global Vodka Industry Revenue billion Forecast, by Type 2020 & 2033
- Table 37: Global Vodka Industry Revenue billion Forecast, by Category 2020 & 2033
- Table 38: Global Vodka Industry Revenue billion Forecast, by Distribution Channel 2020 & 2033
- Table 39: Global Vodka Industry Revenue billion Forecast, by Country 2020 & 2033
- Table 40: Brazil Vodka Industry Revenue (billion) Forecast, by Application 2020 & 2033
- Table 41: Argentina Vodka Industry Revenue (billion) Forecast, by Application 2020 & 2033
- Table 42: Rest of South America Vodka Industry Revenue (billion) Forecast, by Application 2020 & 2033
- Table 43: Global Vodka Industry Revenue billion Forecast, by Type 2020 & 2033
- Table 44: Global Vodka Industry Revenue billion Forecast, by Category 2020 & 2033
- Table 45: Global Vodka Industry Revenue billion Forecast, by Distribution Channel 2020 & 2033
- Table 46: Global Vodka Industry Revenue billion Forecast, by Country 2020 & 2033
- Table 47: United Arab Emirates Vodka Industry Revenue (billion) Forecast, by Application 2020 & 2033
- Table 48: South Africa Vodka Industry Revenue (billion) Forecast, by Application 2020 & 2033
- Table 49: Rest of Middle East and Africa Vodka Industry Revenue (billion) Forecast, by Application 2020 & 2033
Frequently Asked Questions
1. What is the projected Compound Annual Growth Rate (CAGR) of the Vodka Industry?
The projected CAGR is approximately 5.5%.
2. Which companies are prominent players in the Vodka Industry?
Key companies in the market include Bacardi Limited, Constellation Brands Inc, Fifth Generation Inc, Kirker Greer Holdings Limited, The Coca-cola Hbc Ag, Luctor International*List Not Exhaustive, Pernod Ricard, LVMH Moet Hennessy Louis Vuitton (Belvedere Vodka, Becle SAB de, Diageo PLC.
3. What are the main segments of the Vodka Industry?
The market segments include Type, Category, Distribution Channel.
4. Can you provide details about the market size?
The market size is estimated to be USD 44.2 billion as of 2022.
5. What are some drivers contributing to market growth?
Demand for Premium and Super Premium Vodka; Effective Branding and Marketing by Players.
6. What are the notable trends driving market growth?
Premiumization of Vodka.
7. Are there any restraints impacting market growth?
Stringent Regulations Pertaining to Vodka; Popularity of Non-alcoholic Beverages.
8. Can you provide examples of recent developments in the market?
February 2023: Diageo expanded its portfolio by launching a new product, the Cherry Drop Smirnoff variety, consisting of a unique flavor with 37.5% ABV.
9. What pricing options are available for accessing the report?
Pricing options include single-user, multi-user, and enterprise licenses priced at USD 4750, USD 5250, and USD 8750 respectively.
10. Is the market size provided in terms of value or volume?
The market size is provided in terms of value, measured in billion.
11. Are there any specific market keywords associated with the report?
Yes, the market keyword associated with the report is "Vodka Industry," which aids in identifying and referencing the specific market segment covered.
12. How do I determine which pricing option suits my needs best?
The pricing options vary based on user requirements and access needs. Individual users may opt for single-user licenses, while businesses requiring broader access may choose multi-user or enterprise licenses for cost-effective access to the report.
13. Are there any additional resources or data provided in the Vodka Industry report?
While the report offers comprehensive insights, it's advisable to review the specific contents or supplementary materials provided to ascertain if additional resources or data are available.
14. How can I stay updated on further developments or reports in the Vodka Industry?
To stay informed about further developments, trends, and reports in the Vodka Industry, consider subscribing to industry newsletters, following relevant companies and organizations, or regularly checking reputable industry news sources and publications.
Methodology
Step 1 - Identification of Relevant Samples Size from Population Database


Step 2 - Approaches for Defining Global Market Size (Value, Volume* & Price*)

Note*: In applicable scenarios
Step 3 - Data Sources
Primary Research
- Web Analytics
- Survey Reports
- Research Institute
- Latest Research Reports
- Opinion Leaders
Secondary Research
- Annual Reports
- White Paper
- Latest Press Release
- Industry Association
- Paid Database
- Investor Presentations

Step 4 - Data Triangulation
Involves using different sources of information in order to increase the validity of a study
These sources are likely to be stakeholders in a program - participants, other researchers, program staff, other community members, and so on.
Then we put all data in single framework & apply various statistical tools to find out the dynamic on the market.
During the analysis stage, feedback from the stakeholder groups would be compared to determine areas of agreement as well as areas of divergence