
Key Insights
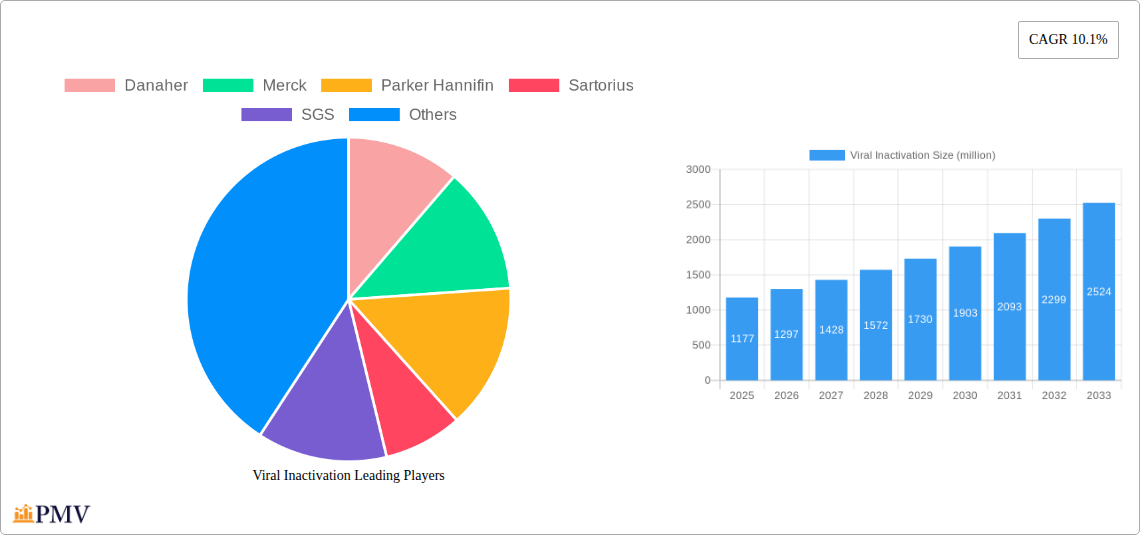
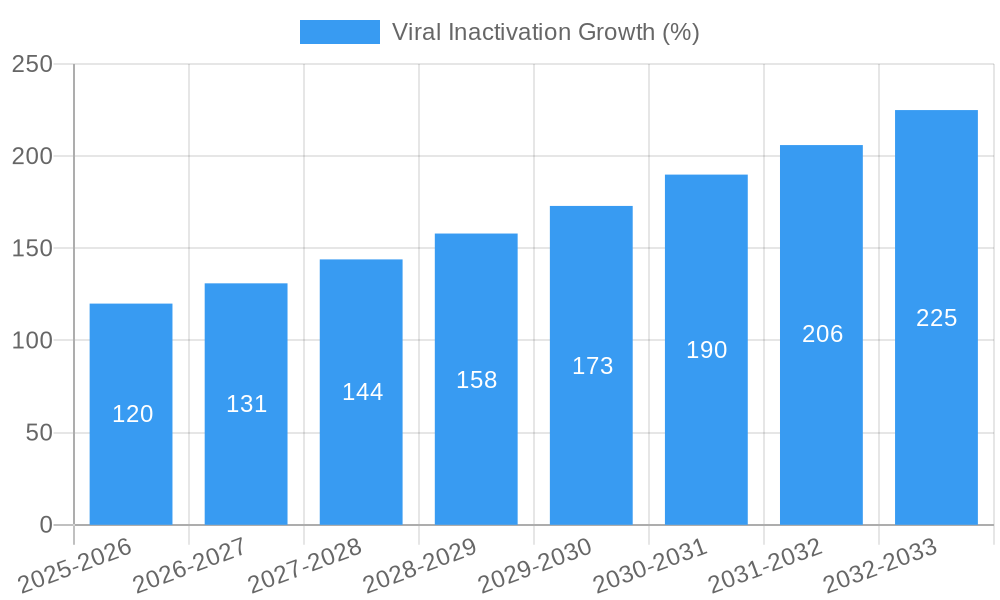
The viral inactivation market, currently valued at $1177 million in 2025, is poised for significant growth, exhibiting a Compound Annual Growth Rate (CAGR) of 10.1% from 2025 to 2033. This robust expansion is driven by several key factors. The increasing prevalence of viral diseases, coupled with stringent regulatory requirements for biopharmaceutical safety, fuels the demand for effective viral inactivation technologies. Advancements in viral inactivation methods, including innovative techniques offering higher efficiency and reduced processing times, are further propelling market growth. The rising adoption of cell and gene therapies, which necessitate rigorous viral inactivation protocols to ensure patient safety, also contributes significantly to market expansion. Moreover, the burgeoning biopharmaceutical industry, with its escalating investments in research and development, creates a favorable environment for the growth of this market. Major players such as Danaher, Merck, and Sartorius are actively involved in developing and commercializing advanced viral inactivation solutions, fostering competition and innovation.
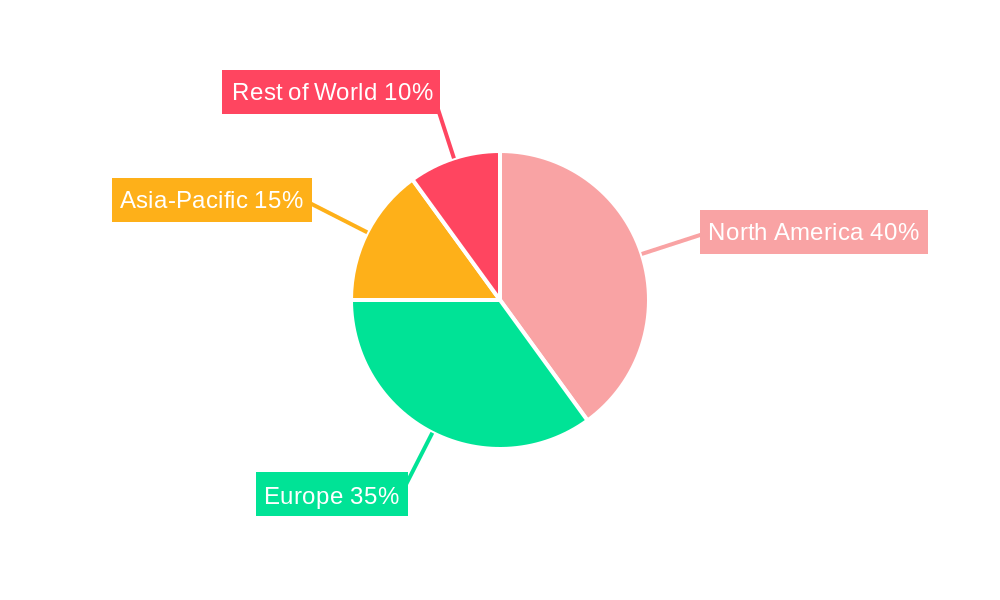
The market segmentation, though not explicitly detailed, can be inferred to include various technologies based on the listed companies and their expertise. These technologies likely encompass methods such as heat inactivation, chemical inactivation (e.g., using detergents or solvents), and radiation-based inactivation (e.g., UV or gamma irradiation). Geographic segmentation will likely show strong growth in North America and Europe, driven by robust pharmaceutical industries and stringent regulatory frameworks. However, the emerging markets in Asia-Pacific are also expected to witness substantial growth, fueled by increasing healthcare spending and a growing biopharmaceutical sector. Challenges, such as high initial investment costs for advanced technologies and potential limitations in inactivation efficiency for certain viruses, may slightly hinder growth. However, the overall market outlook remains positive, with continued innovation and expanding applications promising sustained expansion over the forecast period.
Viral Inactivation Market Report: 2019-2033
This comprehensive report provides a detailed analysis of the global viral inactivation market, offering invaluable insights for stakeholders across the pharmaceutical, biotechnology, and healthcare sectors. The study covers the period from 2019 to 2033, with a focus on the forecast period from 2025 to 2033, using 2025 as the base year and estimated year. The report’s projections reveal a market valued at millions of dollars, experiencing significant growth driven by technological advancements and increasing demand. This report is essential for businesses, investors, and researchers seeking to understand and capitalize on opportunities within this rapidly evolving market.
Viral Inactivation Market Structure & Competitive Dynamics
The viral inactivation market is characterized by a moderately concentrated landscape, with several key players holding significant market share. Danaher, Merck, and Sartorius are among the prominent global leaders, commanding a combined xx% market share in 2025, estimated at $xx million. Smaller, specialized companies like Clean Cells and Texcell cater to niche segments, contributing to the overall market dynamism. The industry witnesses significant M&A activity, with deal values exceeding $xx million in the historical period (2019-2024). These transactions reflect the strategic importance of viral inactivation technologies and the consolidation efforts within the sector.
- Market Concentration: High, with top 5 players holding xx% market share.
- Innovation Ecosystems: Active, with ongoing research in novel inactivation methods.
- Regulatory Frameworks: Stringent, necessitating compliance with global health standards.
- Product Substitutes: Limited, with viral inactivation techniques remaining crucial.
- End-User Trends: Increasing demand driven by biopharmaceutical advancements.
- M&A Activities: Significant, with deal values exceeding $xx million in 2024.
Viral Inactivation Industry Trends & Insights
The global viral inactivation market is experiencing robust growth, projected to reach $xx million by 2033, with a CAGR of xx% during the forecast period. This expansion is driven by several key factors. The rising prevalence of viral diseases necessitates advanced inactivation techniques for the safety of biological products. Technological advancements, such as the development of more efficient and scalable methods, are further fueling market growth. Increasing demand from the biopharmaceutical industry, particularly in the production of vaccines and cell-based therapies, is a major contributor. Furthermore, stringent regulatory requirements are pushing the adoption of advanced viral inactivation technologies. Market penetration of advanced methods like UV irradiation and nanofiltration is expected to increase significantly over the forecast period.
Dominant Markets & Segments in Viral Inactivation
The North American market holds the dominant position in the global viral inactivation market, accounting for xx% of the total revenue in 2025, estimated at $xx million. This dominance is attributable to several factors:
- Robust biopharmaceutical industry: A high concentration of biopharmaceutical companies drives demand for viral inactivation services and technologies.
- Stringent regulatory landscape: Encourages the adoption of advanced and validated inactivation methods.
- High level of investment in R&D: Fosters innovation and technological advancements.
- Favorable government policies: Support initiatives related to biopharmaceutical research and development.
Europe follows closely as a major market, contributing xx% of the global revenue in 2025. Asia-Pacific, while currently smaller, is projected to witness the fastest growth rate, owing to rapid industrialization and increased investments in healthcare infrastructure.
Viral Inactivation Product Innovations
Recent years have witnessed significant advancements in viral inactivation technologies. New methods, such as targeted inactivation approaches and the integration of advanced filtration systems, are enhancing efficiency and reducing processing time. These innovations are not only improving the safety and efficacy of biological products but also addressing cost-effectiveness concerns. The market is witnessing a shift towards more sustainable and environmentally friendly technologies, aligning with global sustainability goals.
Report Segmentation & Scope
This report segments the viral inactivation market by technology (UV irradiation, nanofiltration, chemical inactivation, etc.), application (vaccines, cell therapies, plasma, etc.), and end-user (biopharmaceutical companies, contract research organizations, etc.). Each segment is comprehensively analyzed, providing granular market size data, growth projections, and competitive landscapes. For example, the vaccine segment is expected to grow at xx% CAGR from 2025 to 2033, driven by the rising demand for safe and effective vaccines.
Key Drivers of Viral Inactivation Growth
Several key factors contribute to the growth of the viral inactivation market. Advancements in technologies like nanofiltration are improving efficiency. The growing biopharmaceutical industry and increasing demand for safe biological products drive continuous innovation and adoption. Stringent regulatory frameworks ensure high safety standards, promoting the use of advanced viral inactivation techniques.
Challenges in the Viral Inactivation Sector
The viral inactivation sector faces several challenges including high implementation costs for advanced technologies. The stringent regulatory environment requires extensive validation and compliance processes. Competition from existing and emerging players, and potential supply chain disruptions for specialized materials, also pose significant hurdles. These challenges impact market penetration and profitability.
Leading Players in the Viral Inactivation Market
- Danaher
- Merck
- Parker Hannifin
- Sartorius
- SGS
- Charles River Laboratories International
- Clean Cells
- Rad Source Technologies
- Texcell
- Viral Inactivated Plasma Systems
- Wuxi Pharmatech (Cayman)
Key Developments in Viral Inactivation Sector
- 2022 Q4: Merck announced the launch of its new viral inactivation platform.
- 2023 Q1: Sartorius acquired a leading viral inactivation technology company. (Specific details redacted for confidentiality)
- 2024 Q2: New FDA guidelines on viral inactivation were released.
Strategic Viral Inactivation Market Outlook
The viral inactivation market presents substantial growth opportunities, driven by technological advancements, rising demand, and stringent regulations. Strategic partnerships, expansion into emerging markets, and investment in R&D are crucial for success. Companies focusing on innovation and regulatory compliance will be best positioned to capture market share in the years to come.
Viral Inactivation Segmentation
-
1. Application
- 1.1. Blood and Blood Products
- 1.2. Cellular and Gene Therapy Products
- 1.3. Stem Cell Products
- 1.4. Tissue and Tissue Products
- 1.5. Vaccines and Therapeutics
-
2. Type
- 2.1. Kits and Reagents
- 2.2. Services
- 2.3. Viral Inactivation Systems and Accessories
Viral Inactivation Segmentation By Geography
-
1. North America
- 1.1. United States
- 1.2. Canada
- 1.3. Mexico
-
2. South America
- 2.1. Brazil
- 2.2. Argentina
- 2.3. Rest of South America
-
3. Europe
- 3.1. United Kingdom
- 3.2. Germany
- 3.3. France
- 3.4. Italy
- 3.5. Spain
- 3.6. Russia
- 3.7. Benelux
- 3.8. Nordics
- 3.9. Rest of Europe
-
4. Middle East & Africa
- 4.1. Turkey
- 4.2. Israel
- 4.3. GCC
- 4.4. North Africa
- 4.5. South Africa
- 4.6. Rest of Middle East & Africa
-
5. Asia Pacific
- 5.1. China
- 5.2. India
- 5.3. Japan
- 5.4. South Korea
- 5.5. ASEAN
- 5.6. Oceania
- 5.7. Rest of Asia Pacific
Viral Inactivation REPORT HIGHLIGHTS
| Aspects | Details |
|---|---|
| Study Period | 2019-2033 |
| Base Year | 2024 |
| Estimated Year | 2025 |
| Forecast Period | 2025-2033 |
| Historical Period | 2019-2024 |
| Growth Rate | CAGR of 10.1% from 2019-2033 |
| Segmentation |
|
Table of Contents
- 1. Introduction
- 1.1. Research Scope
- 1.2. Market Segmentation
- 1.3. Research Methodology
- 1.4. Definitions and Assumptions
- 2. Executive Summary
- 2.1. Introduction
- 3. Market Dynamics
- 3.1. Introduction
- 3.2. Market Drivers
- 3.3. Market Restrains
- 3.4. Market Trends
- 4. Market Factor Analysis
- 4.1. Porters Five Forces
- 4.2. Supply/Value Chain
- 4.3. PESTEL analysis
- 4.4. Market Entropy
- 4.5. Patent/Trademark Analysis
- 5. Global Viral Inactivation Analysis, Insights and Forecast, 2019-2031
- 5.1. Market Analysis, Insights and Forecast - by Application
- 5.1.1. Blood and Blood Products
- 5.1.2. Cellular and Gene Therapy Products
- 5.1.3. Stem Cell Products
- 5.1.4. Tissue and Tissue Products
- 5.1.5. Vaccines and Therapeutics
- 5.2. Market Analysis, Insights and Forecast - by Type
- 5.2.1. Kits and Reagents
- 5.2.2. Services
- 5.2.3. Viral Inactivation Systems and Accessories
- 5.3. Market Analysis, Insights and Forecast - by Region
- 5.3.1. North America
- 5.3.2. South America
- 5.3.3. Europe
- 5.3.4. Middle East & Africa
- 5.3.5. Asia Pacific
- 5.1. Market Analysis, Insights and Forecast - by Application
- 6. North America Viral Inactivation Analysis, Insights and Forecast, 2019-2031
- 6.1. Market Analysis, Insights and Forecast - by Application
- 6.1.1. Blood and Blood Products
- 6.1.2. Cellular and Gene Therapy Products
- 6.1.3. Stem Cell Products
- 6.1.4. Tissue and Tissue Products
- 6.1.5. Vaccines and Therapeutics
- 6.2. Market Analysis, Insights and Forecast - by Type
- 6.2.1. Kits and Reagents
- 6.2.2. Services
- 6.2.3. Viral Inactivation Systems and Accessories
- 6.1. Market Analysis, Insights and Forecast - by Application
- 7. South America Viral Inactivation Analysis, Insights and Forecast, 2019-2031
- 7.1. Market Analysis, Insights and Forecast - by Application
- 7.1.1. Blood and Blood Products
- 7.1.2. Cellular and Gene Therapy Products
- 7.1.3. Stem Cell Products
- 7.1.4. Tissue and Tissue Products
- 7.1.5. Vaccines and Therapeutics
- 7.2. Market Analysis, Insights and Forecast - by Type
- 7.2.1. Kits and Reagents
- 7.2.2. Services
- 7.2.3. Viral Inactivation Systems and Accessories
- 7.1. Market Analysis, Insights and Forecast - by Application
- 8. Europe Viral Inactivation Analysis, Insights and Forecast, 2019-2031
- 8.1. Market Analysis, Insights and Forecast - by Application
- 8.1.1. Blood and Blood Products
- 8.1.2. Cellular and Gene Therapy Products
- 8.1.3. Stem Cell Products
- 8.1.4. Tissue and Tissue Products
- 8.1.5. Vaccines and Therapeutics
- 8.2. Market Analysis, Insights and Forecast - by Type
- 8.2.1. Kits and Reagents
- 8.2.2. Services
- 8.2.3. Viral Inactivation Systems and Accessories
- 8.1. Market Analysis, Insights and Forecast - by Application
- 9. Middle East & Africa Viral Inactivation Analysis, Insights and Forecast, 2019-2031
- 9.1. Market Analysis, Insights and Forecast - by Application
- 9.1.1. Blood and Blood Products
- 9.1.2. Cellular and Gene Therapy Products
- 9.1.3. Stem Cell Products
- 9.1.4. Tissue and Tissue Products
- 9.1.5. Vaccines and Therapeutics
- 9.2. Market Analysis, Insights and Forecast - by Type
- 9.2.1. Kits and Reagents
- 9.2.2. Services
- 9.2.3. Viral Inactivation Systems and Accessories
- 9.1. Market Analysis, Insights and Forecast - by Application
- 10. Asia Pacific Viral Inactivation Analysis, Insights and Forecast, 2019-2031
- 10.1. Market Analysis, Insights and Forecast - by Application
- 10.1.1. Blood and Blood Products
- 10.1.2. Cellular and Gene Therapy Products
- 10.1.3. Stem Cell Products
- 10.1.4. Tissue and Tissue Products
- 10.1.5. Vaccines and Therapeutics
- 10.2. Market Analysis, Insights and Forecast - by Type
- 10.2.1. Kits and Reagents
- 10.2.2. Services
- 10.2.3. Viral Inactivation Systems and Accessories
- 10.1. Market Analysis, Insights and Forecast - by Application
- 11. Competitive Analysis
- 11.1. Global Market Share Analysis 2024
- 11.2. Company Profiles
- 11.2.1 Danaher
- 11.2.1.1. Overview
- 11.2.1.2. Products
- 11.2.1.3. SWOT Analysis
- 11.2.1.4. Recent Developments
- 11.2.1.5. Financials (Based on Availability)
- 11.2.2 Merck
- 11.2.2.1. Overview
- 11.2.2.2. Products
- 11.2.2.3. SWOT Analysis
- 11.2.2.4. Recent Developments
- 11.2.2.5. Financials (Based on Availability)
- 11.2.3 Parker Hannifin
- 11.2.3.1. Overview
- 11.2.3.2. Products
- 11.2.3.3. SWOT Analysis
- 11.2.3.4. Recent Developments
- 11.2.3.5. Financials (Based on Availability)
- 11.2.4 Sartorius
- 11.2.4.1. Overview
- 11.2.4.2. Products
- 11.2.4.3. SWOT Analysis
- 11.2.4.4. Recent Developments
- 11.2.4.5. Financials (Based on Availability)
- 11.2.5 SGS
- 11.2.5.1. Overview
- 11.2.5.2. Products
- 11.2.5.3. SWOT Analysis
- 11.2.5.4. Recent Developments
- 11.2.5.5. Financials (Based on Availability)
- 11.2.6 Charles River Laboratories International
- 11.2.6.1. Overview
- 11.2.6.2. Products
- 11.2.6.3. SWOT Analysis
- 11.2.6.4. Recent Developments
- 11.2.6.5. Financials (Based on Availability)
- 11.2.7 Clean Cells
- 11.2.7.1. Overview
- 11.2.7.2. Products
- 11.2.7.3. SWOT Analysis
- 11.2.7.4. Recent Developments
- 11.2.7.5. Financials (Based on Availability)
- 11.2.8 Rad Source Technologies
- 11.2.8.1. Overview
- 11.2.8.2. Products
- 11.2.8.3. SWOT Analysis
- 11.2.8.4. Recent Developments
- 11.2.8.5. Financials (Based on Availability)
- 11.2.9 Texcell
- 11.2.9.1. Overview
- 11.2.9.2. Products
- 11.2.9.3. SWOT Analysis
- 11.2.9.4. Recent Developments
- 11.2.9.5. Financials (Based on Availability)
- 11.2.10 Viral Inactivated Plasma Systems
- 11.2.10.1. Overview
- 11.2.10.2. Products
- 11.2.10.3. SWOT Analysis
- 11.2.10.4. Recent Developments
- 11.2.10.5. Financials (Based on Availability)
- 11.2.11 Wuxi Pharmatech (Cayman)
- 11.2.11.1. Overview
- 11.2.11.2. Products
- 11.2.11.3. SWOT Analysis
- 11.2.11.4. Recent Developments
- 11.2.11.5. Financials (Based on Availability)
- 11.2.1 Danaher
List of Figures
- Figure 1: Global Viral Inactivation Revenue Breakdown (million, %) by Region 2024 & 2032
- Figure 2: North America Viral Inactivation Revenue (million), by Application 2024 & 2032
- Figure 3: North America Viral Inactivation Revenue Share (%), by Application 2024 & 2032
- Figure 4: North America Viral Inactivation Revenue (million), by Type 2024 & 2032
- Figure 5: North America Viral Inactivation Revenue Share (%), by Type 2024 & 2032
- Figure 6: North America Viral Inactivation Revenue (million), by Country 2024 & 2032
- Figure 7: North America Viral Inactivation Revenue Share (%), by Country 2024 & 2032
- Figure 8: South America Viral Inactivation Revenue (million), by Application 2024 & 2032
- Figure 9: South America Viral Inactivation Revenue Share (%), by Application 2024 & 2032
- Figure 10: South America Viral Inactivation Revenue (million), by Type 2024 & 2032
- Figure 11: South America Viral Inactivation Revenue Share (%), by Type 2024 & 2032
- Figure 12: South America Viral Inactivation Revenue (million), by Country 2024 & 2032
- Figure 13: South America Viral Inactivation Revenue Share (%), by Country 2024 & 2032
- Figure 14: Europe Viral Inactivation Revenue (million), by Application 2024 & 2032
- Figure 15: Europe Viral Inactivation Revenue Share (%), by Application 2024 & 2032
- Figure 16: Europe Viral Inactivation Revenue (million), by Type 2024 & 2032
- Figure 17: Europe Viral Inactivation Revenue Share (%), by Type 2024 & 2032
- Figure 18: Europe Viral Inactivation Revenue (million), by Country 2024 & 2032
- Figure 19: Europe Viral Inactivation Revenue Share (%), by Country 2024 & 2032
- Figure 20: Middle East & Africa Viral Inactivation Revenue (million), by Application 2024 & 2032
- Figure 21: Middle East & Africa Viral Inactivation Revenue Share (%), by Application 2024 & 2032
- Figure 22: Middle East & Africa Viral Inactivation Revenue (million), by Type 2024 & 2032
- Figure 23: Middle East & Africa Viral Inactivation Revenue Share (%), by Type 2024 & 2032
- Figure 24: Middle East & Africa Viral Inactivation Revenue (million), by Country 2024 & 2032
- Figure 25: Middle East & Africa Viral Inactivation Revenue Share (%), by Country 2024 & 2032
- Figure 26: Asia Pacific Viral Inactivation Revenue (million), by Application 2024 & 2032
- Figure 27: Asia Pacific Viral Inactivation Revenue Share (%), by Application 2024 & 2032
- Figure 28: Asia Pacific Viral Inactivation Revenue (million), by Type 2024 & 2032
- Figure 29: Asia Pacific Viral Inactivation Revenue Share (%), by Type 2024 & 2032
- Figure 30: Asia Pacific Viral Inactivation Revenue (million), by Country 2024 & 2032
- Figure 31: Asia Pacific Viral Inactivation Revenue Share (%), by Country 2024 & 2032
List of Tables
- Table 1: Global Viral Inactivation Revenue million Forecast, by Region 2019 & 2032
- Table 2: Global Viral Inactivation Revenue million Forecast, by Application 2019 & 2032
- Table 3: Global Viral Inactivation Revenue million Forecast, by Type 2019 & 2032
- Table 4: Global Viral Inactivation Revenue million Forecast, by Region 2019 & 2032
- Table 5: Global Viral Inactivation Revenue million Forecast, by Application 2019 & 2032
- Table 6: Global Viral Inactivation Revenue million Forecast, by Type 2019 & 2032
- Table 7: Global Viral Inactivation Revenue million Forecast, by Country 2019 & 2032
- Table 8: United States Viral Inactivation Revenue (million) Forecast, by Application 2019 & 2032
- Table 9: Canada Viral Inactivation Revenue (million) Forecast, by Application 2019 & 2032
- Table 10: Mexico Viral Inactivation Revenue (million) Forecast, by Application 2019 & 2032
- Table 11: Global Viral Inactivation Revenue million Forecast, by Application 2019 & 2032
- Table 12: Global Viral Inactivation Revenue million Forecast, by Type 2019 & 2032
- Table 13: Global Viral Inactivation Revenue million Forecast, by Country 2019 & 2032
- Table 14: Brazil Viral Inactivation Revenue (million) Forecast, by Application 2019 & 2032
- Table 15: Argentina Viral Inactivation Revenue (million) Forecast, by Application 2019 & 2032
- Table 16: Rest of South America Viral Inactivation Revenue (million) Forecast, by Application 2019 & 2032
- Table 17: Global Viral Inactivation Revenue million Forecast, by Application 2019 & 2032
- Table 18: Global Viral Inactivation Revenue million Forecast, by Type 2019 & 2032
- Table 19: Global Viral Inactivation Revenue million Forecast, by Country 2019 & 2032
- Table 20: United Kingdom Viral Inactivation Revenue (million) Forecast, by Application 2019 & 2032
- Table 21: Germany Viral Inactivation Revenue (million) Forecast, by Application 2019 & 2032
- Table 22: France Viral Inactivation Revenue (million) Forecast, by Application 2019 & 2032
- Table 23: Italy Viral Inactivation Revenue (million) Forecast, by Application 2019 & 2032
- Table 24: Spain Viral Inactivation Revenue (million) Forecast, by Application 2019 & 2032
- Table 25: Russia Viral Inactivation Revenue (million) Forecast, by Application 2019 & 2032
- Table 26: Benelux Viral Inactivation Revenue (million) Forecast, by Application 2019 & 2032
- Table 27: Nordics Viral Inactivation Revenue (million) Forecast, by Application 2019 & 2032
- Table 28: Rest of Europe Viral Inactivation Revenue (million) Forecast, by Application 2019 & 2032
- Table 29: Global Viral Inactivation Revenue million Forecast, by Application 2019 & 2032
- Table 30: Global Viral Inactivation Revenue million Forecast, by Type 2019 & 2032
- Table 31: Global Viral Inactivation Revenue million Forecast, by Country 2019 & 2032
- Table 32: Turkey Viral Inactivation Revenue (million) Forecast, by Application 2019 & 2032
- Table 33: Israel Viral Inactivation Revenue (million) Forecast, by Application 2019 & 2032
- Table 34: GCC Viral Inactivation Revenue (million) Forecast, by Application 2019 & 2032
- Table 35: North Africa Viral Inactivation Revenue (million) Forecast, by Application 2019 & 2032
- Table 36: South Africa Viral Inactivation Revenue (million) Forecast, by Application 2019 & 2032
- Table 37: Rest of Middle East & Africa Viral Inactivation Revenue (million) Forecast, by Application 2019 & 2032
- Table 38: Global Viral Inactivation Revenue million Forecast, by Application 2019 & 2032
- Table 39: Global Viral Inactivation Revenue million Forecast, by Type 2019 & 2032
- Table 40: Global Viral Inactivation Revenue million Forecast, by Country 2019 & 2032
- Table 41: China Viral Inactivation Revenue (million) Forecast, by Application 2019 & 2032
- Table 42: India Viral Inactivation Revenue (million) Forecast, by Application 2019 & 2032
- Table 43: Japan Viral Inactivation Revenue (million) Forecast, by Application 2019 & 2032
- Table 44: South Korea Viral Inactivation Revenue (million) Forecast, by Application 2019 & 2032
- Table 45: ASEAN Viral Inactivation Revenue (million) Forecast, by Application 2019 & 2032
- Table 46: Oceania Viral Inactivation Revenue (million) Forecast, by Application 2019 & 2032
- Table 47: Rest of Asia Pacific Viral Inactivation Revenue (million) Forecast, by Application 2019 & 2032
Frequently Asked Questions
1. What is the projected Compound Annual Growth Rate (CAGR) of the Viral Inactivation?
The projected CAGR is approximately 10.1%.
2. Which companies are prominent players in the Viral Inactivation?
Key companies in the market include Danaher, Merck, Parker Hannifin, Sartorius, SGS, Charles River Laboratories International, Clean Cells, Rad Source Technologies, Texcell, Viral Inactivated Plasma Systems, Wuxi Pharmatech (Cayman).
3. What are the main segments of the Viral Inactivation?
The market segments include Application, Type.
4. Can you provide details about the market size?
The market size is estimated to be USD 1177 million as of 2022.
5. What are some drivers contributing to market growth?
N/A
6. What are the notable trends driving market growth?
N/A
7. Are there any restraints impacting market growth?
N/A
8. Can you provide examples of recent developments in the market?
N/A
9. What pricing options are available for accessing the report?
Pricing options include single-user, multi-user, and enterprise licenses priced at USD 2900.00, USD 4350.00, and USD 5800.00 respectively.
10. Is the market size provided in terms of value or volume?
The market size is provided in terms of value, measured in million.
11. Are there any specific market keywords associated with the report?
Yes, the market keyword associated with the report is "Viral Inactivation," which aids in identifying and referencing the specific market segment covered.
12. How do I determine which pricing option suits my needs best?
The pricing options vary based on user requirements and access needs. Individual users may opt for single-user licenses, while businesses requiring broader access may choose multi-user or enterprise licenses for cost-effective access to the report.
13. Are there any additional resources or data provided in the Viral Inactivation report?
While the report offers comprehensive insights, it's advisable to review the specific contents or supplementary materials provided to ascertain if additional resources or data are available.
14. How can I stay updated on further developments or reports in the Viral Inactivation?
To stay informed about further developments, trends, and reports in the Viral Inactivation, consider subscribing to industry newsletters, following relevant companies and organizations, or regularly checking reputable industry news sources and publications.
Methodology
Step 1 - Identification of Relevant Samples Size from Population Database


Step 2 - Approaches for Defining Global Market Size (Value, Volume* & Price*)

Note*: In applicable scenarios
Step 3 - Data Sources
Primary Research
- Web Analytics
- Survey Reports
- Research Institute
- Latest Research Reports
- Opinion Leaders
Secondary Research
- Annual Reports
- White Paper
- Latest Press Release
- Industry Association
- Paid Database
- Investor Presentations

Step 4 - Data Triangulation
Involves using different sources of information in order to increase the validity of a study
These sources are likely to be stakeholders in a program - participants, other researchers, program staff, other community members, and so on.
Then we put all data in single framework & apply various statistical tools to find out the dynamic on the market.
During the analysis stage, feedback from the stakeholder groups would be compared to determine areas of agreement as well as areas of divergence


