
Key Insights
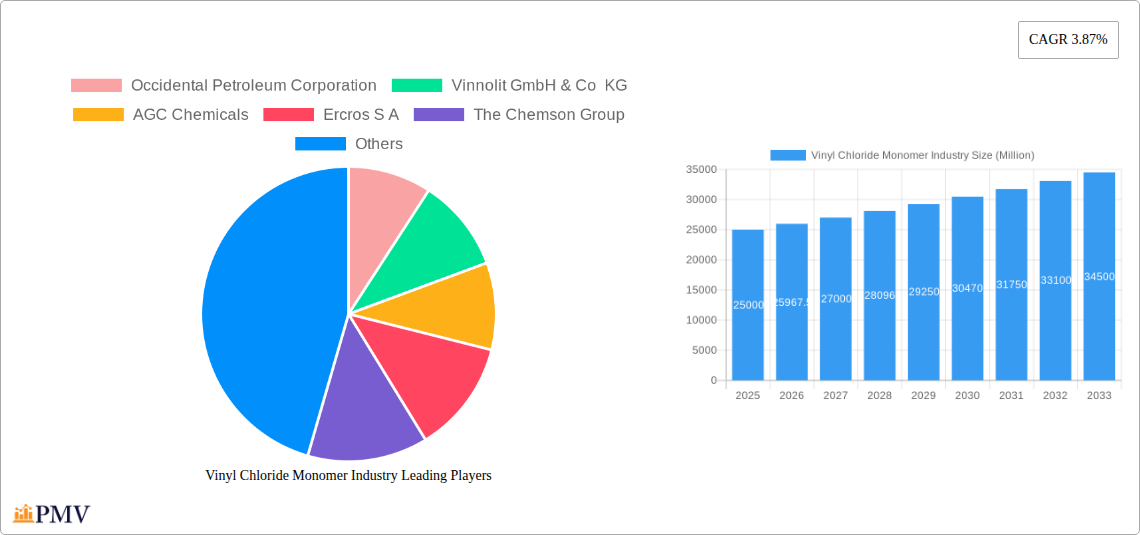
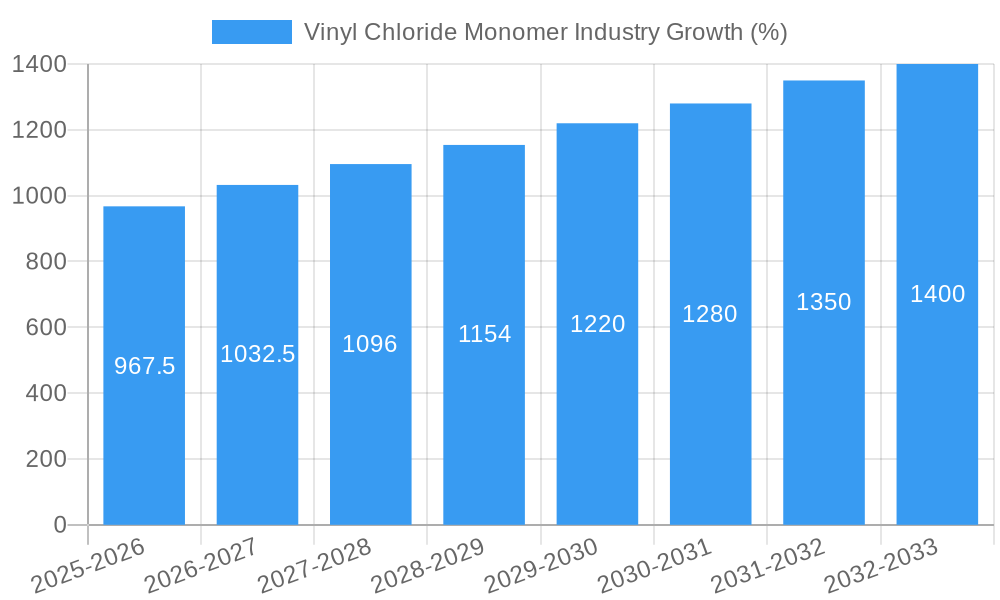
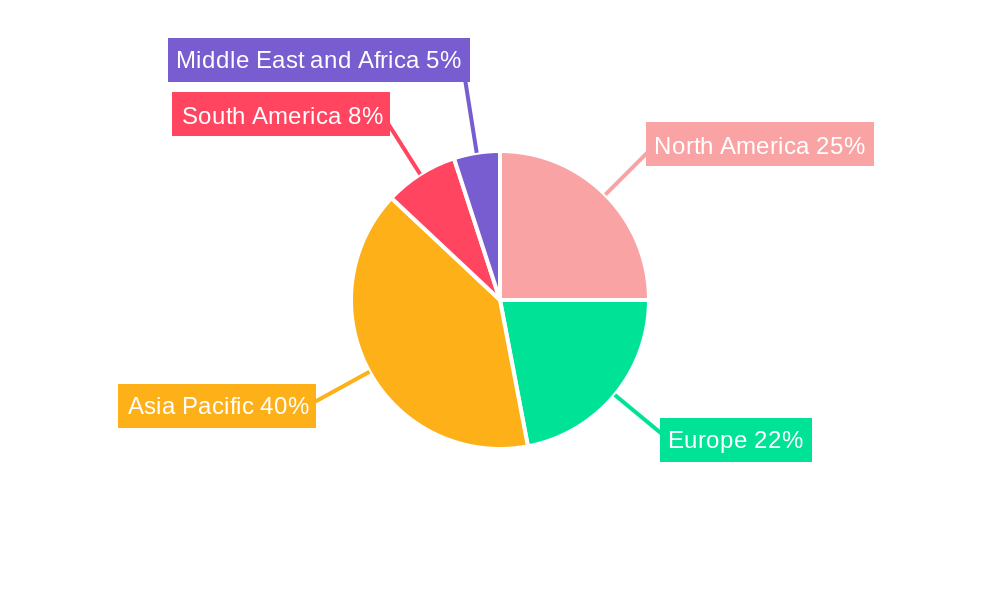
The global Vinyl Chloride Monomer (VCM) market, valued at approximately $25 billion in 2025, is projected to experience steady growth, with a Compound Annual Growth Rate (CAGR) of 3.87% from 2025 to 2033. This growth is driven by the robust demand from key end-user industries, primarily building and construction, fueled by ongoing infrastructure development globally. The increasing use of PVC in pipes, windows, and other construction materials contributes significantly to VCM demand. Furthermore, the healthcare sector's reliance on PVC for medical devices and packaging also fuels market expansion. Technological advancements in PVC production, aimed at enhancing efficiency and reducing environmental impact, are also shaping market dynamics. However, fluctuating crude oil prices, a key raw material for VCM production, represent a significant restraint on market growth. Stringent environmental regulations regarding PVC disposal and the emergence of alternative materials pose additional challenges. Market segmentation reveals a strong dominance of the building and construction sector as the largest end-user, followed by the healthcare industry. PVC remains the primary application, accounting for a substantial share of VCM consumption. Geographical analysis shows that the Asia-Pacific region, particularly China and India, are key growth drivers due to rapid industrialization and urbanization. North America and Europe also contribute significantly to the market, although at a comparatively slower growth rate.
The competitive landscape is characterized by a mix of large multinational corporations and regional players. Companies like Occidental Petroleum, Vinnolit, AGC Chemicals, and Dow Chemical dominate the market, leveraging their established production capacity and extensive distribution networks. However, smaller players are also emerging, focusing on niche applications and regional markets. Future market growth will depend on several factors including sustained infrastructure development, technological innovations promoting sustainable PVC production, and the ability of industry players to navigate fluctuating raw material prices and environmental regulations effectively. A balanced approach to addressing environmental concerns while meeting the growing demand for PVC products will be crucial for long-term market sustainability.
Vinyl Chloride Monomer (VCM) Industry Market Report: 2019-2033
This comprehensive report provides an in-depth analysis of the global Vinyl Chloride Monomer (VCM) industry, covering market size, growth drivers, competitive landscape, and future outlook. The study period spans from 2019 to 2033, with 2025 serving as both the base and estimated year. This report is essential for industry stakeholders, investors, and researchers seeking a clear understanding of this dynamic market.
Vinyl Chloride Monomer Industry Market Structure & Competitive Dynamics
The global VCM market exhibits a moderately concentrated structure, with several major players holding significant market share. Key players include Occidental Petroleum Corporation, Vinnolit GmbH & Co KG, AGC Chemicals, Ercros S A, The Chemson Group, Westlake Chemical Corporation, Olin Corporation, Reliance Industries Limited, Vynova Group, Tosoh Corporation, NOVA Chemicals, Dow, Mexichem, The Axiall Corporation, and Shin-Etsu PVC B V. The market is characterized by ongoing M&A activity, with deal values varying significantly depending on the size and strategic importance of the acquired assets. For example, a major acquisition in 2022 resulted in a xx Million USD increase in market consolidation. Innovation ecosystems are crucial, with companies investing heavily in R&D to improve production efficiency and develop new applications for VCM. Stringent regulatory frameworks concerning environmental protection and worker safety significantly impact the industry. Product substitutes, such as other polymers, pose a competitive threat, though VCM's superior properties in many applications maintain its dominance. End-user trends, particularly in the construction and packaging sectors, significantly influence VCM demand. The market share of the top five players is estimated at xx% in 2025, indicating a moderate level of concentration.
Vinyl Chloride Monomer Industry Industry Trends & Insights
The global VCM market is projected to witness a Compound Annual Growth Rate (CAGR) of xx% during the forecast period (2025-2033). Growth is primarily driven by the expanding construction industry, particularly in developing economies. Increased demand for PVC pipes, profiles, and films fuels VCM consumption. Technological advancements, such as the development of more efficient production processes and the implementation of digital twins for plant optimization (as demonstrated by AGC Chemicals' recent initiative), are improving productivity and sustainability. Consumer preferences for durable and cost-effective materials continue to support VCM demand. However, fluctuations in raw material prices and environmental regulations pose significant challenges. Market penetration of VCM in emerging applications, such as medical devices and specialized packaging, presents opportunities for future growth. The industry is witnessing a shift towards sustainable production methods, driven by growing environmental concerns.
Dominant Markets & Segments in Vinyl Chloride Monomer Industry
The building and construction sector remains the dominant end-user industry for VCM, accounting for approximately xx% of global consumption in 2025. This segment's growth is largely fueled by infrastructure development projects globally, particularly in rapidly developing Asian and African economies.
- Key Drivers in Building & Construction:
- Robust infrastructure development initiatives in emerging markets.
- Rising urbanization and increasing demand for housing.
- Government policies supporting construction activities.
The PVC application segment dominates VCM consumption, accounting for over xx% of total demand. Other applications, while smaller, are expected to show faster growth due to innovation and new product development. Geographically, Asia-Pacific is expected to remain the leading region, driven by strong economic growth and substantial infrastructure investments.
- Regional Dominance: Asia-Pacific's dominance stems from the region’s rapid industrialization and urbanization, creating a high demand for PVC-based products.
- Country Dominance: China is the leading VCM consumer due to its massive construction sector and rapidly expanding manufacturing industries.
Vinyl Chloride Monomer Industry Product Innovations
Recent innovations in the VCM industry focus on enhancing production efficiency, improving product quality, and expanding applications. Companies are investing in advanced technologies such as process automation and digital twin technology to optimize operations and reduce environmental impact. The development of specialized VCM grades for niche applications, such as high-performance films and medical devices, is driving innovation and expanding market reach. This focus on improving sustainability and efficiency is becoming increasingly critical to maintain market competitiveness.
Report Segmentation & Scope
This report segments the VCM market based on end-user industries (Building and Construction, Healthcare, Electrical, Other End-user Industries) and applications (PVC, Other Applications). Each segment's growth projections, market size (in Million USD), and competitive landscape are comprehensively analyzed. The Building and Construction segment is expected to show a CAGR of xx% during the forecast period, while the PVC application segment is projected to grow at xx%. The other end-user industries and applications are anticipated to show higher growth rates due to their relatively smaller base and opportunities for expansion. Competitive dynamics vary across segments, with some experiencing high competition and others with more niche players.
Key Drivers of Vinyl Chloride Monomer Industry Growth
The VCM industry's growth is fueled by several factors. The expanding global construction sector, particularly in developing economies, is a major driver. Increasing demand for PVC-based products in diverse applications, such as packaging, healthcare, and electrical, further supports growth. Technological advancements, including process optimization and sustainable production methods, contribute to efficiency gains. Favorable government policies supporting infrastructure development in many countries also create a positive environment for industry growth.
Challenges in the Vinyl Chloride Monomer Industry Sector
The VCM industry faces challenges including stringent environmental regulations, leading to increased production costs and compliance requirements. Fluctuations in raw material prices, particularly ethylene, impact profitability. Intense competition among major players puts pressure on margins. Supply chain disruptions can affect production and deliveries. These challenges necessitate strategic adjustments to maintain competitiveness and profitability. The industry is experiencing a projected xx% increase in production costs due to stricter regulations.
Leading Players in the Vinyl Chloride Monomer Industry Market
- Occidental Petroleum Corporation
- Vinnolit GmbH & Co KG
- AGC Chemicals
- Ercros S A
- The Chemson Group
- Westlake Chemical Corporation
- Olin Corporation
- Reliance Industries Limited
- Vynova Group
- Tosoh Corporation
- NOVA Chemicals
- Dow
- Mexichem
- The Axiall Corporation
- Shin-Etsu PVC B V
Key Developments in Vinyl Chloride Monomer Industry Sector
- April 2023: AGC Chemicals successfully developed and implemented a Process Digital Twin for its chemical plants and commenced operation at its new VCM manufacturing plant in Indonesia. This signifies a significant advancement in production efficiency and optimization within the industry.
Strategic Vinyl Chloride Monomer Industry Market Outlook
The VCM market presents substantial growth potential driven by continued expansion in the construction sector and increasing demand for PVC-based products. Strategic opportunities exist for companies to invest in advanced technologies, develop sustainable production methods, and expand into new applications. Focusing on innovation, operational efficiency, and sustainable practices will be crucial for success in this competitive market. The market is expected to witness significant growth fueled by infrastructure projects and increasing urbanization across various regions.
Vinyl Chloride Monomer Industry Segmentation
-
1. Application
- 1.1. PVC
- 1.2. Other Applications
-
2. End-user Industry
- 2.1. Building and Construction
- 2.2. Healthcare
- 2.3. Electrical
- 2.4. Other End-user Industries
Vinyl Chloride Monomer Industry Segmentation By Geography
-
1. Asia Pacific
- 1.1. China
- 1.2. India
- 1.3. Japan
- 1.4. South Korea
- 1.5. Rest of Asia Pacific
-
2. North America
- 2.1. United States
- 2.2. Canada
- 2.3. Mexico
-
3. Europe
- 3.1. Germany
- 3.2. United Kingdom
- 3.3. France
- 3.4. Italy
- 3.5. Rest of Europe
-
4. South America
- 4.1. Brazil
- 4.2. Argentina
- 4.3. Rest of South America
-
5. Middle East and Africa
- 5.1. Saudi Arabia
- 5.2. South Africa
- 5.3. Rest of Middle East and Africa
Vinyl Chloride Monomer Industry REPORT HIGHLIGHTS
| Aspects | Details |
|---|---|
| Study Period | 2019-2033 |
| Base Year | 2024 |
| Estimated Year | 2025 |
| Forecast Period | 2025-2033 |
| Historical Period | 2019-2024 |
| Growth Rate | CAGR of 3.87% from 2019-2033 |
| Segmentation |
|
Table of Contents
- 1. Introduction
- 1.1. Research Scope
- 1.2. Market Segmentation
- 1.3. Research Methodology
- 1.4. Definitions and Assumptions
- 2. Executive Summary
- 2.1. Introduction
- 3. Market Dynamics
- 3.1. Introduction
- 3.2. Market Drivers
- 3.2.1. Rising Demand in Healthcare Sector; High Consumption from Building and Construction Industry
- 3.3. Market Restrains
- 3.3.1. Increasing Environmental Concerns and Availability of Substitutes in Various Applications; Other Restraints
- 3.4. Market Trends
- 3.4.1. Building and Construction Sector to Boost Market
- 4. Market Factor Analysis
- 4.1. Porters Five Forces
- 4.2. Supply/Value Chain
- 4.3. PESTEL analysis
- 4.4. Market Entropy
- 4.5. Patent/Trademark Analysis
- 5. Global Vinyl Chloride Monomer Industry Analysis, Insights and Forecast, 2019-2031
- 5.1. Market Analysis, Insights and Forecast - by Application
- 5.1.1. PVC
- 5.1.2. Other Applications
- 5.2. Market Analysis, Insights and Forecast - by End-user Industry
- 5.2.1. Building and Construction
- 5.2.2. Healthcare
- 5.2.3. Electrical
- 5.2.4. Other End-user Industries
- 5.3. Market Analysis, Insights and Forecast - by Region
- 5.3.1. Asia Pacific
- 5.3.2. North America
- 5.3.3. Europe
- 5.3.4. South America
- 5.3.5. Middle East and Africa
- 5.1. Market Analysis, Insights and Forecast - by Application
- 6. Asia Pacific Vinyl Chloride Monomer Industry Analysis, Insights and Forecast, 2019-2031
- 6.1. Market Analysis, Insights and Forecast - by Application
- 6.1.1. PVC
- 6.1.2. Other Applications
- 6.2. Market Analysis, Insights and Forecast - by End-user Industry
- 6.2.1. Building and Construction
- 6.2.2. Healthcare
- 6.2.3. Electrical
- 6.2.4. Other End-user Industries
- 6.1. Market Analysis, Insights and Forecast - by Application
- 7. North America Vinyl Chloride Monomer Industry Analysis, Insights and Forecast, 2019-2031
- 7.1. Market Analysis, Insights and Forecast - by Application
- 7.1.1. PVC
- 7.1.2. Other Applications
- 7.2. Market Analysis, Insights and Forecast - by End-user Industry
- 7.2.1. Building and Construction
- 7.2.2. Healthcare
- 7.2.3. Electrical
- 7.2.4. Other End-user Industries
- 7.1. Market Analysis, Insights and Forecast - by Application
- 8. Europe Vinyl Chloride Monomer Industry Analysis, Insights and Forecast, 2019-2031
- 8.1. Market Analysis, Insights and Forecast - by Application
- 8.1.1. PVC
- 8.1.2. Other Applications
- 8.2. Market Analysis, Insights and Forecast - by End-user Industry
- 8.2.1. Building and Construction
- 8.2.2. Healthcare
- 8.2.3. Electrical
- 8.2.4. Other End-user Industries
- 8.1. Market Analysis, Insights and Forecast - by Application
- 9. South America Vinyl Chloride Monomer Industry Analysis, Insights and Forecast, 2019-2031
- 9.1. Market Analysis, Insights and Forecast - by Application
- 9.1.1. PVC
- 9.1.2. Other Applications
- 9.2. Market Analysis, Insights and Forecast - by End-user Industry
- 9.2.1. Building and Construction
- 9.2.2. Healthcare
- 9.2.3. Electrical
- 9.2.4. Other End-user Industries
- 9.1. Market Analysis, Insights and Forecast - by Application
- 10. Middle East and Africa Vinyl Chloride Monomer Industry Analysis, Insights and Forecast, 2019-2031
- 10.1. Market Analysis, Insights and Forecast - by Application
- 10.1.1. PVC
- 10.1.2. Other Applications
- 10.2. Market Analysis, Insights and Forecast - by End-user Industry
- 10.2.1. Building and Construction
- 10.2.2. Healthcare
- 10.2.3. Electrical
- 10.2.4. Other End-user Industries
- 10.1. Market Analysis, Insights and Forecast - by Application
- 11. Asia Pacific Vinyl Chloride Monomer Industry Analysis, Insights and Forecast, 2019-2031
- 11.1. Market Analysis, Insights and Forecast - By Country/Sub-region
- 11.1.1 China
- 11.1.2 India
- 11.1.3 Japan
- 11.1.4 South Korea
- 11.1.5 Rest of Asia Pacific
- 12. North America Vinyl Chloride Monomer Industry Analysis, Insights and Forecast, 2019-2031
- 12.1. Market Analysis, Insights and Forecast - By Country/Sub-region
- 12.1.1 United States
- 12.1.2 Canada
- 12.1.3 Mexico
- 13. Europe Vinyl Chloride Monomer Industry Analysis, Insights and Forecast, 2019-2031
- 13.1. Market Analysis, Insights and Forecast - By Country/Sub-region
- 13.1.1 Germany
- 13.1.2 United Kingdom
- 13.1.3 France
- 13.1.4 Italy
- 13.1.5 Rest of Europe
- 14. South America Vinyl Chloride Monomer Industry Analysis, Insights and Forecast, 2019-2031
- 14.1. Market Analysis, Insights and Forecast - By Country/Sub-region
- 14.1.1 Brazil
- 14.1.2 Argentina
- 14.1.3 Rest of South America
- 15. Middle East and Africa Vinyl Chloride Monomer Industry Analysis, Insights and Forecast, 2019-2031
- 15.1. Market Analysis, Insights and Forecast - By Country/Sub-region
- 15.1.1 Saudi Arabia
- 15.1.2 South Africa
- 15.1.3 Rest of Middle East and Africa
- 16. Competitive Analysis
- 16.1. Global Market Share Analysis 2024
- 16.2. Company Profiles
- 16.2.1 Occidental Petroleum Corporation
- 16.2.1.1. Overview
- 16.2.1.2. Products
- 16.2.1.3. SWOT Analysis
- 16.2.1.4. Recent Developments
- 16.2.1.5. Financials (Based on Availability)
- 16.2.2 Vinnolit GmbH & Co KG
- 16.2.2.1. Overview
- 16.2.2.2. Products
- 16.2.2.3. SWOT Analysis
- 16.2.2.4. Recent Developments
- 16.2.2.5. Financials (Based on Availability)
- 16.2.3 AGC Chemicals
- 16.2.3.1. Overview
- 16.2.3.2. Products
- 16.2.3.3. SWOT Analysis
- 16.2.3.4. Recent Developments
- 16.2.3.5. Financials (Based on Availability)
- 16.2.4 Ercros S A
- 16.2.4.1. Overview
- 16.2.4.2. Products
- 16.2.4.3. SWOT Analysis
- 16.2.4.4. Recent Developments
- 16.2.4.5. Financials (Based on Availability)
- 16.2.5 The Chemson Group
- 16.2.5.1. Overview
- 16.2.5.2. Products
- 16.2.5.3. SWOT Analysis
- 16.2.5.4. Recent Developments
- 16.2.5.5. Financials (Based on Availability)
- 16.2.6 Westlake Chemical Corporation*List Not Exhaustive
- 16.2.6.1. Overview
- 16.2.6.2. Products
- 16.2.6.3. SWOT Analysis
- 16.2.6.4. Recent Developments
- 16.2.6.5. Financials (Based on Availability)
- 16.2.7 Olin Corporation
- 16.2.7.1. Overview
- 16.2.7.2. Products
- 16.2.7.3. SWOT Analysis
- 16.2.7.4. Recent Developments
- 16.2.7.5. Financials (Based on Availability)
- 16.2.8 Reliance Industries Limited
- 16.2.8.1. Overview
- 16.2.8.2. Products
- 16.2.8.3. SWOT Analysis
- 16.2.8.4. Recent Developments
- 16.2.8.5. Financials (Based on Availability)
- 16.2.9 Vynova Group
- 16.2.9.1. Overview
- 16.2.9.2. Products
- 16.2.9.3. SWOT Analysis
- 16.2.9.4. Recent Developments
- 16.2.9.5. Financials (Based on Availability)
- 16.2.10 Tosoh Corporation
- 16.2.10.1. Overview
- 16.2.10.2. Products
- 16.2.10.3. SWOT Analysis
- 16.2.10.4. Recent Developments
- 16.2.10.5. Financials (Based on Availability)
- 16.2.11 NOVA Chemicals
- 16.2.11.1. Overview
- 16.2.11.2. Products
- 16.2.11.3. SWOT Analysis
- 16.2.11.4. Recent Developments
- 16.2.11.5. Financials (Based on Availability)
- 16.2.12 Dow
- 16.2.12.1. Overview
- 16.2.12.2. Products
- 16.2.12.3. SWOT Analysis
- 16.2.12.4. Recent Developments
- 16.2.12.5. Financials (Based on Availability)
- 16.2.13 Mexichem
- 16.2.13.1. Overview
- 16.2.13.2. Products
- 16.2.13.3. SWOT Analysis
- 16.2.13.4. Recent Developments
- 16.2.13.5. Financials (Based on Availability)
- 16.2.14 The Axiall Corporation
- 16.2.14.1. Overview
- 16.2.14.2. Products
- 16.2.14.3. SWOT Analysis
- 16.2.14.4. Recent Developments
- 16.2.14.5. Financials (Based on Availability)
- 16.2.15 Shin-Etsu PVC B V
- 16.2.15.1. Overview
- 16.2.15.2. Products
- 16.2.15.3. SWOT Analysis
- 16.2.15.4. Recent Developments
- 16.2.15.5. Financials (Based on Availability)
- 16.2.1 Occidental Petroleum Corporation
List of Figures
- Figure 1: Global Vinyl Chloride Monomer Industry Revenue Breakdown (Million, %) by Region 2024 & 2032
- Figure 2: Global Vinyl Chloride Monomer Industry Volume Breakdown (Million, %) by Region 2024 & 2032
- Figure 3: Asia Pacific Vinyl Chloride Monomer Industry Revenue (Million), by Country 2024 & 2032
- Figure 4: Asia Pacific Vinyl Chloride Monomer Industry Volume (Million), by Country 2024 & 2032
- Figure 5: Asia Pacific Vinyl Chloride Monomer Industry Revenue Share (%), by Country 2024 & 2032
- Figure 6: Asia Pacific Vinyl Chloride Monomer Industry Volume Share (%), by Country 2024 & 2032
- Figure 7: North America Vinyl Chloride Monomer Industry Revenue (Million), by Country 2024 & 2032
- Figure 8: North America Vinyl Chloride Monomer Industry Volume (Million), by Country 2024 & 2032
- Figure 9: North America Vinyl Chloride Monomer Industry Revenue Share (%), by Country 2024 & 2032
- Figure 10: North America Vinyl Chloride Monomer Industry Volume Share (%), by Country 2024 & 2032
- Figure 11: Europe Vinyl Chloride Monomer Industry Revenue (Million), by Country 2024 & 2032
- Figure 12: Europe Vinyl Chloride Monomer Industry Volume (Million), by Country 2024 & 2032
- Figure 13: Europe Vinyl Chloride Monomer Industry Revenue Share (%), by Country 2024 & 2032
- Figure 14: Europe Vinyl Chloride Monomer Industry Volume Share (%), by Country 2024 & 2032
- Figure 15: South America Vinyl Chloride Monomer Industry Revenue (Million), by Country 2024 & 2032
- Figure 16: South America Vinyl Chloride Monomer Industry Volume (Million), by Country 2024 & 2032
- Figure 17: South America Vinyl Chloride Monomer Industry Revenue Share (%), by Country 2024 & 2032
- Figure 18: South America Vinyl Chloride Monomer Industry Volume Share (%), by Country 2024 & 2032
- Figure 19: Middle East and Africa Vinyl Chloride Monomer Industry Revenue (Million), by Country 2024 & 2032
- Figure 20: Middle East and Africa Vinyl Chloride Monomer Industry Volume (Million), by Country 2024 & 2032
- Figure 21: Middle East and Africa Vinyl Chloride Monomer Industry Revenue Share (%), by Country 2024 & 2032
- Figure 22: Middle East and Africa Vinyl Chloride Monomer Industry Volume Share (%), by Country 2024 & 2032
- Figure 23: Asia Pacific Vinyl Chloride Monomer Industry Revenue (Million), by Application 2024 & 2032
- Figure 24: Asia Pacific Vinyl Chloride Monomer Industry Volume (Million), by Application 2024 & 2032
- Figure 25: Asia Pacific Vinyl Chloride Monomer Industry Revenue Share (%), by Application 2024 & 2032
- Figure 26: Asia Pacific Vinyl Chloride Monomer Industry Volume Share (%), by Application 2024 & 2032
- Figure 27: Asia Pacific Vinyl Chloride Monomer Industry Revenue (Million), by End-user Industry 2024 & 2032
- Figure 28: Asia Pacific Vinyl Chloride Monomer Industry Volume (Million), by End-user Industry 2024 & 2032
- Figure 29: Asia Pacific Vinyl Chloride Monomer Industry Revenue Share (%), by End-user Industry 2024 & 2032
- Figure 30: Asia Pacific Vinyl Chloride Monomer Industry Volume Share (%), by End-user Industry 2024 & 2032
- Figure 31: Asia Pacific Vinyl Chloride Monomer Industry Revenue (Million), by Country 2024 & 2032
- Figure 32: Asia Pacific Vinyl Chloride Monomer Industry Volume (Million), by Country 2024 & 2032
- Figure 33: Asia Pacific Vinyl Chloride Monomer Industry Revenue Share (%), by Country 2024 & 2032
- Figure 34: Asia Pacific Vinyl Chloride Monomer Industry Volume Share (%), by Country 2024 & 2032
- Figure 35: North America Vinyl Chloride Monomer Industry Revenue (Million), by Application 2024 & 2032
- Figure 36: North America Vinyl Chloride Monomer Industry Volume (Million), by Application 2024 & 2032
- Figure 37: North America Vinyl Chloride Monomer Industry Revenue Share (%), by Application 2024 & 2032
- Figure 38: North America Vinyl Chloride Monomer Industry Volume Share (%), by Application 2024 & 2032
- Figure 39: North America Vinyl Chloride Monomer Industry Revenue (Million), by End-user Industry 2024 & 2032
- Figure 40: North America Vinyl Chloride Monomer Industry Volume (Million), by End-user Industry 2024 & 2032
- Figure 41: North America Vinyl Chloride Monomer Industry Revenue Share (%), by End-user Industry 2024 & 2032
- Figure 42: North America Vinyl Chloride Monomer Industry Volume Share (%), by End-user Industry 2024 & 2032
- Figure 43: North America Vinyl Chloride Monomer Industry Revenue (Million), by Country 2024 & 2032
- Figure 44: North America Vinyl Chloride Monomer Industry Volume (Million), by Country 2024 & 2032
- Figure 45: North America Vinyl Chloride Monomer Industry Revenue Share (%), by Country 2024 & 2032
- Figure 46: North America Vinyl Chloride Monomer Industry Volume Share (%), by Country 2024 & 2032
- Figure 47: Europe Vinyl Chloride Monomer Industry Revenue (Million), by Application 2024 & 2032
- Figure 48: Europe Vinyl Chloride Monomer Industry Volume (Million), by Application 2024 & 2032
- Figure 49: Europe Vinyl Chloride Monomer Industry Revenue Share (%), by Application 2024 & 2032
- Figure 50: Europe Vinyl Chloride Monomer Industry Volume Share (%), by Application 2024 & 2032
- Figure 51: Europe Vinyl Chloride Monomer Industry Revenue (Million), by End-user Industry 2024 & 2032
- Figure 52: Europe Vinyl Chloride Monomer Industry Volume (Million), by End-user Industry 2024 & 2032
- Figure 53: Europe Vinyl Chloride Monomer Industry Revenue Share (%), by End-user Industry 2024 & 2032
- Figure 54: Europe Vinyl Chloride Monomer Industry Volume Share (%), by End-user Industry 2024 & 2032
- Figure 55: Europe Vinyl Chloride Monomer Industry Revenue (Million), by Country 2024 & 2032
- Figure 56: Europe Vinyl Chloride Monomer Industry Volume (Million), by Country 2024 & 2032
- Figure 57: Europe Vinyl Chloride Monomer Industry Revenue Share (%), by Country 2024 & 2032
- Figure 58: Europe Vinyl Chloride Monomer Industry Volume Share (%), by Country 2024 & 2032
- Figure 59: South America Vinyl Chloride Monomer Industry Revenue (Million), by Application 2024 & 2032
- Figure 60: South America Vinyl Chloride Monomer Industry Volume (Million), by Application 2024 & 2032
- Figure 61: South America Vinyl Chloride Monomer Industry Revenue Share (%), by Application 2024 & 2032
- Figure 62: South America Vinyl Chloride Monomer Industry Volume Share (%), by Application 2024 & 2032
- Figure 63: South America Vinyl Chloride Monomer Industry Revenue (Million), by End-user Industry 2024 & 2032
- Figure 64: South America Vinyl Chloride Monomer Industry Volume (Million), by End-user Industry 2024 & 2032
- Figure 65: South America Vinyl Chloride Monomer Industry Revenue Share (%), by End-user Industry 2024 & 2032
- Figure 66: South America Vinyl Chloride Monomer Industry Volume Share (%), by End-user Industry 2024 & 2032
- Figure 67: South America Vinyl Chloride Monomer Industry Revenue (Million), by Country 2024 & 2032
- Figure 68: South America Vinyl Chloride Monomer Industry Volume (Million), by Country 2024 & 2032
- Figure 69: South America Vinyl Chloride Monomer Industry Revenue Share (%), by Country 2024 & 2032
- Figure 70: South America Vinyl Chloride Monomer Industry Volume Share (%), by Country 2024 & 2032
- Figure 71: Middle East and Africa Vinyl Chloride Monomer Industry Revenue (Million), by Application 2024 & 2032
- Figure 72: Middle East and Africa Vinyl Chloride Monomer Industry Volume (Million), by Application 2024 & 2032
- Figure 73: Middle East and Africa Vinyl Chloride Monomer Industry Revenue Share (%), by Application 2024 & 2032
- Figure 74: Middle East and Africa Vinyl Chloride Monomer Industry Volume Share (%), by Application 2024 & 2032
- Figure 75: Middle East and Africa Vinyl Chloride Monomer Industry Revenue (Million), by End-user Industry 2024 & 2032
- Figure 76: Middle East and Africa Vinyl Chloride Monomer Industry Volume (Million), by End-user Industry 2024 & 2032
- Figure 77: Middle East and Africa Vinyl Chloride Monomer Industry Revenue Share (%), by End-user Industry 2024 & 2032
- Figure 78: Middle East and Africa Vinyl Chloride Monomer Industry Volume Share (%), by End-user Industry 2024 & 2032
- Figure 79: Middle East and Africa Vinyl Chloride Monomer Industry Revenue (Million), by Country 2024 & 2032
- Figure 80: Middle East and Africa Vinyl Chloride Monomer Industry Volume (Million), by Country 2024 & 2032
- Figure 81: Middle East and Africa Vinyl Chloride Monomer Industry Revenue Share (%), by Country 2024 & 2032
- Figure 82: Middle East and Africa Vinyl Chloride Monomer Industry Volume Share (%), by Country 2024 & 2032
List of Tables
- Table 1: Global Vinyl Chloride Monomer Industry Revenue Million Forecast, by Region 2019 & 2032
- Table 2: Global Vinyl Chloride Monomer Industry Volume Million Forecast, by Region 2019 & 2032
- Table 3: Global Vinyl Chloride Monomer Industry Revenue Million Forecast, by Application 2019 & 2032
- Table 4: Global Vinyl Chloride Monomer Industry Volume Million Forecast, by Application 2019 & 2032
- Table 5: Global Vinyl Chloride Monomer Industry Revenue Million Forecast, by End-user Industry 2019 & 2032
- Table 6: Global Vinyl Chloride Monomer Industry Volume Million Forecast, by End-user Industry 2019 & 2032
- Table 7: Global Vinyl Chloride Monomer Industry Revenue Million Forecast, by Region 2019 & 2032
- Table 8: Global Vinyl Chloride Monomer Industry Volume Million Forecast, by Region 2019 & 2032
- Table 9: Global Vinyl Chloride Monomer Industry Revenue Million Forecast, by Country 2019 & 2032
- Table 10: Global Vinyl Chloride Monomer Industry Volume Million Forecast, by Country 2019 & 2032
- Table 11: China Vinyl Chloride Monomer Industry Revenue (Million) Forecast, by Application 2019 & 2032
- Table 12: China Vinyl Chloride Monomer Industry Volume (Million) Forecast, by Application 2019 & 2032
- Table 13: India Vinyl Chloride Monomer Industry Revenue (Million) Forecast, by Application 2019 & 2032
- Table 14: India Vinyl Chloride Monomer Industry Volume (Million) Forecast, by Application 2019 & 2032
- Table 15: Japan Vinyl Chloride Monomer Industry Revenue (Million) Forecast, by Application 2019 & 2032
- Table 16: Japan Vinyl Chloride Monomer Industry Volume (Million) Forecast, by Application 2019 & 2032
- Table 17: South Korea Vinyl Chloride Monomer Industry Revenue (Million) Forecast, by Application 2019 & 2032
- Table 18: South Korea Vinyl Chloride Monomer Industry Volume (Million) Forecast, by Application 2019 & 2032
- Table 19: Rest of Asia Pacific Vinyl Chloride Monomer Industry Revenue (Million) Forecast, by Application 2019 & 2032
- Table 20: Rest of Asia Pacific Vinyl Chloride Monomer Industry Volume (Million) Forecast, by Application 2019 & 2032
- Table 21: Global Vinyl Chloride Monomer Industry Revenue Million Forecast, by Country 2019 & 2032
- Table 22: Global Vinyl Chloride Monomer Industry Volume Million Forecast, by Country 2019 & 2032
- Table 23: United States Vinyl Chloride Monomer Industry Revenue (Million) Forecast, by Application 2019 & 2032
- Table 24: United States Vinyl Chloride Monomer Industry Volume (Million) Forecast, by Application 2019 & 2032
- Table 25: Canada Vinyl Chloride Monomer Industry Revenue (Million) Forecast, by Application 2019 & 2032
- Table 26: Canada Vinyl Chloride Monomer Industry Volume (Million) Forecast, by Application 2019 & 2032
- Table 27: Mexico Vinyl Chloride Monomer Industry Revenue (Million) Forecast, by Application 2019 & 2032
- Table 28: Mexico Vinyl Chloride Monomer Industry Volume (Million) Forecast, by Application 2019 & 2032
- Table 29: Global Vinyl Chloride Monomer Industry Revenue Million Forecast, by Country 2019 & 2032
- Table 30: Global Vinyl Chloride Monomer Industry Volume Million Forecast, by Country 2019 & 2032
- Table 31: Germany Vinyl Chloride Monomer Industry Revenue (Million) Forecast, by Application 2019 & 2032
- Table 32: Germany Vinyl Chloride Monomer Industry Volume (Million) Forecast, by Application 2019 & 2032
- Table 33: United Kingdom Vinyl Chloride Monomer Industry Revenue (Million) Forecast, by Application 2019 & 2032
- Table 34: United Kingdom Vinyl Chloride Monomer Industry Volume (Million) Forecast, by Application 2019 & 2032
- Table 35: France Vinyl Chloride Monomer Industry Revenue (Million) Forecast, by Application 2019 & 2032
- Table 36: France Vinyl Chloride Monomer Industry Volume (Million) Forecast, by Application 2019 & 2032
- Table 37: Italy Vinyl Chloride Monomer Industry Revenue (Million) Forecast, by Application 2019 & 2032
- Table 38: Italy Vinyl Chloride Monomer Industry Volume (Million) Forecast, by Application 2019 & 2032
- Table 39: Rest of Europe Vinyl Chloride Monomer Industry Revenue (Million) Forecast, by Application 2019 & 2032
- Table 40: Rest of Europe Vinyl Chloride Monomer Industry Volume (Million) Forecast, by Application 2019 & 2032
- Table 41: Global Vinyl Chloride Monomer Industry Revenue Million Forecast, by Country 2019 & 2032
- Table 42: Global Vinyl Chloride Monomer Industry Volume Million Forecast, by Country 2019 & 2032
- Table 43: Brazil Vinyl Chloride Monomer Industry Revenue (Million) Forecast, by Application 2019 & 2032
- Table 44: Brazil Vinyl Chloride Monomer Industry Volume (Million) Forecast, by Application 2019 & 2032
- Table 45: Argentina Vinyl Chloride Monomer Industry Revenue (Million) Forecast, by Application 2019 & 2032
- Table 46: Argentina Vinyl Chloride Monomer Industry Volume (Million) Forecast, by Application 2019 & 2032
- Table 47: Rest of South America Vinyl Chloride Monomer Industry Revenue (Million) Forecast, by Application 2019 & 2032
- Table 48: Rest of South America Vinyl Chloride Monomer Industry Volume (Million) Forecast, by Application 2019 & 2032
- Table 49: Global Vinyl Chloride Monomer Industry Revenue Million Forecast, by Country 2019 & 2032
- Table 50: Global Vinyl Chloride Monomer Industry Volume Million Forecast, by Country 2019 & 2032
- Table 51: Saudi Arabia Vinyl Chloride Monomer Industry Revenue (Million) Forecast, by Application 2019 & 2032
- Table 52: Saudi Arabia Vinyl Chloride Monomer Industry Volume (Million) Forecast, by Application 2019 & 2032
- Table 53: South Africa Vinyl Chloride Monomer Industry Revenue (Million) Forecast, by Application 2019 & 2032
- Table 54: South Africa Vinyl Chloride Monomer Industry Volume (Million) Forecast, by Application 2019 & 2032
- Table 55: Rest of Middle East and Africa Vinyl Chloride Monomer Industry Revenue (Million) Forecast, by Application 2019 & 2032
- Table 56: Rest of Middle East and Africa Vinyl Chloride Monomer Industry Volume (Million) Forecast, by Application 2019 & 2032
- Table 57: Global Vinyl Chloride Monomer Industry Revenue Million Forecast, by Application 2019 & 2032
- Table 58: Global Vinyl Chloride Monomer Industry Volume Million Forecast, by Application 2019 & 2032
- Table 59: Global Vinyl Chloride Monomer Industry Revenue Million Forecast, by End-user Industry 2019 & 2032
- Table 60: Global Vinyl Chloride Monomer Industry Volume Million Forecast, by End-user Industry 2019 & 2032
- Table 61: Global Vinyl Chloride Monomer Industry Revenue Million Forecast, by Country 2019 & 2032
- Table 62: Global Vinyl Chloride Monomer Industry Volume Million Forecast, by Country 2019 & 2032
- Table 63: China Vinyl Chloride Monomer Industry Revenue (Million) Forecast, by Application 2019 & 2032
- Table 64: China Vinyl Chloride Monomer Industry Volume (Million) Forecast, by Application 2019 & 2032
- Table 65: India Vinyl Chloride Monomer Industry Revenue (Million) Forecast, by Application 2019 & 2032
- Table 66: India Vinyl Chloride Monomer Industry Volume (Million) Forecast, by Application 2019 & 2032
- Table 67: Japan Vinyl Chloride Monomer Industry Revenue (Million) Forecast, by Application 2019 & 2032
- Table 68: Japan Vinyl Chloride Monomer Industry Volume (Million) Forecast, by Application 2019 & 2032
- Table 69: South Korea Vinyl Chloride Monomer Industry Revenue (Million) Forecast, by Application 2019 & 2032
- Table 70: South Korea Vinyl Chloride Monomer Industry Volume (Million) Forecast, by Application 2019 & 2032
- Table 71: Rest of Asia Pacific Vinyl Chloride Monomer Industry Revenue (Million) Forecast, by Application 2019 & 2032
- Table 72: Rest of Asia Pacific Vinyl Chloride Monomer Industry Volume (Million) Forecast, by Application 2019 & 2032
- Table 73: Global Vinyl Chloride Monomer Industry Revenue Million Forecast, by Application 2019 & 2032
- Table 74: Global Vinyl Chloride Monomer Industry Volume Million Forecast, by Application 2019 & 2032
- Table 75: Global Vinyl Chloride Monomer Industry Revenue Million Forecast, by End-user Industry 2019 & 2032
- Table 76: Global Vinyl Chloride Monomer Industry Volume Million Forecast, by End-user Industry 2019 & 2032
- Table 77: Global Vinyl Chloride Monomer Industry Revenue Million Forecast, by Country 2019 & 2032
- Table 78: Global Vinyl Chloride Monomer Industry Volume Million Forecast, by Country 2019 & 2032
- Table 79: United States Vinyl Chloride Monomer Industry Revenue (Million) Forecast, by Application 2019 & 2032
- Table 80: United States Vinyl Chloride Monomer Industry Volume (Million) Forecast, by Application 2019 & 2032
- Table 81: Canada Vinyl Chloride Monomer Industry Revenue (Million) Forecast, by Application 2019 & 2032
- Table 82: Canada Vinyl Chloride Monomer Industry Volume (Million) Forecast, by Application 2019 & 2032
- Table 83: Mexico Vinyl Chloride Monomer Industry Revenue (Million) Forecast, by Application 2019 & 2032
- Table 84: Mexico Vinyl Chloride Monomer Industry Volume (Million) Forecast, by Application 2019 & 2032
- Table 85: Global Vinyl Chloride Monomer Industry Revenue Million Forecast, by Application 2019 & 2032
- Table 86: Global Vinyl Chloride Monomer Industry Volume Million Forecast, by Application 2019 & 2032
- Table 87: Global Vinyl Chloride Monomer Industry Revenue Million Forecast, by End-user Industry 2019 & 2032
- Table 88: Global Vinyl Chloride Monomer Industry Volume Million Forecast, by End-user Industry 2019 & 2032
- Table 89: Global Vinyl Chloride Monomer Industry Revenue Million Forecast, by Country 2019 & 2032
- Table 90: Global Vinyl Chloride Monomer Industry Volume Million Forecast, by Country 2019 & 2032
- Table 91: Germany Vinyl Chloride Monomer Industry Revenue (Million) Forecast, by Application 2019 & 2032
- Table 92: Germany Vinyl Chloride Monomer Industry Volume (Million) Forecast, by Application 2019 & 2032
- Table 93: United Kingdom Vinyl Chloride Monomer Industry Revenue (Million) Forecast, by Application 2019 & 2032
- Table 94: United Kingdom Vinyl Chloride Monomer Industry Volume (Million) Forecast, by Application 2019 & 2032
- Table 95: France Vinyl Chloride Monomer Industry Revenue (Million) Forecast, by Application 2019 & 2032
- Table 96: France Vinyl Chloride Monomer Industry Volume (Million) Forecast, by Application 2019 & 2032
- Table 97: Italy Vinyl Chloride Monomer Industry Revenue (Million) Forecast, by Application 2019 & 2032
- Table 98: Italy Vinyl Chloride Monomer Industry Volume (Million) Forecast, by Application 2019 & 2032
- Table 99: Rest of Europe Vinyl Chloride Monomer Industry Revenue (Million) Forecast, by Application 2019 & 2032
- Table 100: Rest of Europe Vinyl Chloride Monomer Industry Volume (Million) Forecast, by Application 2019 & 2032
- Table 101: Global Vinyl Chloride Monomer Industry Revenue Million Forecast, by Application 2019 & 2032
- Table 102: Global Vinyl Chloride Monomer Industry Volume Million Forecast, by Application 2019 & 2032
- Table 103: Global Vinyl Chloride Monomer Industry Revenue Million Forecast, by End-user Industry 2019 & 2032
- Table 104: Global Vinyl Chloride Monomer Industry Volume Million Forecast, by End-user Industry 2019 & 2032
- Table 105: Global Vinyl Chloride Monomer Industry Revenue Million Forecast, by Country 2019 & 2032
- Table 106: Global Vinyl Chloride Monomer Industry Volume Million Forecast, by Country 2019 & 2032
- Table 107: Brazil Vinyl Chloride Monomer Industry Revenue (Million) Forecast, by Application 2019 & 2032
- Table 108: Brazil Vinyl Chloride Monomer Industry Volume (Million) Forecast, by Application 2019 & 2032
- Table 109: Argentina Vinyl Chloride Monomer Industry Revenue (Million) Forecast, by Application 2019 & 2032
- Table 110: Argentina Vinyl Chloride Monomer Industry Volume (Million) Forecast, by Application 2019 & 2032
- Table 111: Rest of South America Vinyl Chloride Monomer Industry Revenue (Million) Forecast, by Application 2019 & 2032
- Table 112: Rest of South America Vinyl Chloride Monomer Industry Volume (Million) Forecast, by Application 2019 & 2032
- Table 113: Global Vinyl Chloride Monomer Industry Revenue Million Forecast, by Application 2019 & 2032
- Table 114: Global Vinyl Chloride Monomer Industry Volume Million Forecast, by Application 2019 & 2032
- Table 115: Global Vinyl Chloride Monomer Industry Revenue Million Forecast, by End-user Industry 2019 & 2032
- Table 116: Global Vinyl Chloride Monomer Industry Volume Million Forecast, by End-user Industry 2019 & 2032
- Table 117: Global Vinyl Chloride Monomer Industry Revenue Million Forecast, by Country 2019 & 2032
- Table 118: Global Vinyl Chloride Monomer Industry Volume Million Forecast, by Country 2019 & 2032
- Table 119: Saudi Arabia Vinyl Chloride Monomer Industry Revenue (Million) Forecast, by Application 2019 & 2032
- Table 120: Saudi Arabia Vinyl Chloride Monomer Industry Volume (Million) Forecast, by Application 2019 & 2032
- Table 121: South Africa Vinyl Chloride Monomer Industry Revenue (Million) Forecast, by Application 2019 & 2032
- Table 122: South Africa Vinyl Chloride Monomer Industry Volume (Million) Forecast, by Application 2019 & 2032
- Table 123: Rest of Middle East and Africa Vinyl Chloride Monomer Industry Revenue (Million) Forecast, by Application 2019 & 2032
- Table 124: Rest of Middle East and Africa Vinyl Chloride Monomer Industry Volume (Million) Forecast, by Application 2019 & 2032
Frequently Asked Questions
1. What is the projected Compound Annual Growth Rate (CAGR) of the Vinyl Chloride Monomer Industry?
The projected CAGR is approximately 3.87%.
2. Which companies are prominent players in the Vinyl Chloride Monomer Industry?
Key companies in the market include Occidental Petroleum Corporation, Vinnolit GmbH & Co KG, AGC Chemicals, Ercros S A, The Chemson Group, Westlake Chemical Corporation*List Not Exhaustive, Olin Corporation, Reliance Industries Limited, Vynova Group, Tosoh Corporation, NOVA Chemicals, Dow, Mexichem, The Axiall Corporation, Shin-Etsu PVC B V.
3. What are the main segments of the Vinyl Chloride Monomer Industry?
The market segments include Application, End-user Industry .
4. Can you provide details about the market size?
The market size is estimated to be USD XX Million as of 2022.
5. What are some drivers contributing to market growth?
Rising Demand in Healthcare Sector; High Consumption from Building and Construction Industry.
6. What are the notable trends driving market growth?
Building and Construction Sector to Boost Market.
7. Are there any restraints impacting market growth?
Increasing Environmental Concerns and Availability of Substitutes in Various Applications; Other Restraints.
8. Can you provide examples of recent developments in the market?
April 2023: AGC developed Process Digital Twin for chemical plants and to begin the operation at its Vinyl Chloride Monomer manufacturing plant in Indonesia.
9. What pricing options are available for accessing the report?
Pricing options include single-user, multi-user, and enterprise licenses priced at USD 4750, USD 5250, and USD 8750 respectively.
10. Is the market size provided in terms of value or volume?
The market size is provided in terms of value, measured in Million and volume, measured in Million.
11. Are there any specific market keywords associated with the report?
Yes, the market keyword associated with the report is "Vinyl Chloride Monomer Industry," which aids in identifying and referencing the specific market segment covered.
12. How do I determine which pricing option suits my needs best?
The pricing options vary based on user requirements and access needs. Individual users may opt for single-user licenses, while businesses requiring broader access may choose multi-user or enterprise licenses for cost-effective access to the report.
13. Are there any additional resources or data provided in the Vinyl Chloride Monomer Industry report?
While the report offers comprehensive insights, it's advisable to review the specific contents or supplementary materials provided to ascertain if additional resources or data are available.
14. How can I stay updated on further developments or reports in the Vinyl Chloride Monomer Industry?
To stay informed about further developments, trends, and reports in the Vinyl Chloride Monomer Industry, consider subscribing to industry newsletters, following relevant companies and organizations, or regularly checking reputable industry news sources and publications.
Methodology
Step 1 - Identification of Relevant Samples Size from Population Database


Step 2 - Approaches for Defining Global Market Size (Value, Volume* & Price*)

Note*: In applicable scenarios
Step 3 - Data Sources
Primary Research
- Web Analytics
- Survey Reports
- Research Institute
- Latest Research Reports
- Opinion Leaders
Secondary Research
- Annual Reports
- White Paper
- Latest Press Release
- Industry Association
- Paid Database
- Investor Presentations

Step 4 - Data Triangulation
Involves using different sources of information in order to increase the validity of a study
These sources are likely to be stakeholders in a program - participants, other researchers, program staff, other community members, and so on.
Then we put all data in single framework & apply various statistical tools to find out the dynamic on the market.
During the analysis stage, feedback from the stakeholder groups would be compared to determine areas of agreement as well as areas of divergence


