
Key Insights
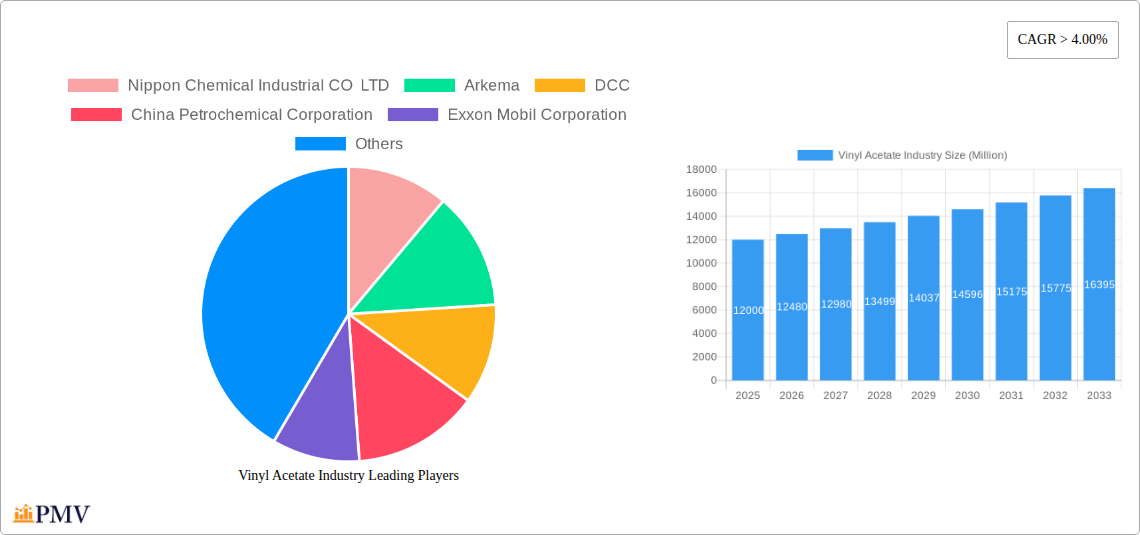
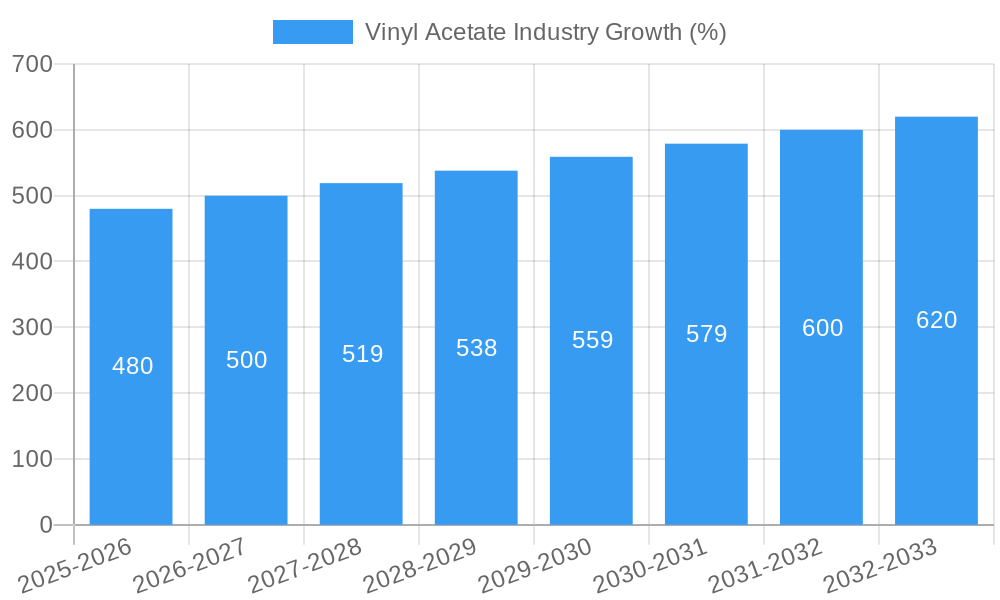
The global vinyl acetate monomer (VAM) market is experiencing robust growth, driven by increasing demand across diverse end-use industries. A compound annual growth rate (CAGR) exceeding 4% indicates a consistently expanding market, projected to reach significant value over the forecast period (2025-2033). Key drivers include the burgeoning solar energy sector, the automotive industry's reliance on VAM-derived adhesives and coatings, and continued growth in building and construction activities globally. The increasing adoption of sustainable building materials and eco-friendly packaging solutions further fuels market expansion. While supply chain disruptions and fluctuating raw material prices pose potential restraints, technological advancements in VAM production are mitigating these challenges, enhancing efficiency and reducing environmental impact. Segmentation analysis reveals that Polyvinyl Acetate (PVAc) holds a significant market share within applications, driven by its widespread use in adhesives and paints. The automotive and building & construction segments are major end-user contributors to market volume, highlighting the industry's reliance on these sectors for continued growth. Leading players like Nippon Chemical Industrial, Arkema, and ExxonMobil are strategically positioned to capitalize on this growth trajectory, investing in research and development, capacity expansion, and geographic diversification.
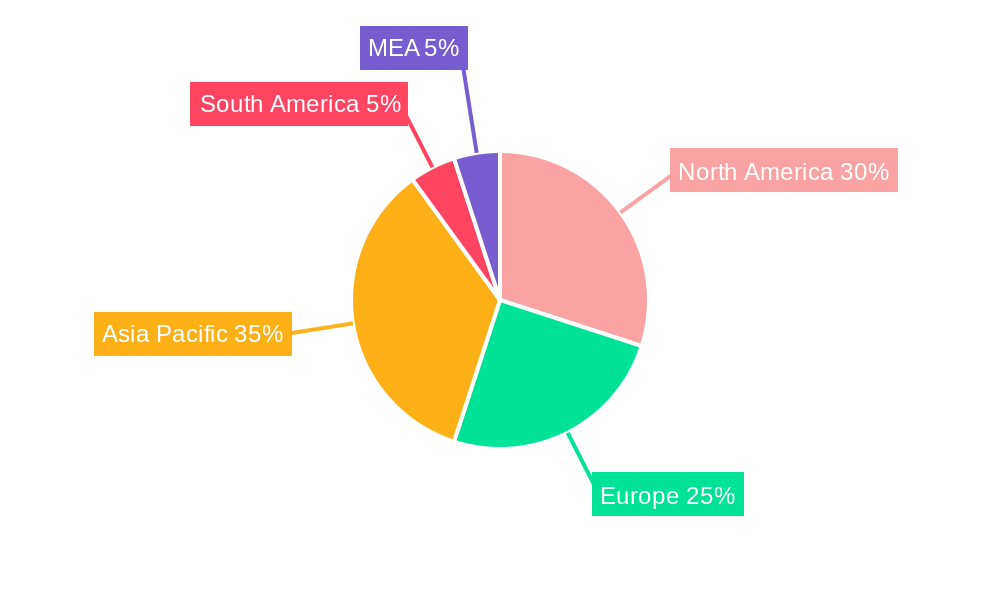
The market's regional landscape shows significant presence across North America, Europe, and Asia-Pacific, with China and the United States emerging as key contributors due to substantial industrial activity and manufacturing hubs. However, emerging economies in Asia-Pacific and South America offer considerable growth potential, driven by infrastructure development and rising disposable incomes. The market is expected to witness increased competition, driven by both established players and new entrants, leading to price stabilization and the development of innovative VAM-based products to cater to niche applications. This competition, along with evolving consumer preferences towards eco-friendly products, will shape the future trajectory of the VAM market, fostering innovation and sustainable practices within the industry. Detailed market segmentation and regional analysis will help companies develop effective market entry and penetration strategies.
Vinyl Acetate Industry: A Comprehensive Market Report (2019-2033)
This in-depth report provides a comprehensive analysis of the global vinyl acetate industry, encompassing market structure, competitive dynamics, industry trends, and future growth projections from 2019 to 2033. With a focus on key players like Nippon Chemical Industrial CO LTD, Arkema, DCC, China Petrochemical Corporation, Exxon Mobil Corporation, INEOS, Celanese Corporation, Kemipex, LyondellBasell Industries Holdings B V, CLARIANT, Sipchem Company, Wacker Chemie AG, and Innospec, this report offers actionable insights for businesses operating within this dynamic sector. The report utilizes data from the historical period (2019-2024), the base year (2025), and the forecast period (2025-2033), with an estimated year of 2025. The report segments the market by application (Polyvinyl Acetate, Polyvinyl Alcohol, Ethylene Vinyl Acetate (EVA), Other Applications) and end-user industry (Solar, Automotive, Building and Construction, Packaging, Textile, Other End-user Industries).
Vinyl Acetate Industry Market Structure & Competitive Dynamics
The global vinyl acetate market is characterized by a moderately concentrated structure, with several major players holding significant market share. Competition is fierce, driven by technological innovation, price fluctuations in raw materials (e.g., ethylene and acetic acid), and varying regional demand patterns. The industry is subject to stringent environmental regulations, impacting production processes and operational costs. Product substitution is limited due to the unique properties of vinyl acetate and its derivatives. Consolidation through mergers and acquisitions (M&A) is observed, with deal values exceeding xx Million in recent years, reflecting the industry’s quest for economies of scale and expansion into new markets. Market share data for 2024 indicates that the top five players collectively hold approximately xx% of the global market, while the remaining share is distributed among numerous smaller players. Key competitive dynamics include:
- Market Concentration: Moderate concentration with several dominant players.
- Innovation Ecosystems: Significant investments in R&D to improve product performance and efficiency.
- Regulatory Frameworks: Stringent environmental regulations impacting production costs and processes.
- Product Substitutes: Limited due to the unique properties of vinyl acetate.
- End-User Trends: Growing demand from key sectors such as building and construction, and packaging drives market growth.
- M&A Activities: Significant M&A activity observed, with deal values exceeding xx Million in recent years.
Vinyl Acetate Industry Industry Trends & Insights
The vinyl acetate industry is experiencing steady growth, driven by increasing demand from diverse end-use sectors. The Compound Annual Growth Rate (CAGR) during the forecast period (2025-2033) is projected to be xx%. Key market growth drivers include the expanding construction sector globally, the rise of the solar energy industry, and the automotive sector's increasing use of vinyl acetate-based materials. Technological advancements focus on improving production efficiency, reducing environmental impact, and developing new applications. Consumer preferences increasingly favor eco-friendly products, pushing manufacturers to adopt sustainable production methods. The market penetration of vinyl acetate-based materials in various sectors is expected to continue increasing, driven by its superior properties and cost-effectiveness. Competitive dynamics are influenced by pricing strategies, technological innovation, and geographical diversification. The market witnesses both organic and inorganic growth strategies being employed by various companies.
Dominant Markets & Segments in Vinyl Acetate Industry
The Asia-Pacific region dominates the global vinyl acetate market, driven by robust growth in the building and construction sector, rapidly expanding automotive industry, and increasing demand for packaging materials. China and India are key contributors to this regional dominance.
Key Drivers of Regional Dominance:
- Rapid Industrialization: Significant infrastructure development and industrial expansion.
- Growing Population: Increased demand for housing, transportation, and consumer goods.
- Favorable Government Policies: Initiatives supporting industrial growth and infrastructure development.
- Increasing Disposable Income: Growing purchasing power fueling consumption of consumer goods.
Dominant Segments:
- Application: Polyvinyl Acetate (PVA) holds the largest market share due to its widespread applications in adhesives, paints, and coatings. Ethylene Vinyl Acetate (EVA) is a significant segment, driven by its use in solar films and automotive parts.
- End-user Industry: The building and construction sector constitutes the largest end-user segment, followed by the packaging and automotive industries. Demand from the solar industry is rapidly growing.
Vinyl Acetate Industry Product Innovations
Recent product innovations focus on enhancing the performance characteristics of vinyl acetate-based materials, improving their durability, sustainability, and compatibility with various applications. The development of advanced formulations with enhanced adhesion properties, UV resistance, and water resistance is a key area of focus. These innovations cater to the growing demand for high-performance materials in specialized applications. The industry is witnessing significant advancement in production processes aimed at increasing efficiency, lowering environmental footprint and reducing waste generation.
Report Segmentation & Scope
This report segments the vinyl acetate market based on application (Polyvinyl Acetate, Polyvinyl Alcohol, Ethylene Vinyl Acetate (EVA), and Other Applications) and end-user industry (Solar, Automotive, Building and Construction, Packaging, Textile, and Other End-user Industries). Each segment’s growth projection, market size, and competitive dynamics are analyzed in detail. The forecast period is 2025-2033.
Key Drivers of Vinyl Acetate Industry Growth
The vinyl acetate industry's growth is driven by several factors, including:
- Expanding Construction Sector: Global infrastructure development fuels demand for adhesives, paints, and coatings.
- Growth of the Solar Energy Industry: Increasing adoption of solar energy technologies boosts demand for EVA films.
- Automotive Industry Expansion: Use of vinyl acetate-based materials in automotive interiors and components is growing.
- Technological Advancements: Innovations enhance product performance and open new application opportunities.
Challenges in the Vinyl Acetate Industry Sector
The vinyl acetate industry faces challenges such as:
- Fluctuations in Raw Material Prices: Ethylene and acetic acid price volatility impacts production costs.
- Stringent Environmental Regulations: Compliance with emission standards increases operational expenses.
- Intense Competition: Pressure from established players and new entrants impacts pricing and profitability.
Leading Players in the Vinyl Acetate Industry Market
- Nippon Chemical Industrial CO LTD
- Arkema
- DCC
- China Petrochemical Corporation
- Exxon Mobil Corporation
- INEOS
- Celanese Corporation
- Kemipex
- LyondellBasell Industries Holdings B V
- CLARIANT
- Sipchem Company
- Wacker Chemie AG
- Innospec
Key Developments in Vinyl Acetate Industry Sector
February 2023: Celanese Corporation announced the completion of an ultra-low capital initiative to repurpose existing manufacturing and infrastructure assets to enable extra ethylene vinyl acetate (EVA) capacity at its Edmonton, Alberta site. This expansion significantly bolsters Celanese's position in the EVA market and enhances its downstream vinyl offerings.
December 2022: Showa Denko K.K. licensed its VAM production technology to Asian Paints Limited, in partnership with KBR. This agreement provides Asian Paints with access to advanced VAM production capabilities and ensures a stable supply of catalysts, strengthening its position in the paints and coatings market and potentially increasing market demand for VAM.
Strategic Vinyl Acetate Industry Market Outlook
The vinyl acetate industry is poised for continued growth, driven by expansion in key end-use sectors and technological advancements. Strategic opportunities exist in developing sustainable and high-performance materials, focusing on niche applications, and expanding into emerging markets. Companies that successfully navigate the challenges of raw material price volatility, environmental regulations, and intense competition will be best positioned to capture the significant market potential in the years to come.
Vinyl Acetate Industry Segmentation
-
1. Application
- 1.1. Polyvinyl Acetate
- 1.2. Polyvinyl Alcohol
- 1.3. Ethylene Vinyl Acetate (EVA)
- 1.4. Other Applications
-
2. End-user Industry
- 2.1. Solar
- 2.2. Automotive
- 2.3. Building and Construction
- 2.4. Packaging
- 2.5. Textile
- 2.6. Other End-user Industries
Vinyl Acetate Industry Segmentation By Geography
-
1. Asia Pacific
- 1.1. China
- 1.2. India
- 1.3. Japan
- 1.4. South Korea
- 1.5. Rest of Asia Pacific
-
2. North America
- 2.1. United States
- 2.2. Canada
- 2.3. Mexico
-
3. Europe
- 3.1. Germany
- 3.2. United Kingdom
- 3.3. Italy
- 3.4. Russia
- 3.5. France
- 3.6. Rest of Europe
-
4. South America
- 4.1. Brazil
- 4.2. Argentina
- 4.3. Rest of South America
-
5. Middle East and Africa
- 5.1. Saudi Arabia
- 5.2. South Africa
- 5.3. Rest of Middle East and Africa
Vinyl Acetate Industry REPORT HIGHLIGHTS
| Aspects | Details |
|---|---|
| Study Period | 2019-2033 |
| Base Year | 2024 |
| Estimated Year | 2025 |
| Forecast Period | 2025-2033 |
| Historical Period | 2019-2024 |
| Growth Rate | CAGR of > 4.00% from 2019-2033 |
| Segmentation |
|
Table of Contents
- 1. Introduction
- 1.1. Research Scope
- 1.2. Market Segmentation
- 1.3. Research Methodology
- 1.4. Definitions and Assumptions
- 2. Executive Summary
- 2.1. Introduction
- 3. Market Dynamics
- 3.1. Introduction
- 3.2. Market Drivers
- 3.2.1. Increased Use of Adhesives in Food Packaging; Increasing Use in the Solar Power Generation Industry
- 3.3. Market Restrains
- 3.3.1. Stringent Health and Environmental Regulations; Other Restraints
- 3.4. Market Trends
- 3.4.1. Increasing Demand from the Solar Industry
- 4. Market Factor Analysis
- 4.1. Porters Five Forces
- 4.2. Supply/Value Chain
- 4.3. PESTEL analysis
- 4.4. Market Entropy
- 4.5. Patent/Trademark Analysis
- 5. Global Vinyl Acetate Industry Analysis, Insights and Forecast, 2019-2031
- 5.1. Market Analysis, Insights and Forecast - by Application
- 5.1.1. Polyvinyl Acetate
- 5.1.2. Polyvinyl Alcohol
- 5.1.3. Ethylene Vinyl Acetate (EVA)
- 5.1.4. Other Applications
- 5.2. Market Analysis, Insights and Forecast - by End-user Industry
- 5.2.1. Solar
- 5.2.2. Automotive
- 5.2.3. Building and Construction
- 5.2.4. Packaging
- 5.2.5. Textile
- 5.2.6. Other End-user Industries
- 5.3. Market Analysis, Insights and Forecast - by Region
- 5.3.1. Asia Pacific
- 5.3.2. North America
- 5.3.3. Europe
- 5.3.4. South America
- 5.3.5. Middle East and Africa
- 5.1. Market Analysis, Insights and Forecast - by Application
- 6. Asia Pacific Vinyl Acetate Industry Analysis, Insights and Forecast, 2019-2031
- 6.1. Market Analysis, Insights and Forecast - by Application
- 6.1.1. Polyvinyl Acetate
- 6.1.2. Polyvinyl Alcohol
- 6.1.3. Ethylene Vinyl Acetate (EVA)
- 6.1.4. Other Applications
- 6.2. Market Analysis, Insights and Forecast - by End-user Industry
- 6.2.1. Solar
- 6.2.2. Automotive
- 6.2.3. Building and Construction
- 6.2.4. Packaging
- 6.2.5. Textile
- 6.2.6. Other End-user Industries
- 6.1. Market Analysis, Insights and Forecast - by Application
- 7. North America Vinyl Acetate Industry Analysis, Insights and Forecast, 2019-2031
- 7.1. Market Analysis, Insights and Forecast - by Application
- 7.1.1. Polyvinyl Acetate
- 7.1.2. Polyvinyl Alcohol
- 7.1.3. Ethylene Vinyl Acetate (EVA)
- 7.1.4. Other Applications
- 7.2. Market Analysis, Insights and Forecast - by End-user Industry
- 7.2.1. Solar
- 7.2.2. Automotive
- 7.2.3. Building and Construction
- 7.2.4. Packaging
- 7.2.5. Textile
- 7.2.6. Other End-user Industries
- 7.1. Market Analysis, Insights and Forecast - by Application
- 8. Europe Vinyl Acetate Industry Analysis, Insights and Forecast, 2019-2031
- 8.1. Market Analysis, Insights and Forecast - by Application
- 8.1.1. Polyvinyl Acetate
- 8.1.2. Polyvinyl Alcohol
- 8.1.3. Ethylene Vinyl Acetate (EVA)
- 8.1.4. Other Applications
- 8.2. Market Analysis, Insights and Forecast - by End-user Industry
- 8.2.1. Solar
- 8.2.2. Automotive
- 8.2.3. Building and Construction
- 8.2.4. Packaging
- 8.2.5. Textile
- 8.2.6. Other End-user Industries
- 8.1. Market Analysis, Insights and Forecast - by Application
- 9. South America Vinyl Acetate Industry Analysis, Insights and Forecast, 2019-2031
- 9.1. Market Analysis, Insights and Forecast - by Application
- 9.1.1. Polyvinyl Acetate
- 9.1.2. Polyvinyl Alcohol
- 9.1.3. Ethylene Vinyl Acetate (EVA)
- 9.1.4. Other Applications
- 9.2. Market Analysis, Insights and Forecast - by End-user Industry
- 9.2.1. Solar
- 9.2.2. Automotive
- 9.2.3. Building and Construction
- 9.2.4. Packaging
- 9.2.5. Textile
- 9.2.6. Other End-user Industries
- 9.1. Market Analysis, Insights and Forecast - by Application
- 10. Middle East and Africa Vinyl Acetate Industry Analysis, Insights and Forecast, 2019-2031
- 10.1. Market Analysis, Insights and Forecast - by Application
- 10.1.1. Polyvinyl Acetate
- 10.1.2. Polyvinyl Alcohol
- 10.1.3. Ethylene Vinyl Acetate (EVA)
- 10.1.4. Other Applications
- 10.2. Market Analysis, Insights and Forecast - by End-user Industry
- 10.2.1. Solar
- 10.2.2. Automotive
- 10.2.3. Building and Construction
- 10.2.4. Packaging
- 10.2.5. Textile
- 10.2.6. Other End-user Industries
- 10.1. Market Analysis, Insights and Forecast - by Application
- 11. North America Vinyl Acetate Industry Analysis, Insights and Forecast, 2019-2031
- 11.1. Market Analysis, Insights and Forecast - By Country/Sub-region
- 11.1.1 United States
- 11.1.2 Canada
- 11.1.3 Mexico
- 12. Europe Vinyl Acetate Industry Analysis, Insights and Forecast, 2019-2031
- 12.1. Market Analysis, Insights and Forecast - By Country/Sub-region
- 12.1.1 Germany
- 12.1.2 France
- 12.1.3 Italy
- 12.1.4 United Kingdom
- 12.1.5 Netherlands
- 12.1.6 Rest of Europe
- 13. Asia Pacific Vinyl Acetate Industry Analysis, Insights and Forecast, 2019-2031
- 13.1. Market Analysis, Insights and Forecast - By Country/Sub-region
- 13.1.1 China
- 13.1.2 Japan
- 13.1.3 India
- 13.1.4 South Korea
- 13.1.5 Taiwan
- 13.1.6 Australia
- 13.1.7 Rest of Asia-Pacific
- 14. South America Vinyl Acetate Industry Analysis, Insights and Forecast, 2019-2031
- 14.1. Market Analysis, Insights and Forecast - By Country/Sub-region
- 14.1.1 Brazil
- 14.1.2 Argentina
- 14.1.3 Rest of South America
- 15. MEA Vinyl Acetate Industry Analysis, Insights and Forecast, 2019-2031
- 15.1. Market Analysis, Insights and Forecast - By Country/Sub-region
- 15.1.1 Middle East
- 15.1.2 Africa
- 16. Competitive Analysis
- 16.1. Global Market Share Analysis 2024
- 16.2. Company Profiles
- 16.2.1 Nippon Chemical Industrial CO LTD
- 16.2.1.1. Overview
- 16.2.1.2. Products
- 16.2.1.3. SWOT Analysis
- 16.2.1.4. Recent Developments
- 16.2.1.5. Financials (Based on Availability)
- 16.2.2 Arkema
- 16.2.2.1. Overview
- 16.2.2.2. Products
- 16.2.2.3. SWOT Analysis
- 16.2.2.4. Recent Developments
- 16.2.2.5. Financials (Based on Availability)
- 16.2.3 DCC
- 16.2.3.1. Overview
- 16.2.3.2. Products
- 16.2.3.3. SWOT Analysis
- 16.2.3.4. Recent Developments
- 16.2.3.5. Financials (Based on Availability)
- 16.2.4 China Petrochemical Corporation
- 16.2.4.1. Overview
- 16.2.4.2. Products
- 16.2.4.3. SWOT Analysis
- 16.2.4.4. Recent Developments
- 16.2.4.5. Financials (Based on Availability)
- 16.2.5 Exxon Mobil Corporation
- 16.2.5.1. Overview
- 16.2.5.2. Products
- 16.2.5.3. SWOT Analysis
- 16.2.5.4. Recent Developments
- 16.2.5.5. Financials (Based on Availability)
- 16.2.6 INEOS
- 16.2.6.1. Overview
- 16.2.6.2. Products
- 16.2.6.3. SWOT Analysis
- 16.2.6.4. Recent Developments
- 16.2.6.5. Financials (Based on Availability)
- 16.2.7 Celanese Corporation
- 16.2.7.1. Overview
- 16.2.7.2. Products
- 16.2.7.3. SWOT Analysis
- 16.2.7.4. Recent Developments
- 16.2.7.5. Financials (Based on Availability)
- 16.2.8 Kemipex
- 16.2.8.1. Overview
- 16.2.8.2. Products
- 16.2.8.3. SWOT Analysis
- 16.2.8.4. Recent Developments
- 16.2.8.5. Financials (Based on Availability)
- 16.2.9 LyondellBasell Industries Holdings B V
- 16.2.9.1. Overview
- 16.2.9.2. Products
- 16.2.9.3. SWOT Analysis
- 16.2.9.4. Recent Developments
- 16.2.9.5. Financials (Based on Availability)
- 16.2.10 CLARIANT
- 16.2.10.1. Overview
- 16.2.10.2. Products
- 16.2.10.3. SWOT Analysis
- 16.2.10.4. Recent Developments
- 16.2.10.5. Financials (Based on Availability)
- 16.2.11 Sipchem Company
- 16.2.11.1. Overview
- 16.2.11.2. Products
- 16.2.11.3. SWOT Analysis
- 16.2.11.4. Recent Developments
- 16.2.11.5. Financials (Based on Availability)
- 16.2.12 Wacker Chemie AG
- 16.2.12.1. Overview
- 16.2.12.2. Products
- 16.2.12.3. SWOT Analysis
- 16.2.12.4. Recent Developments
- 16.2.12.5. Financials (Based on Availability)
- 16.2.13 Innospec
- 16.2.13.1. Overview
- 16.2.13.2. Products
- 16.2.13.3. SWOT Analysis
- 16.2.13.4. Recent Developments
- 16.2.13.5. Financials (Based on Availability)
- 16.2.1 Nippon Chemical Industrial CO LTD
List of Figures
- Figure 1: Global Vinyl Acetate Industry Revenue Breakdown (Million, %) by Region 2024 & 2032
- Figure 2: Global Vinyl Acetate Industry Volume Breakdown (K Tons, %) by Region 2024 & 2032
- Figure 3: North America Vinyl Acetate Industry Revenue (Million), by Country 2024 & 2032
- Figure 4: North America Vinyl Acetate Industry Volume (K Tons), by Country 2024 & 2032
- Figure 5: North America Vinyl Acetate Industry Revenue Share (%), by Country 2024 & 2032
- Figure 6: North America Vinyl Acetate Industry Volume Share (%), by Country 2024 & 2032
- Figure 7: Europe Vinyl Acetate Industry Revenue (Million), by Country 2024 & 2032
- Figure 8: Europe Vinyl Acetate Industry Volume (K Tons), by Country 2024 & 2032
- Figure 9: Europe Vinyl Acetate Industry Revenue Share (%), by Country 2024 & 2032
- Figure 10: Europe Vinyl Acetate Industry Volume Share (%), by Country 2024 & 2032
- Figure 11: Asia Pacific Vinyl Acetate Industry Revenue (Million), by Country 2024 & 2032
- Figure 12: Asia Pacific Vinyl Acetate Industry Volume (K Tons), by Country 2024 & 2032
- Figure 13: Asia Pacific Vinyl Acetate Industry Revenue Share (%), by Country 2024 & 2032
- Figure 14: Asia Pacific Vinyl Acetate Industry Volume Share (%), by Country 2024 & 2032
- Figure 15: South America Vinyl Acetate Industry Revenue (Million), by Country 2024 & 2032
- Figure 16: South America Vinyl Acetate Industry Volume (K Tons), by Country 2024 & 2032
- Figure 17: South America Vinyl Acetate Industry Revenue Share (%), by Country 2024 & 2032
- Figure 18: South America Vinyl Acetate Industry Volume Share (%), by Country 2024 & 2032
- Figure 19: MEA Vinyl Acetate Industry Revenue (Million), by Country 2024 & 2032
- Figure 20: MEA Vinyl Acetate Industry Volume (K Tons), by Country 2024 & 2032
- Figure 21: MEA Vinyl Acetate Industry Revenue Share (%), by Country 2024 & 2032
- Figure 22: MEA Vinyl Acetate Industry Volume Share (%), by Country 2024 & 2032
- Figure 23: Asia Pacific Vinyl Acetate Industry Revenue (Million), by Application 2024 & 2032
- Figure 24: Asia Pacific Vinyl Acetate Industry Volume (K Tons), by Application 2024 & 2032
- Figure 25: Asia Pacific Vinyl Acetate Industry Revenue Share (%), by Application 2024 & 2032
- Figure 26: Asia Pacific Vinyl Acetate Industry Volume Share (%), by Application 2024 & 2032
- Figure 27: Asia Pacific Vinyl Acetate Industry Revenue (Million), by End-user Industry 2024 & 2032
- Figure 28: Asia Pacific Vinyl Acetate Industry Volume (K Tons), by End-user Industry 2024 & 2032
- Figure 29: Asia Pacific Vinyl Acetate Industry Revenue Share (%), by End-user Industry 2024 & 2032
- Figure 30: Asia Pacific Vinyl Acetate Industry Volume Share (%), by End-user Industry 2024 & 2032
- Figure 31: Asia Pacific Vinyl Acetate Industry Revenue (Million), by Country 2024 & 2032
- Figure 32: Asia Pacific Vinyl Acetate Industry Volume (K Tons), by Country 2024 & 2032
- Figure 33: Asia Pacific Vinyl Acetate Industry Revenue Share (%), by Country 2024 & 2032
- Figure 34: Asia Pacific Vinyl Acetate Industry Volume Share (%), by Country 2024 & 2032
- Figure 35: North America Vinyl Acetate Industry Revenue (Million), by Application 2024 & 2032
- Figure 36: North America Vinyl Acetate Industry Volume (K Tons), by Application 2024 & 2032
- Figure 37: North America Vinyl Acetate Industry Revenue Share (%), by Application 2024 & 2032
- Figure 38: North America Vinyl Acetate Industry Volume Share (%), by Application 2024 & 2032
- Figure 39: North America Vinyl Acetate Industry Revenue (Million), by End-user Industry 2024 & 2032
- Figure 40: North America Vinyl Acetate Industry Volume (K Tons), by End-user Industry 2024 & 2032
- Figure 41: North America Vinyl Acetate Industry Revenue Share (%), by End-user Industry 2024 & 2032
- Figure 42: North America Vinyl Acetate Industry Volume Share (%), by End-user Industry 2024 & 2032
- Figure 43: North America Vinyl Acetate Industry Revenue (Million), by Country 2024 & 2032
- Figure 44: North America Vinyl Acetate Industry Volume (K Tons), by Country 2024 & 2032
- Figure 45: North America Vinyl Acetate Industry Revenue Share (%), by Country 2024 & 2032
- Figure 46: North America Vinyl Acetate Industry Volume Share (%), by Country 2024 & 2032
- Figure 47: Europe Vinyl Acetate Industry Revenue (Million), by Application 2024 & 2032
- Figure 48: Europe Vinyl Acetate Industry Volume (K Tons), by Application 2024 & 2032
- Figure 49: Europe Vinyl Acetate Industry Revenue Share (%), by Application 2024 & 2032
- Figure 50: Europe Vinyl Acetate Industry Volume Share (%), by Application 2024 & 2032
- Figure 51: Europe Vinyl Acetate Industry Revenue (Million), by End-user Industry 2024 & 2032
- Figure 52: Europe Vinyl Acetate Industry Volume (K Tons), by End-user Industry 2024 & 2032
- Figure 53: Europe Vinyl Acetate Industry Revenue Share (%), by End-user Industry 2024 & 2032
- Figure 54: Europe Vinyl Acetate Industry Volume Share (%), by End-user Industry 2024 & 2032
- Figure 55: Europe Vinyl Acetate Industry Revenue (Million), by Country 2024 & 2032
- Figure 56: Europe Vinyl Acetate Industry Volume (K Tons), by Country 2024 & 2032
- Figure 57: Europe Vinyl Acetate Industry Revenue Share (%), by Country 2024 & 2032
- Figure 58: Europe Vinyl Acetate Industry Volume Share (%), by Country 2024 & 2032
- Figure 59: South America Vinyl Acetate Industry Revenue (Million), by Application 2024 & 2032
- Figure 60: South America Vinyl Acetate Industry Volume (K Tons), by Application 2024 & 2032
- Figure 61: South America Vinyl Acetate Industry Revenue Share (%), by Application 2024 & 2032
- Figure 62: South America Vinyl Acetate Industry Volume Share (%), by Application 2024 & 2032
- Figure 63: South America Vinyl Acetate Industry Revenue (Million), by End-user Industry 2024 & 2032
- Figure 64: South America Vinyl Acetate Industry Volume (K Tons), by End-user Industry 2024 & 2032
- Figure 65: South America Vinyl Acetate Industry Revenue Share (%), by End-user Industry 2024 & 2032
- Figure 66: South America Vinyl Acetate Industry Volume Share (%), by End-user Industry 2024 & 2032
- Figure 67: South America Vinyl Acetate Industry Revenue (Million), by Country 2024 & 2032
- Figure 68: South America Vinyl Acetate Industry Volume (K Tons), by Country 2024 & 2032
- Figure 69: South America Vinyl Acetate Industry Revenue Share (%), by Country 2024 & 2032
- Figure 70: South America Vinyl Acetate Industry Volume Share (%), by Country 2024 & 2032
- Figure 71: Middle East and Africa Vinyl Acetate Industry Revenue (Million), by Application 2024 & 2032
- Figure 72: Middle East and Africa Vinyl Acetate Industry Volume (K Tons), by Application 2024 & 2032
- Figure 73: Middle East and Africa Vinyl Acetate Industry Revenue Share (%), by Application 2024 & 2032
- Figure 74: Middle East and Africa Vinyl Acetate Industry Volume Share (%), by Application 2024 & 2032
- Figure 75: Middle East and Africa Vinyl Acetate Industry Revenue (Million), by End-user Industry 2024 & 2032
- Figure 76: Middle East and Africa Vinyl Acetate Industry Volume (K Tons), by End-user Industry 2024 & 2032
- Figure 77: Middle East and Africa Vinyl Acetate Industry Revenue Share (%), by End-user Industry 2024 & 2032
- Figure 78: Middle East and Africa Vinyl Acetate Industry Volume Share (%), by End-user Industry 2024 & 2032
- Figure 79: Middle East and Africa Vinyl Acetate Industry Revenue (Million), by Country 2024 & 2032
- Figure 80: Middle East and Africa Vinyl Acetate Industry Volume (K Tons), by Country 2024 & 2032
- Figure 81: Middle East and Africa Vinyl Acetate Industry Revenue Share (%), by Country 2024 & 2032
- Figure 82: Middle East and Africa Vinyl Acetate Industry Volume Share (%), by Country 2024 & 2032
List of Tables
- Table 1: Global Vinyl Acetate Industry Revenue Million Forecast, by Region 2019 & 2032
- Table 2: Global Vinyl Acetate Industry Volume K Tons Forecast, by Region 2019 & 2032
- Table 3: Global Vinyl Acetate Industry Revenue Million Forecast, by Application 2019 & 2032
- Table 4: Global Vinyl Acetate Industry Volume K Tons Forecast, by Application 2019 & 2032
- Table 5: Global Vinyl Acetate Industry Revenue Million Forecast, by End-user Industry 2019 & 2032
- Table 6: Global Vinyl Acetate Industry Volume K Tons Forecast, by End-user Industry 2019 & 2032
- Table 7: Global Vinyl Acetate Industry Revenue Million Forecast, by Region 2019 & 2032
- Table 8: Global Vinyl Acetate Industry Volume K Tons Forecast, by Region 2019 & 2032
- Table 9: Global Vinyl Acetate Industry Revenue Million Forecast, by Country 2019 & 2032
- Table 10: Global Vinyl Acetate Industry Volume K Tons Forecast, by Country 2019 & 2032
- Table 11: United States Vinyl Acetate Industry Revenue (Million) Forecast, by Application 2019 & 2032
- Table 12: United States Vinyl Acetate Industry Volume (K Tons) Forecast, by Application 2019 & 2032
- Table 13: Canada Vinyl Acetate Industry Revenue (Million) Forecast, by Application 2019 & 2032
- Table 14: Canada Vinyl Acetate Industry Volume (K Tons) Forecast, by Application 2019 & 2032
- Table 15: Mexico Vinyl Acetate Industry Revenue (Million) Forecast, by Application 2019 & 2032
- Table 16: Mexico Vinyl Acetate Industry Volume (K Tons) Forecast, by Application 2019 & 2032
- Table 17: Global Vinyl Acetate Industry Revenue Million Forecast, by Country 2019 & 2032
- Table 18: Global Vinyl Acetate Industry Volume K Tons Forecast, by Country 2019 & 2032
- Table 19: Germany Vinyl Acetate Industry Revenue (Million) Forecast, by Application 2019 & 2032
- Table 20: Germany Vinyl Acetate Industry Volume (K Tons) Forecast, by Application 2019 & 2032
- Table 21: France Vinyl Acetate Industry Revenue (Million) Forecast, by Application 2019 & 2032
- Table 22: France Vinyl Acetate Industry Volume (K Tons) Forecast, by Application 2019 & 2032
- Table 23: Italy Vinyl Acetate Industry Revenue (Million) Forecast, by Application 2019 & 2032
- Table 24: Italy Vinyl Acetate Industry Volume (K Tons) Forecast, by Application 2019 & 2032
- Table 25: United Kingdom Vinyl Acetate Industry Revenue (Million) Forecast, by Application 2019 & 2032
- Table 26: United Kingdom Vinyl Acetate Industry Volume (K Tons) Forecast, by Application 2019 & 2032
- Table 27: Netherlands Vinyl Acetate Industry Revenue (Million) Forecast, by Application 2019 & 2032
- Table 28: Netherlands Vinyl Acetate Industry Volume (K Tons) Forecast, by Application 2019 & 2032
- Table 29: Rest of Europe Vinyl Acetate Industry Revenue (Million) Forecast, by Application 2019 & 2032
- Table 30: Rest of Europe Vinyl Acetate Industry Volume (K Tons) Forecast, by Application 2019 & 2032
- Table 31: Global Vinyl Acetate Industry Revenue Million Forecast, by Country 2019 & 2032
- Table 32: Global Vinyl Acetate Industry Volume K Tons Forecast, by Country 2019 & 2032
- Table 33: China Vinyl Acetate Industry Revenue (Million) Forecast, by Application 2019 & 2032
- Table 34: China Vinyl Acetate Industry Volume (K Tons) Forecast, by Application 2019 & 2032
- Table 35: Japan Vinyl Acetate Industry Revenue (Million) Forecast, by Application 2019 & 2032
- Table 36: Japan Vinyl Acetate Industry Volume (K Tons) Forecast, by Application 2019 & 2032
- Table 37: India Vinyl Acetate Industry Revenue (Million) Forecast, by Application 2019 & 2032
- Table 38: India Vinyl Acetate Industry Volume (K Tons) Forecast, by Application 2019 & 2032
- Table 39: South Korea Vinyl Acetate Industry Revenue (Million) Forecast, by Application 2019 & 2032
- Table 40: South Korea Vinyl Acetate Industry Volume (K Tons) Forecast, by Application 2019 & 2032
- Table 41: Taiwan Vinyl Acetate Industry Revenue (Million) Forecast, by Application 2019 & 2032
- Table 42: Taiwan Vinyl Acetate Industry Volume (K Tons) Forecast, by Application 2019 & 2032
- Table 43: Australia Vinyl Acetate Industry Revenue (Million) Forecast, by Application 2019 & 2032
- Table 44: Australia Vinyl Acetate Industry Volume (K Tons) Forecast, by Application 2019 & 2032
- Table 45: Rest of Asia-Pacific Vinyl Acetate Industry Revenue (Million) Forecast, by Application 2019 & 2032
- Table 46: Rest of Asia-Pacific Vinyl Acetate Industry Volume (K Tons) Forecast, by Application 2019 & 2032
- Table 47: Global Vinyl Acetate Industry Revenue Million Forecast, by Country 2019 & 2032
- Table 48: Global Vinyl Acetate Industry Volume K Tons Forecast, by Country 2019 & 2032
- Table 49: Brazil Vinyl Acetate Industry Revenue (Million) Forecast, by Application 2019 & 2032
- Table 50: Brazil Vinyl Acetate Industry Volume (K Tons) Forecast, by Application 2019 & 2032
- Table 51: Argentina Vinyl Acetate Industry Revenue (Million) Forecast, by Application 2019 & 2032
- Table 52: Argentina Vinyl Acetate Industry Volume (K Tons) Forecast, by Application 2019 & 2032
- Table 53: Rest of South America Vinyl Acetate Industry Revenue (Million) Forecast, by Application 2019 & 2032
- Table 54: Rest of South America Vinyl Acetate Industry Volume (K Tons) Forecast, by Application 2019 & 2032
- Table 55: Global Vinyl Acetate Industry Revenue Million Forecast, by Country 2019 & 2032
- Table 56: Global Vinyl Acetate Industry Volume K Tons Forecast, by Country 2019 & 2032
- Table 57: Middle East Vinyl Acetate Industry Revenue (Million) Forecast, by Application 2019 & 2032
- Table 58: Middle East Vinyl Acetate Industry Volume (K Tons) Forecast, by Application 2019 & 2032
- Table 59: Africa Vinyl Acetate Industry Revenue (Million) Forecast, by Application 2019 & 2032
- Table 60: Africa Vinyl Acetate Industry Volume (K Tons) Forecast, by Application 2019 & 2032
- Table 61: Global Vinyl Acetate Industry Revenue Million Forecast, by Application 2019 & 2032
- Table 62: Global Vinyl Acetate Industry Volume K Tons Forecast, by Application 2019 & 2032
- Table 63: Global Vinyl Acetate Industry Revenue Million Forecast, by End-user Industry 2019 & 2032
- Table 64: Global Vinyl Acetate Industry Volume K Tons Forecast, by End-user Industry 2019 & 2032
- Table 65: Global Vinyl Acetate Industry Revenue Million Forecast, by Country 2019 & 2032
- Table 66: Global Vinyl Acetate Industry Volume K Tons Forecast, by Country 2019 & 2032
- Table 67: China Vinyl Acetate Industry Revenue (Million) Forecast, by Application 2019 & 2032
- Table 68: China Vinyl Acetate Industry Volume (K Tons) Forecast, by Application 2019 & 2032
- Table 69: India Vinyl Acetate Industry Revenue (Million) Forecast, by Application 2019 & 2032
- Table 70: India Vinyl Acetate Industry Volume (K Tons) Forecast, by Application 2019 & 2032
- Table 71: Japan Vinyl Acetate Industry Revenue (Million) Forecast, by Application 2019 & 2032
- Table 72: Japan Vinyl Acetate Industry Volume (K Tons) Forecast, by Application 2019 & 2032
- Table 73: South Korea Vinyl Acetate Industry Revenue (Million) Forecast, by Application 2019 & 2032
- Table 74: South Korea Vinyl Acetate Industry Volume (K Tons) Forecast, by Application 2019 & 2032
- Table 75: Rest of Asia Pacific Vinyl Acetate Industry Revenue (Million) Forecast, by Application 2019 & 2032
- Table 76: Rest of Asia Pacific Vinyl Acetate Industry Volume (K Tons) Forecast, by Application 2019 & 2032
- Table 77: Global Vinyl Acetate Industry Revenue Million Forecast, by Application 2019 & 2032
- Table 78: Global Vinyl Acetate Industry Volume K Tons Forecast, by Application 2019 & 2032
- Table 79: Global Vinyl Acetate Industry Revenue Million Forecast, by End-user Industry 2019 & 2032
- Table 80: Global Vinyl Acetate Industry Volume K Tons Forecast, by End-user Industry 2019 & 2032
- Table 81: Global Vinyl Acetate Industry Revenue Million Forecast, by Country 2019 & 2032
- Table 82: Global Vinyl Acetate Industry Volume K Tons Forecast, by Country 2019 & 2032
- Table 83: United States Vinyl Acetate Industry Revenue (Million) Forecast, by Application 2019 & 2032
- Table 84: United States Vinyl Acetate Industry Volume (K Tons) Forecast, by Application 2019 & 2032
- Table 85: Canada Vinyl Acetate Industry Revenue (Million) Forecast, by Application 2019 & 2032
- Table 86: Canada Vinyl Acetate Industry Volume (K Tons) Forecast, by Application 2019 & 2032
- Table 87: Mexico Vinyl Acetate Industry Revenue (Million) Forecast, by Application 2019 & 2032
- Table 88: Mexico Vinyl Acetate Industry Volume (K Tons) Forecast, by Application 2019 & 2032
- Table 89: Global Vinyl Acetate Industry Revenue Million Forecast, by Application 2019 & 2032
- Table 90: Global Vinyl Acetate Industry Volume K Tons Forecast, by Application 2019 & 2032
- Table 91: Global Vinyl Acetate Industry Revenue Million Forecast, by End-user Industry 2019 & 2032
- Table 92: Global Vinyl Acetate Industry Volume K Tons Forecast, by End-user Industry 2019 & 2032
- Table 93: Global Vinyl Acetate Industry Revenue Million Forecast, by Country 2019 & 2032
- Table 94: Global Vinyl Acetate Industry Volume K Tons Forecast, by Country 2019 & 2032
- Table 95: Germany Vinyl Acetate Industry Revenue (Million) Forecast, by Application 2019 & 2032
- Table 96: Germany Vinyl Acetate Industry Volume (K Tons) Forecast, by Application 2019 & 2032
- Table 97: United Kingdom Vinyl Acetate Industry Revenue (Million) Forecast, by Application 2019 & 2032
- Table 98: United Kingdom Vinyl Acetate Industry Volume (K Tons) Forecast, by Application 2019 & 2032
- Table 99: Italy Vinyl Acetate Industry Revenue (Million) Forecast, by Application 2019 & 2032
- Table 100: Italy Vinyl Acetate Industry Volume (K Tons) Forecast, by Application 2019 & 2032
- Table 101: Russia Vinyl Acetate Industry Revenue (Million) Forecast, by Application 2019 & 2032
- Table 102: Russia Vinyl Acetate Industry Volume (K Tons) Forecast, by Application 2019 & 2032
- Table 103: France Vinyl Acetate Industry Revenue (Million) Forecast, by Application 2019 & 2032
- Table 104: France Vinyl Acetate Industry Volume (K Tons) Forecast, by Application 2019 & 2032
- Table 105: Rest of Europe Vinyl Acetate Industry Revenue (Million) Forecast, by Application 2019 & 2032
- Table 106: Rest of Europe Vinyl Acetate Industry Volume (K Tons) Forecast, by Application 2019 & 2032
- Table 107: Global Vinyl Acetate Industry Revenue Million Forecast, by Application 2019 & 2032
- Table 108: Global Vinyl Acetate Industry Volume K Tons Forecast, by Application 2019 & 2032
- Table 109: Global Vinyl Acetate Industry Revenue Million Forecast, by End-user Industry 2019 & 2032
- Table 110: Global Vinyl Acetate Industry Volume K Tons Forecast, by End-user Industry 2019 & 2032
- Table 111: Global Vinyl Acetate Industry Revenue Million Forecast, by Country 2019 & 2032
- Table 112: Global Vinyl Acetate Industry Volume K Tons Forecast, by Country 2019 & 2032
- Table 113: Brazil Vinyl Acetate Industry Revenue (Million) Forecast, by Application 2019 & 2032
- Table 114: Brazil Vinyl Acetate Industry Volume (K Tons) Forecast, by Application 2019 & 2032
- Table 115: Argentina Vinyl Acetate Industry Revenue (Million) Forecast, by Application 2019 & 2032
- Table 116: Argentina Vinyl Acetate Industry Volume (K Tons) Forecast, by Application 2019 & 2032
- Table 117: Rest of South America Vinyl Acetate Industry Revenue (Million) Forecast, by Application 2019 & 2032
- Table 118: Rest of South America Vinyl Acetate Industry Volume (K Tons) Forecast, by Application 2019 & 2032
- Table 119: Global Vinyl Acetate Industry Revenue Million Forecast, by Application 2019 & 2032
- Table 120: Global Vinyl Acetate Industry Volume K Tons Forecast, by Application 2019 & 2032
- Table 121: Global Vinyl Acetate Industry Revenue Million Forecast, by End-user Industry 2019 & 2032
- Table 122: Global Vinyl Acetate Industry Volume K Tons Forecast, by End-user Industry 2019 & 2032
- Table 123: Global Vinyl Acetate Industry Revenue Million Forecast, by Country 2019 & 2032
- Table 124: Global Vinyl Acetate Industry Volume K Tons Forecast, by Country 2019 & 2032
- Table 125: Saudi Arabia Vinyl Acetate Industry Revenue (Million) Forecast, by Application 2019 & 2032
- Table 126: Saudi Arabia Vinyl Acetate Industry Volume (K Tons) Forecast, by Application 2019 & 2032
- Table 127: South Africa Vinyl Acetate Industry Revenue (Million) Forecast, by Application 2019 & 2032
- Table 128: South Africa Vinyl Acetate Industry Volume (K Tons) Forecast, by Application 2019 & 2032
- Table 129: Rest of Middle East and Africa Vinyl Acetate Industry Revenue (Million) Forecast, by Application 2019 & 2032
- Table 130: Rest of Middle East and Africa Vinyl Acetate Industry Volume (K Tons) Forecast, by Application 2019 & 2032
Frequently Asked Questions
1. What is the projected Compound Annual Growth Rate (CAGR) of the Vinyl Acetate Industry?
The projected CAGR is approximately > 4.00%.
2. Which companies are prominent players in the Vinyl Acetate Industry?
Key companies in the market include Nippon Chemical Industrial CO LTD, Arkema, DCC, China Petrochemical Corporation, Exxon Mobil Corporation, INEOS, Celanese Corporation, Kemipex, LyondellBasell Industries Holdings B V, CLARIANT, Sipchem Company, Wacker Chemie AG, Innospec.
3. What are the main segments of the Vinyl Acetate Industry?
The market segments include Application, End-user Industry.
4. Can you provide details about the market size?
The market size is estimated to be USD XX Million as of 2022.
5. What are some drivers contributing to market growth?
Increased Use of Adhesives in Food Packaging; Increasing Use in the Solar Power Generation Industry.
6. What are the notable trends driving market growth?
Increasing Demand from the Solar Industry.
7. Are there any restraints impacting market growth?
Stringent Health and Environmental Regulations; Other Restraints.
8. Can you provide examples of recent developments in the market?
February 2023: Celanese Corporation announced the completion of an ultra-low capital initiative to repurpose existing manufacturing and infrastructure assets to enable extra ethylene vinyl acetate (EVA) capacity at its Edmonton, Alberta site. The development will help the Acetyl Chain's downstream vinyl offering expand significantly.
9. What pricing options are available for accessing the report?
Pricing options include single-user, multi-user, and enterprise licenses priced at USD 4750, USD 5250, and USD 8750 respectively.
10. Is the market size provided in terms of value or volume?
The market size is provided in terms of value, measured in Million and volume, measured in K Tons.
11. Are there any specific market keywords associated with the report?
Yes, the market keyword associated with the report is "Vinyl Acetate Industry," which aids in identifying and referencing the specific market segment covered.
12. How do I determine which pricing option suits my needs best?
The pricing options vary based on user requirements and access needs. Individual users may opt for single-user licenses, while businesses requiring broader access may choose multi-user or enterprise licenses for cost-effective access to the report.
13. Are there any additional resources or data provided in the Vinyl Acetate Industry report?
While the report offers comprehensive insights, it's advisable to review the specific contents or supplementary materials provided to ascertain if additional resources or data are available.
14. How can I stay updated on further developments or reports in the Vinyl Acetate Industry?
To stay informed about further developments, trends, and reports in the Vinyl Acetate Industry, consider subscribing to industry newsletters, following relevant companies and organizations, or regularly checking reputable industry news sources and publications.
Methodology
Step 1 - Identification of Relevant Samples Size from Population Database


Step 2 - Approaches for Defining Global Market Size (Value, Volume* & Price*)

Note*: In applicable scenarios
Step 3 - Data Sources
Primary Research
- Web Analytics
- Survey Reports
- Research Institute
- Latest Research Reports
- Opinion Leaders
Secondary Research
- Annual Reports
- White Paper
- Latest Press Release
- Industry Association
- Paid Database
- Investor Presentations

Step 4 - Data Triangulation
Involves using different sources of information in order to increase the validity of a study
These sources are likely to be stakeholders in a program - participants, other researchers, program staff, other community members, and so on.
Then we put all data in single framework & apply various statistical tools to find out the dynamic on the market.
During the analysis stage, feedback from the stakeholder groups would be compared to determine areas of agreement as well as areas of divergence


