


Key Insights
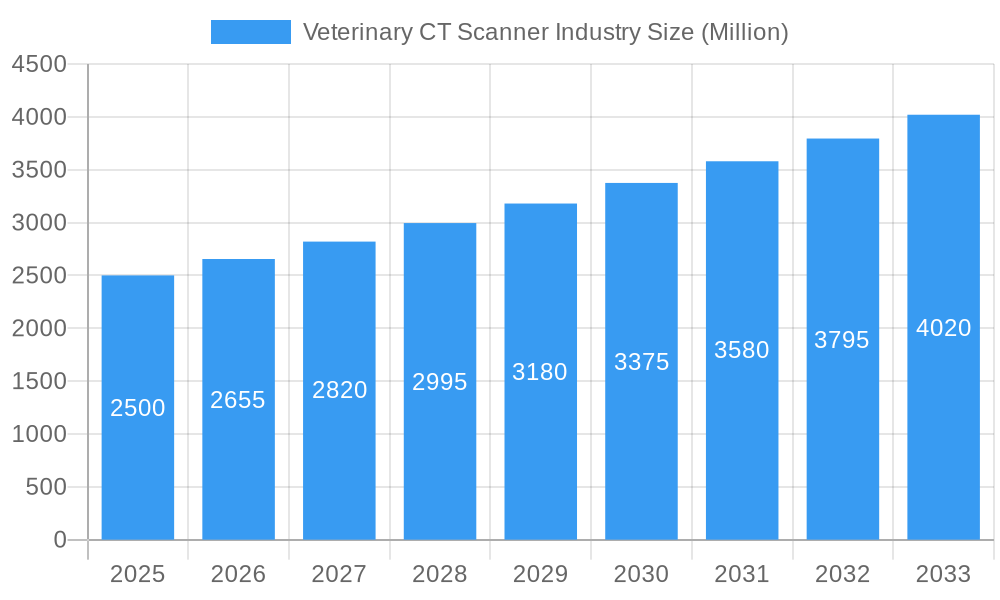
The veterinary CT scanner market is poised for significant expansion, fueled by escalating pet ownership, increasing veterinary healthcare spending, and rapid advancements in diagnostic imaging. The market demonstrated a robust compound annual growth rate (CAGR) of 7.15%, with a projected market size of 449.71 million in the base year 2025. This upward trajectory is expected to persist through the forecast period (2025-2033). Key growth drivers include the rising incidence of animal chronic diseases, necessitating advanced diagnostic tools for accurate diagnosis and treatment. Additionally, the growing adoption of minimally invasive surgical procedures relies heavily on pre-operative CT scans for precise guidance. The market is segmented by animal type, with companion animals (dogs and cats) exhibiting strong demand due to higher ownership rates and owners' willingness to invest in premium veterinary care. Technological innovations, such as the development of portable CT scanners enhancing accessibility and cost-effectiveness, further stimulate market growth. While initial investment costs and the need for specialized operator training present potential challenges, the overall market outlook remains highly positive. North America currently commands a substantial market share, attributed to high pet ownership and well-developed veterinary infrastructure. However, the Asia-Pacific region is anticipated to witness accelerated growth, driven by a burgeoning middle class and increasing pet adoption. Leading players, including Samsung, GE Healthcare, and Siemens Healthineers, are actively innovating and forging strategic partnerships to shape market dynamics. The ongoing development of more affordable and user-friendly veterinary CT scanners will broaden access to advanced diagnostics and propel future market growth.
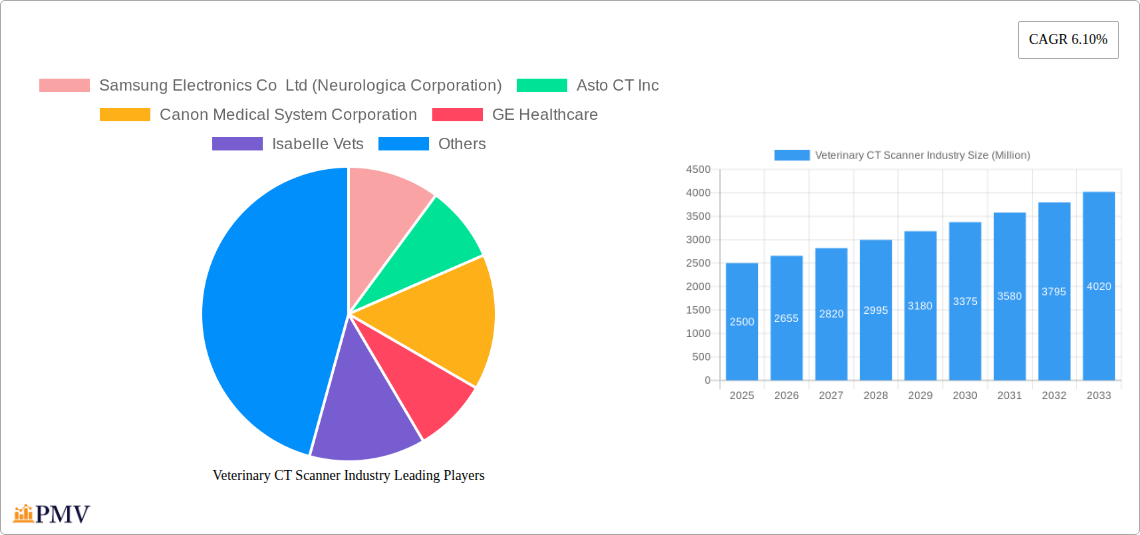
Veterinary CT Scanner Industry Market Size (In Million)

The competitive landscape features a blend of established medical imaging corporations and specialized veterinary equipment manufacturers. Strategic imperatives focus on product innovation, global market expansion, and collaborative partnerships to deepen market penetration. Differentiation strategies emphasize portability, superior image quality, reduced radiation dosage, and intuitive user interfaces. Stationary multi-slice CT scanners are favored in large veterinary hospitals and research institutions, while portable units are gaining traction among smaller clinics. Success hinges on balancing technological sophistication with affordability and accessibility to meet the diverse needs of veterinary practices and research facilities worldwide. Regulatory approvals and continued research into image enhancement and radiation dose reduction will also be critical factors influencing this dynamic market. Future growth is projected to be strong, driven by continuous technological advancements and the growing recognition of advanced diagnostic imaging's vital role in improving animal health outcomes.
Veterinary CT Scanner Industry Company Market Share
Veterinary CT Scanner Industry: A Comprehensive Market Report (2019-2033)
This in-depth report provides a comprehensive analysis of the Veterinary CT Scanner industry, offering actionable insights for stakeholders across the value chain. The study period spans 2019-2033, with 2025 as the base and estimated year, and a forecast period of 2025-2033. The historical period covered is 2019-2024. The report analyzes market size (in Millions), growth drivers, challenges, competitive dynamics, and future opportunities within the veterinary CT scanner market. Key market segments, including product type, animal type, application, and end-user, are meticulously examined. Leading players like Samsung Electronics Co Ltd (Neurologica Corporation), Asto CT Inc, Canon Medical System Corporation, GE Healthcare, Isabelle Vets, Animage LLC, GNI ApS, Siemens Healthineers, and Epica Animal Health are profiled, providing crucial competitive intelligence.
Veterinary CT Scanner Industry Market Structure & Competitive Dynamics
The veterinary CT scanner market is characterized by a moderately concentrated structure, with a few major players holding significant market share. Market concentration is expected to remain relatively stable during the forecast period, although increased competition from emerging players is anticipated. The industry witnesses ongoing innovation, driven by advancements in image processing, detector technology, and software capabilities. Regulatory frameworks vary across different regions, influencing market access and adoption rates. The absence of perfect substitutes for CT scanners in veterinary diagnostics ensures market stability, albeit with growing competition from advanced ultrasound technologies. End-user trends towards improved animal care and diagnostic precision are fueling market growth. M&A activity in the sector has been moderate in recent years, with deal values averaging approximately xx Million per transaction (2019-2024). Key players are expected to continue strategic acquisitions for expansion and technological advancements.
- Market Share: The top three players collectively hold an estimated xx% market share.
- M&A Activity: An average of xx M&A deals occurred annually during the historical period, with a total deal value of approximately xx Million.
- Regulatory Landscape: Stringent regulatory approvals required for medical devices pose a moderate barrier to entry.
Veterinary CT Scanner Industry Industry Trends & Insights
The global veterinary CT scanner market is experiencing robust growth, driven by factors such as rising pet ownership, increasing veterinary healthcare spending, technological advancements leading to improved image quality and reduced scan times, and a greater emphasis on minimally invasive procedures. The Compound Annual Growth Rate (CAGR) for the market is projected at xx% during the forecast period (2025-2033). Market penetration of CT scanners in veterinary hospitals is still relatively low compared to human healthcare settings, representing a significant opportunity for growth. Technological disruptions, such as the development of portable and mobile CT scanners, are expanding access to this technology in diverse settings. The increasing adoption of AI-powered image analysis tools is improving diagnostic accuracy and efficiency. Consumer preference for advanced diagnostic tools that provide high-quality images and swift results contributes to sustained market growth. Competition among key players is intensifying, leading to innovations in technology and service offerings.
Dominant Markets & Segments in Veterinary CT Scanner Industry
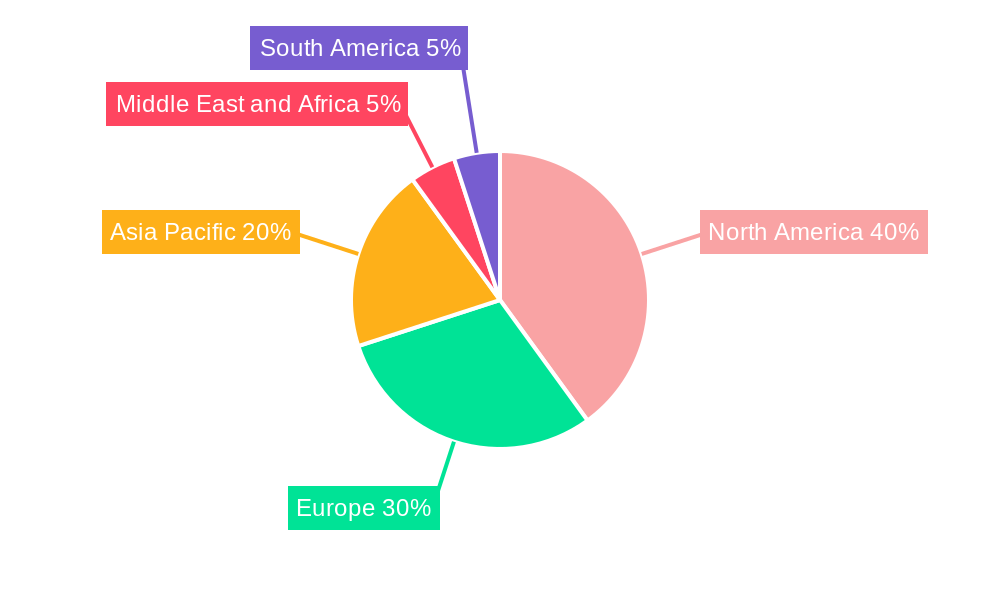
The North American market currently dominates the veterinary CT scanner industry, driven by high veterinary healthcare expenditure, advanced infrastructure, and a high pet ownership rate. Within the segmentation, the companion animal segment commands the largest market share due to rising pet humanization and the willingness of pet owners to invest in advanced diagnostic techniques. Stationary multi-slice CT scanners are the dominant product type, due to their superior image quality and diagnostic capabilities. The applications of CT scans are diverse, with oncology and neurology segments being prominent users. Veterinary hospitals are the main end-users, with research institutes playing a growing role.
- Key Drivers for North American Dominance:
- High disposable income and pet ownership rates.
- Well-established veterinary infrastructure.
- Favorable regulatory environment.
- Companion Animal Segment Dominance:
- Growing human-animal bond and willingness to spend on pet healthcare.
- Increased awareness regarding early diagnosis and advanced treatments.
- Stationary Multi-slice CT Scanner Dominance:
- Superior image quality and diagnostic capabilities.
- Better suited for routine clinical procedures.
Veterinary CT Scanner Industry Product Innovations
Recent innovations include the development of smaller, more portable CT scanners tailored for veterinary settings, improving accessibility, particularly for equine and livestock applications. Improvements in image reconstruction algorithms and AI-powered image analysis are enhancing diagnostic accuracy and reducing scan time. The incorporation of advanced features such as 3D reconstruction and multi-planar reformatting offers more detailed anatomical insights. These product advancements have created a strong market fit, attracting new customers and increasing market penetration.
Report Segmentation & Scope
This report segments the veterinary CT scanner market based on several key parameters:
- Product Type: Stationary Multi-slice CT Scanner (Market size: xx Million in 2025, projected CAGR: xx%), Portable CT Scanner (Market size: xx Million in 2025, projected CAGR: xx%). Competition is intense in the stationary segment, with established players dominating. The portable segment offers significant growth potential.
- Animal Type: Companion Animal (Market size: xx Million in 2025, projected CAGR: xx%), Livestock Animal (Market size: xx Million in 2025, projected CAGR: xx%), Other Animal Types (Market size: xx Million in 2025, projected CAGR: xx%). Companion animals currently dominate due to higher pet ownership and spending.
- Application: Neurology (Market size: xx Million in 2025, projected CAGR: xx%), Oncology (Market size: xx Million in 2025, projected CAGR: xx%), Cardiology (Market size: xx Million in 2025, projected CAGR: xx%), Nephrology (Market size: xx Million in 2025, projected CAGR: xx%), Gastroenterology (Market size: xx Million in 2025, projected CAGR: xx%), Other Applications (Market size: xx Million in 2025, projected CAGR: xx%). Neurology and oncology lead due to their high diagnostic needs.
- End-User: Veterinary Hospitals (Market size: xx Million in 2025, projected CAGR: xx%), Research Institutes (Market size: xx Million in 2025, projected CAGR: xx%), Other End-Users (Market size: xx Million in 2025, projected CAGR: xx%). Veterinary hospitals account for the majority of market share, while research institutes are growing.
Key Drivers of Veterinary CT Scanner Industry Growth
The veterinary CT scanner market is experiencing growth due to several factors: increasing pet ownership and spending on pet healthcare, technological advancements leading to more efficient and accurate imaging, the growing adoption of minimally invasive procedures, and expanding veterinary infrastructure, particularly in emerging economies. Furthermore, supportive regulatory policies and increased government funding for veterinary research are driving market expansion.
Challenges in the Veterinary CT Scanner Industry Sector
The veterinary CT scanner market faces challenges including the high initial investment cost associated with purchasing and maintaining CT scanners, which limits adoption, particularly in smaller veterinary clinics. Supply chain disruptions impacting component availability and rising prices present operational challenges. Furthermore, intense competition from other diagnostic imaging technologies, such as MRI and ultrasound, puts pressure on pricing and market share.
Leading Players in the Veterinary CT Scanner Industry Market
- Samsung Electronics Co Ltd (Neurologica Corporation) [link to Samsung global site if available, otherwise remove bracketed information]
- Asto CT Inc
- Canon Medical System Corporation [link to Canon Medical Systems global site if available]
- GE Healthcare [link to GE Healthcare global site if available]
- Isabelle Vets
- Animage LLC
- GNI ApS
- Siemens Healthineers [link to Siemens Healthineers global site if available]
- Epica Animal Health
Key Developments in Veterinary CT Scanner Industry Sector
- September 2022: Installation of a Toshiba Aquilion 16 CT scanner at a Fort Lauderdale, Florida-based referral hospital, highlighting the adoption of advanced technology for enhanced pet care. This signifies the trend of upgrading equipment for better diagnostic capabilities.
- April 2022: Launch of an innovative online computed tomography (CT) program by Improve International, expanding educational opportunities and potentially leading to increased skilled professionals in the field. This will positively impact the adoption and utilization of CT scanners.
Strategic Veterinary CT Scanner Industry Market Outlook
The veterinary CT scanner market holds significant potential for growth in the coming years. Continued technological advancements, rising pet ownership rates globally, and increasing awareness of the benefits of early diagnosis will fuel market expansion. Strategic opportunities lie in developing more affordable and portable CT scanners to improve access in underserved regions, and in incorporating AI and machine learning into image analysis to improve diagnostic accuracy and efficiency. Focus on providing comprehensive service and maintenance packages to enhance customer value and retention will also be crucial.
Veterinary CT Scanner Industry Segmentation
-
1. Product Type
- 1.1. Stationary Multi-slice CT Scanner
- 1.2. Portable CT Scanner
-
2. Animal Type
- 2.1. Companion Animal
- 2.2. Livestock Animal
- 2.3. Other Animal Types
-
3. Application
- 3.1. Neurology
- 3.2. Oncology
- 3.3. Cardiology
- 3.4. Nephrology
- 3.5. Gastroenterology
- 3.6. Other Applications
-
4. End-User
- 4.1. Veterinary Hospitals
- 4.2. Research Institutes
- 4.3. Other End-Users
Veterinary CT Scanner Industry Segmentation By Geography
-
1. North America
- 1.1. United States
- 1.2. Canada
- 1.3. Mexico
-
2. Europe
- 2.1. Germany
- 2.2. United Kingdom
- 2.3. France
- 2.4. Italy
- 2.5. Spain
- 2.6. Rest of Europe
-
3. Asia Pacific
- 3.1. China
- 3.2. Japan
- 3.3. India
- 3.4. Australia
- 3.5. South Korea
- 3.6. Rest of Asia Pacific
-
4. Middle East and Africa
- 4.1. GCC
- 4.2. South Africa
- 4.3. Rest of Middle East and Africa
-
5. South America
- 5.1. Brazil
- 5.2. Argentina
- 5.3. Rest of South America
Veterinary CT Scanner Industry Regional Market Share
Geographic Coverage of Veterinary CT Scanner Industry
Veterinary CT Scanner Industry REPORT HIGHLIGHTS
| Aspects | Details |
|---|---|
| Study Period | 2020-2034 |
| Base Year | 2025 |
| Estimated Year | 2026 |
| Forecast Period | 2026-2034 |
| Historical Period | 2020-2025 |
| Growth Rate | CAGR of 7.15% from 2020-2034 |
| Segmentation |
|
Table of Contents
- 1. Introduction
- 1.1. Research Scope
- 1.2. Market Segmentation
- 1.3. Research Methodology
- 1.4. Definitions and Assumptions
- 2. Executive Summary
- 2.1. Introduction
- 3. Market Dynamics
- 3.1. Introduction
- 3.2. Market Drivers
- 3.2.1. Increased Pet Ownership and Animal Health Expenditure; Rising Prevalence of Animal Diseases and Injuries
- 3.3. Market Restrains
- 3.3.1. High Cost of CT Imaging Devices; Low Animal Health Awareness in Emerging Markets
- 3.4. Market Trends
- 3.4.1. Companion Animals Segment is Expected to Hold a Significant Market Share During the Forecast Period
- 4. Market Factor Analysis
- 4.1. Porters Five Forces
- 4.2. Supply/Value Chain
- 4.3. PESTEL analysis
- 4.4. Market Entropy
- 4.5. Patent/Trademark Analysis
- 5. Global Veterinary CT Scanner Industry Analysis, Insights and Forecast, 2020-2032
- 5.1. Market Analysis, Insights and Forecast - by Product Type
- 5.1.1. Stationary Multi-slice CT Scanner
- 5.1.2. Portable CT Scanner
- 5.2. Market Analysis, Insights and Forecast - by Animal Type
- 5.2.1. Companion Animal
- 5.2.2. Livestock Animal
- 5.2.3. Other Animal Types
- 5.3. Market Analysis, Insights and Forecast - by Application
- 5.3.1. Neurology
- 5.3.2. Oncology
- 5.3.3. Cardiology
- 5.3.4. Nephrology
- 5.3.5. Gastroenterology
- 5.3.6. Other Applications
- 5.4. Market Analysis, Insights and Forecast - by End-User
- 5.4.1. Veterinary Hospitals
- 5.4.2. Research Institutes
- 5.4.3. Other End-Users
- 5.5. Market Analysis, Insights and Forecast - by Region
- 5.5.1. North America
- 5.5.2. Europe
- 5.5.3. Asia Pacific
- 5.5.4. Middle East and Africa
- 5.5.5. South America
- 5.1. Market Analysis, Insights and Forecast - by Product Type
- 6. North America Veterinary CT Scanner Industry Analysis, Insights and Forecast, 2020-2032
- 6.1. Market Analysis, Insights and Forecast - by Product Type
- 6.1.1. Stationary Multi-slice CT Scanner
- 6.1.2. Portable CT Scanner
- 6.2. Market Analysis, Insights and Forecast - by Animal Type
- 6.2.1. Companion Animal
- 6.2.2. Livestock Animal
- 6.2.3. Other Animal Types
- 6.3. Market Analysis, Insights and Forecast - by Application
- 6.3.1. Neurology
- 6.3.2. Oncology
- 6.3.3. Cardiology
- 6.3.4. Nephrology
- 6.3.5. Gastroenterology
- 6.3.6. Other Applications
- 6.4. Market Analysis, Insights and Forecast - by End-User
- 6.4.1. Veterinary Hospitals
- 6.4.2. Research Institutes
- 6.4.3. Other End-Users
- 6.1. Market Analysis, Insights and Forecast - by Product Type
- 7. Europe Veterinary CT Scanner Industry Analysis, Insights and Forecast, 2020-2032
- 7.1. Market Analysis, Insights and Forecast - by Product Type
- 7.1.1. Stationary Multi-slice CT Scanner
- 7.1.2. Portable CT Scanner
- 7.2. Market Analysis, Insights and Forecast - by Animal Type
- 7.2.1. Companion Animal
- 7.2.2. Livestock Animal
- 7.2.3. Other Animal Types
- 7.3. Market Analysis, Insights and Forecast - by Application
- 7.3.1. Neurology
- 7.3.2. Oncology
- 7.3.3. Cardiology
- 7.3.4. Nephrology
- 7.3.5. Gastroenterology
- 7.3.6. Other Applications
- 7.4. Market Analysis, Insights and Forecast - by End-User
- 7.4.1. Veterinary Hospitals
- 7.4.2. Research Institutes
- 7.4.3. Other End-Users
- 7.1. Market Analysis, Insights and Forecast - by Product Type
- 8. Asia Pacific Veterinary CT Scanner Industry Analysis, Insights and Forecast, 2020-2032
- 8.1. Market Analysis, Insights and Forecast - by Product Type
- 8.1.1. Stationary Multi-slice CT Scanner
- 8.1.2. Portable CT Scanner
- 8.2. Market Analysis, Insights and Forecast - by Animal Type
- 8.2.1. Companion Animal
- 8.2.2. Livestock Animal
- 8.2.3. Other Animal Types
- 8.3. Market Analysis, Insights and Forecast - by Application
- 8.3.1. Neurology
- 8.3.2. Oncology
- 8.3.3. Cardiology
- 8.3.4. Nephrology
- 8.3.5. Gastroenterology
- 8.3.6. Other Applications
- 8.4. Market Analysis, Insights and Forecast - by End-User
- 8.4.1. Veterinary Hospitals
- 8.4.2. Research Institutes
- 8.4.3. Other End-Users
- 8.1. Market Analysis, Insights and Forecast - by Product Type
- 9. Middle East and Africa Veterinary CT Scanner Industry Analysis, Insights and Forecast, 2020-2032
- 9.1. Market Analysis, Insights and Forecast - by Product Type
- 9.1.1. Stationary Multi-slice CT Scanner
- 9.1.2. Portable CT Scanner
- 9.2. Market Analysis, Insights and Forecast - by Animal Type
- 9.2.1. Companion Animal
- 9.2.2. Livestock Animal
- 9.2.3. Other Animal Types
- 9.3. Market Analysis, Insights and Forecast - by Application
- 9.3.1. Neurology
- 9.3.2. Oncology
- 9.3.3. Cardiology
- 9.3.4. Nephrology
- 9.3.5. Gastroenterology
- 9.3.6. Other Applications
- 9.4. Market Analysis, Insights and Forecast - by End-User
- 9.4.1. Veterinary Hospitals
- 9.4.2. Research Institutes
- 9.4.3. Other End-Users
- 9.1. Market Analysis, Insights and Forecast - by Product Type
- 10. South America Veterinary CT Scanner Industry Analysis, Insights and Forecast, 2020-2032
- 10.1. Market Analysis, Insights and Forecast - by Product Type
- 10.1.1. Stationary Multi-slice CT Scanner
- 10.1.2. Portable CT Scanner
- 10.2. Market Analysis, Insights and Forecast - by Animal Type
- 10.2.1. Companion Animal
- 10.2.2. Livestock Animal
- 10.2.3. Other Animal Types
- 10.3. Market Analysis, Insights and Forecast - by Application
- 10.3.1. Neurology
- 10.3.2. Oncology
- 10.3.3. Cardiology
- 10.3.4. Nephrology
- 10.3.5. Gastroenterology
- 10.3.6. Other Applications
- 10.4. Market Analysis, Insights and Forecast - by End-User
- 10.4.1. Veterinary Hospitals
- 10.4.2. Research Institutes
- 10.4.3. Other End-Users
- 10.1. Market Analysis, Insights and Forecast - by Product Type
- 11. Competitive Analysis
- 11.1. Global Market Share Analysis 2025
- 11.2. Company Profiles
- 11.2.1 Samsung Electronics Co Ltd (Neurologica Corporation)
- 11.2.1.1. Overview
- 11.2.1.2. Products
- 11.2.1.3. SWOT Analysis
- 11.2.1.4. Recent Developments
- 11.2.1.5. Financials (Based on Availability)
- 11.2.2 Asto CT Inc
- 11.2.2.1. Overview
- 11.2.2.2. Products
- 11.2.2.3. SWOT Analysis
- 11.2.2.4. Recent Developments
- 11.2.2.5. Financials (Based on Availability)
- 11.2.3 Canon Medical System Corporation
- 11.2.3.1. Overview
- 11.2.3.2. Products
- 11.2.3.3. SWOT Analysis
- 11.2.3.4. Recent Developments
- 11.2.3.5. Financials (Based on Availability)
- 11.2.4 GE Healthcare
- 11.2.4.1. Overview
- 11.2.4.2. Products
- 11.2.4.3. SWOT Analysis
- 11.2.4.4. Recent Developments
- 11.2.4.5. Financials (Based on Availability)
- 11.2.5 Isabelle Vets
- 11.2.5.1. Overview
- 11.2.5.2. Products
- 11.2.5.3. SWOT Analysis
- 11.2.5.4. Recent Developments
- 11.2.5.5. Financials (Based on Availability)
- 11.2.6 Animage LLC
- 11.2.6.1. Overview
- 11.2.6.2. Products
- 11.2.6.3. SWOT Analysis
- 11.2.6.4. Recent Developments
- 11.2.6.5. Financials (Based on Availability)
- 11.2.7 GNI ApS
- 11.2.7.1. Overview
- 11.2.7.2. Products
- 11.2.7.3. SWOT Analysis
- 11.2.7.4. Recent Developments
- 11.2.7.5. Financials (Based on Availability)
- 11.2.8 Siemens Healthineers
- 11.2.8.1. Overview
- 11.2.8.2. Products
- 11.2.8.3. SWOT Analysis
- 11.2.8.4. Recent Developments
- 11.2.8.5. Financials (Based on Availability)
- 11.2.9 Epica Animal Health
- 11.2.9.1. Overview
- 11.2.9.2. Products
- 11.2.9.3. SWOT Analysis
- 11.2.9.4. Recent Developments
- 11.2.9.5. Financials (Based on Availability)
- 11.2.1 Samsung Electronics Co Ltd (Neurologica Corporation)
List of Figures
- Figure 1: Global Veterinary CT Scanner Industry Revenue Breakdown (million, %) by Region 2025 & 2033
- Figure 2: Global Veterinary CT Scanner Industry Volume Breakdown (K Unit, %) by Region 2025 & 2033
- Figure 3: North America Veterinary CT Scanner Industry Revenue (million), by Product Type 2025 & 2033
- Figure 4: North America Veterinary CT Scanner Industry Volume (K Unit), by Product Type 2025 & 2033
- Figure 5: North America Veterinary CT Scanner Industry Revenue Share (%), by Product Type 2025 & 2033
- Figure 6: North America Veterinary CT Scanner Industry Volume Share (%), by Product Type 2025 & 2033
- Figure 7: North America Veterinary CT Scanner Industry Revenue (million), by Animal Type 2025 & 2033
- Figure 8: North America Veterinary CT Scanner Industry Volume (K Unit), by Animal Type 2025 & 2033
- Figure 9: North America Veterinary CT Scanner Industry Revenue Share (%), by Animal Type 2025 & 2033
- Figure 10: North America Veterinary CT Scanner Industry Volume Share (%), by Animal Type 2025 & 2033
- Figure 11: North America Veterinary CT Scanner Industry Revenue (million), by Application 2025 & 2033
- Figure 12: North America Veterinary CT Scanner Industry Volume (K Unit), by Application 2025 & 2033
- Figure 13: North America Veterinary CT Scanner Industry Revenue Share (%), by Application 2025 & 2033
- Figure 14: North America Veterinary CT Scanner Industry Volume Share (%), by Application 2025 & 2033
- Figure 15: North America Veterinary CT Scanner Industry Revenue (million), by End-User 2025 & 2033
- Figure 16: North America Veterinary CT Scanner Industry Volume (K Unit), by End-User 2025 & 2033
- Figure 17: North America Veterinary CT Scanner Industry Revenue Share (%), by End-User 2025 & 2033
- Figure 18: North America Veterinary CT Scanner Industry Volume Share (%), by End-User 2025 & 2033
- Figure 19: North America Veterinary CT Scanner Industry Revenue (million), by Country 2025 & 2033
- Figure 20: North America Veterinary CT Scanner Industry Volume (K Unit), by Country 2025 & 2033
- Figure 21: North America Veterinary CT Scanner Industry Revenue Share (%), by Country 2025 & 2033
- Figure 22: North America Veterinary CT Scanner Industry Volume Share (%), by Country 2025 & 2033
- Figure 23: Europe Veterinary CT Scanner Industry Revenue (million), by Product Type 2025 & 2033
- Figure 24: Europe Veterinary CT Scanner Industry Volume (K Unit), by Product Type 2025 & 2033
- Figure 25: Europe Veterinary CT Scanner Industry Revenue Share (%), by Product Type 2025 & 2033
- Figure 26: Europe Veterinary CT Scanner Industry Volume Share (%), by Product Type 2025 & 2033
- Figure 27: Europe Veterinary CT Scanner Industry Revenue (million), by Animal Type 2025 & 2033
- Figure 28: Europe Veterinary CT Scanner Industry Volume (K Unit), by Animal Type 2025 & 2033
- Figure 29: Europe Veterinary CT Scanner Industry Revenue Share (%), by Animal Type 2025 & 2033
- Figure 30: Europe Veterinary CT Scanner Industry Volume Share (%), by Animal Type 2025 & 2033
- Figure 31: Europe Veterinary CT Scanner Industry Revenue (million), by Application 2025 & 2033
- Figure 32: Europe Veterinary CT Scanner Industry Volume (K Unit), by Application 2025 & 2033
- Figure 33: Europe Veterinary CT Scanner Industry Revenue Share (%), by Application 2025 & 2033
- Figure 34: Europe Veterinary CT Scanner Industry Volume Share (%), by Application 2025 & 2033
- Figure 35: Europe Veterinary CT Scanner Industry Revenue (million), by End-User 2025 & 2033
- Figure 36: Europe Veterinary CT Scanner Industry Volume (K Unit), by End-User 2025 & 2033
- Figure 37: Europe Veterinary CT Scanner Industry Revenue Share (%), by End-User 2025 & 2033
- Figure 38: Europe Veterinary CT Scanner Industry Volume Share (%), by End-User 2025 & 2033
- Figure 39: Europe Veterinary CT Scanner Industry Revenue (million), by Country 2025 & 2033
- Figure 40: Europe Veterinary CT Scanner Industry Volume (K Unit), by Country 2025 & 2033
- Figure 41: Europe Veterinary CT Scanner Industry Revenue Share (%), by Country 2025 & 2033
- Figure 42: Europe Veterinary CT Scanner Industry Volume Share (%), by Country 2025 & 2033
- Figure 43: Asia Pacific Veterinary CT Scanner Industry Revenue (million), by Product Type 2025 & 2033
- Figure 44: Asia Pacific Veterinary CT Scanner Industry Volume (K Unit), by Product Type 2025 & 2033
- Figure 45: Asia Pacific Veterinary CT Scanner Industry Revenue Share (%), by Product Type 2025 & 2033
- Figure 46: Asia Pacific Veterinary CT Scanner Industry Volume Share (%), by Product Type 2025 & 2033
- Figure 47: Asia Pacific Veterinary CT Scanner Industry Revenue (million), by Animal Type 2025 & 2033
- Figure 48: Asia Pacific Veterinary CT Scanner Industry Volume (K Unit), by Animal Type 2025 & 2033
- Figure 49: Asia Pacific Veterinary CT Scanner Industry Revenue Share (%), by Animal Type 2025 & 2033
- Figure 50: Asia Pacific Veterinary CT Scanner Industry Volume Share (%), by Animal Type 2025 & 2033
- Figure 51: Asia Pacific Veterinary CT Scanner Industry Revenue (million), by Application 2025 & 2033
- Figure 52: Asia Pacific Veterinary CT Scanner Industry Volume (K Unit), by Application 2025 & 2033
- Figure 53: Asia Pacific Veterinary CT Scanner Industry Revenue Share (%), by Application 2025 & 2033
- Figure 54: Asia Pacific Veterinary CT Scanner Industry Volume Share (%), by Application 2025 & 2033
- Figure 55: Asia Pacific Veterinary CT Scanner Industry Revenue (million), by End-User 2025 & 2033
- Figure 56: Asia Pacific Veterinary CT Scanner Industry Volume (K Unit), by End-User 2025 & 2033
- Figure 57: Asia Pacific Veterinary CT Scanner Industry Revenue Share (%), by End-User 2025 & 2033
- Figure 58: Asia Pacific Veterinary CT Scanner Industry Volume Share (%), by End-User 2025 & 2033
- Figure 59: Asia Pacific Veterinary CT Scanner Industry Revenue (million), by Country 2025 & 2033
- Figure 60: Asia Pacific Veterinary CT Scanner Industry Volume (K Unit), by Country 2025 & 2033
- Figure 61: Asia Pacific Veterinary CT Scanner Industry Revenue Share (%), by Country 2025 & 2033
- Figure 62: Asia Pacific Veterinary CT Scanner Industry Volume Share (%), by Country 2025 & 2033
- Figure 63: Middle East and Africa Veterinary CT Scanner Industry Revenue (million), by Product Type 2025 & 2033
- Figure 64: Middle East and Africa Veterinary CT Scanner Industry Volume (K Unit), by Product Type 2025 & 2033
- Figure 65: Middle East and Africa Veterinary CT Scanner Industry Revenue Share (%), by Product Type 2025 & 2033
- Figure 66: Middle East and Africa Veterinary CT Scanner Industry Volume Share (%), by Product Type 2025 & 2033
- Figure 67: Middle East and Africa Veterinary CT Scanner Industry Revenue (million), by Animal Type 2025 & 2033
- Figure 68: Middle East and Africa Veterinary CT Scanner Industry Volume (K Unit), by Animal Type 2025 & 2033
- Figure 69: Middle East and Africa Veterinary CT Scanner Industry Revenue Share (%), by Animal Type 2025 & 2033
- Figure 70: Middle East and Africa Veterinary CT Scanner Industry Volume Share (%), by Animal Type 2025 & 2033
- Figure 71: Middle East and Africa Veterinary CT Scanner Industry Revenue (million), by Application 2025 & 2033
- Figure 72: Middle East and Africa Veterinary CT Scanner Industry Volume (K Unit), by Application 2025 & 2033
- Figure 73: Middle East and Africa Veterinary CT Scanner Industry Revenue Share (%), by Application 2025 & 2033
- Figure 74: Middle East and Africa Veterinary CT Scanner Industry Volume Share (%), by Application 2025 & 2033
- Figure 75: Middle East and Africa Veterinary CT Scanner Industry Revenue (million), by End-User 2025 & 2033
- Figure 76: Middle East and Africa Veterinary CT Scanner Industry Volume (K Unit), by End-User 2025 & 2033
- Figure 77: Middle East and Africa Veterinary CT Scanner Industry Revenue Share (%), by End-User 2025 & 2033
- Figure 78: Middle East and Africa Veterinary CT Scanner Industry Volume Share (%), by End-User 2025 & 2033
- Figure 79: Middle East and Africa Veterinary CT Scanner Industry Revenue (million), by Country 2025 & 2033
- Figure 80: Middle East and Africa Veterinary CT Scanner Industry Volume (K Unit), by Country 2025 & 2033
- Figure 81: Middle East and Africa Veterinary CT Scanner Industry Revenue Share (%), by Country 2025 & 2033
- Figure 82: Middle East and Africa Veterinary CT Scanner Industry Volume Share (%), by Country 2025 & 2033
- Figure 83: South America Veterinary CT Scanner Industry Revenue (million), by Product Type 2025 & 2033
- Figure 84: South America Veterinary CT Scanner Industry Volume (K Unit), by Product Type 2025 & 2033
- Figure 85: South America Veterinary CT Scanner Industry Revenue Share (%), by Product Type 2025 & 2033
- Figure 86: South America Veterinary CT Scanner Industry Volume Share (%), by Product Type 2025 & 2033
- Figure 87: South America Veterinary CT Scanner Industry Revenue (million), by Animal Type 2025 & 2033
- Figure 88: South America Veterinary CT Scanner Industry Volume (K Unit), by Animal Type 2025 & 2033
- Figure 89: South America Veterinary CT Scanner Industry Revenue Share (%), by Animal Type 2025 & 2033
- Figure 90: South America Veterinary CT Scanner Industry Volume Share (%), by Animal Type 2025 & 2033
- Figure 91: South America Veterinary CT Scanner Industry Revenue (million), by Application 2025 & 2033
- Figure 92: South America Veterinary CT Scanner Industry Volume (K Unit), by Application 2025 & 2033
- Figure 93: South America Veterinary CT Scanner Industry Revenue Share (%), by Application 2025 & 2033
- Figure 94: South America Veterinary CT Scanner Industry Volume Share (%), by Application 2025 & 2033
- Figure 95: South America Veterinary CT Scanner Industry Revenue (million), by End-User 2025 & 2033
- Figure 96: South America Veterinary CT Scanner Industry Volume (K Unit), by End-User 2025 & 2033
- Figure 97: South America Veterinary CT Scanner Industry Revenue Share (%), by End-User 2025 & 2033
- Figure 98: South America Veterinary CT Scanner Industry Volume Share (%), by End-User 2025 & 2033
- Figure 99: South America Veterinary CT Scanner Industry Revenue (million), by Country 2025 & 2033
- Figure 100: South America Veterinary CT Scanner Industry Volume (K Unit), by Country 2025 & 2033
- Figure 101: South America Veterinary CT Scanner Industry Revenue Share (%), by Country 2025 & 2033
- Figure 102: South America Veterinary CT Scanner Industry Volume Share (%), by Country 2025 & 2033
List of Tables
- Table 1: Global Veterinary CT Scanner Industry Revenue million Forecast, by Product Type 2020 & 2033
- Table 2: Global Veterinary CT Scanner Industry Volume K Unit Forecast, by Product Type 2020 & 2033
- Table 3: Global Veterinary CT Scanner Industry Revenue million Forecast, by Animal Type 2020 & 2033
- Table 4: Global Veterinary CT Scanner Industry Volume K Unit Forecast, by Animal Type 2020 & 2033
- Table 5: Global Veterinary CT Scanner Industry Revenue million Forecast, by Application 2020 & 2033
- Table 6: Global Veterinary CT Scanner Industry Volume K Unit Forecast, by Application 2020 & 2033
- Table 7: Global Veterinary CT Scanner Industry Revenue million Forecast, by End-User 2020 & 2033
- Table 8: Global Veterinary CT Scanner Industry Volume K Unit Forecast, by End-User 2020 & 2033
- Table 9: Global Veterinary CT Scanner Industry Revenue million Forecast, by Region 2020 & 2033
- Table 10: Global Veterinary CT Scanner Industry Volume K Unit Forecast, by Region 2020 & 2033
- Table 11: Global Veterinary CT Scanner Industry Revenue million Forecast, by Product Type 2020 & 2033
- Table 12: Global Veterinary CT Scanner Industry Volume K Unit Forecast, by Product Type 2020 & 2033
- Table 13: Global Veterinary CT Scanner Industry Revenue million Forecast, by Animal Type 2020 & 2033
- Table 14: Global Veterinary CT Scanner Industry Volume K Unit Forecast, by Animal Type 2020 & 2033
- Table 15: Global Veterinary CT Scanner Industry Revenue million Forecast, by Application 2020 & 2033
- Table 16: Global Veterinary CT Scanner Industry Volume K Unit Forecast, by Application 2020 & 2033
- Table 17: Global Veterinary CT Scanner Industry Revenue million Forecast, by End-User 2020 & 2033
- Table 18: Global Veterinary CT Scanner Industry Volume K Unit Forecast, by End-User 2020 & 2033
- Table 19: Global Veterinary CT Scanner Industry Revenue million Forecast, by Country 2020 & 2033
- Table 20: Global Veterinary CT Scanner Industry Volume K Unit Forecast, by Country 2020 & 2033
- Table 21: United States Veterinary CT Scanner Industry Revenue (million) Forecast, by Application 2020 & 2033
- Table 22: United States Veterinary CT Scanner Industry Volume (K Unit) Forecast, by Application 2020 & 2033
- Table 23: Canada Veterinary CT Scanner Industry Revenue (million) Forecast, by Application 2020 & 2033
- Table 24: Canada Veterinary CT Scanner Industry Volume (K Unit) Forecast, by Application 2020 & 2033
- Table 25: Mexico Veterinary CT Scanner Industry Revenue (million) Forecast, by Application 2020 & 2033
- Table 26: Mexico Veterinary CT Scanner Industry Volume (K Unit) Forecast, by Application 2020 & 2033
- Table 27: Global Veterinary CT Scanner Industry Revenue million Forecast, by Product Type 2020 & 2033
- Table 28: Global Veterinary CT Scanner Industry Volume K Unit Forecast, by Product Type 2020 & 2033
- Table 29: Global Veterinary CT Scanner Industry Revenue million Forecast, by Animal Type 2020 & 2033
- Table 30: Global Veterinary CT Scanner Industry Volume K Unit Forecast, by Animal Type 2020 & 2033
- Table 31: Global Veterinary CT Scanner Industry Revenue million Forecast, by Application 2020 & 2033
- Table 32: Global Veterinary CT Scanner Industry Volume K Unit Forecast, by Application 2020 & 2033
- Table 33: Global Veterinary CT Scanner Industry Revenue million Forecast, by End-User 2020 & 2033
- Table 34: Global Veterinary CT Scanner Industry Volume K Unit Forecast, by End-User 2020 & 2033
- Table 35: Global Veterinary CT Scanner Industry Revenue million Forecast, by Country 2020 & 2033
- Table 36: Global Veterinary CT Scanner Industry Volume K Unit Forecast, by Country 2020 & 2033
- Table 37: Germany Veterinary CT Scanner Industry Revenue (million) Forecast, by Application 2020 & 2033
- Table 38: Germany Veterinary CT Scanner Industry Volume (K Unit) Forecast, by Application 2020 & 2033
- Table 39: United Kingdom Veterinary CT Scanner Industry Revenue (million) Forecast, by Application 2020 & 2033
- Table 40: United Kingdom Veterinary CT Scanner Industry Volume (K Unit) Forecast, by Application 2020 & 2033
- Table 41: France Veterinary CT Scanner Industry Revenue (million) Forecast, by Application 2020 & 2033
- Table 42: France Veterinary CT Scanner Industry Volume (K Unit) Forecast, by Application 2020 & 2033
- Table 43: Italy Veterinary CT Scanner Industry Revenue (million) Forecast, by Application 2020 & 2033
- Table 44: Italy Veterinary CT Scanner Industry Volume (K Unit) Forecast, by Application 2020 & 2033
- Table 45: Spain Veterinary CT Scanner Industry Revenue (million) Forecast, by Application 2020 & 2033
- Table 46: Spain Veterinary CT Scanner Industry Volume (K Unit) Forecast, by Application 2020 & 2033
- Table 47: Rest of Europe Veterinary CT Scanner Industry Revenue (million) Forecast, by Application 2020 & 2033
- Table 48: Rest of Europe Veterinary CT Scanner Industry Volume (K Unit) Forecast, by Application 2020 & 2033
- Table 49: Global Veterinary CT Scanner Industry Revenue million Forecast, by Product Type 2020 & 2033
- Table 50: Global Veterinary CT Scanner Industry Volume K Unit Forecast, by Product Type 2020 & 2033
- Table 51: Global Veterinary CT Scanner Industry Revenue million Forecast, by Animal Type 2020 & 2033
- Table 52: Global Veterinary CT Scanner Industry Volume K Unit Forecast, by Animal Type 2020 & 2033
- Table 53: Global Veterinary CT Scanner Industry Revenue million Forecast, by Application 2020 & 2033
- Table 54: Global Veterinary CT Scanner Industry Volume K Unit Forecast, by Application 2020 & 2033
- Table 55: Global Veterinary CT Scanner Industry Revenue million Forecast, by End-User 2020 & 2033
- Table 56: Global Veterinary CT Scanner Industry Volume K Unit Forecast, by End-User 2020 & 2033
- Table 57: Global Veterinary CT Scanner Industry Revenue million Forecast, by Country 2020 & 2033
- Table 58: Global Veterinary CT Scanner Industry Volume K Unit Forecast, by Country 2020 & 2033
- Table 59: China Veterinary CT Scanner Industry Revenue (million) Forecast, by Application 2020 & 2033
- Table 60: China Veterinary CT Scanner Industry Volume (K Unit) Forecast, by Application 2020 & 2033
- Table 61: Japan Veterinary CT Scanner Industry Revenue (million) Forecast, by Application 2020 & 2033
- Table 62: Japan Veterinary CT Scanner Industry Volume (K Unit) Forecast, by Application 2020 & 2033
- Table 63: India Veterinary CT Scanner Industry Revenue (million) Forecast, by Application 2020 & 2033
- Table 64: India Veterinary CT Scanner Industry Volume (K Unit) Forecast, by Application 2020 & 2033
- Table 65: Australia Veterinary CT Scanner Industry Revenue (million) Forecast, by Application 2020 & 2033
- Table 66: Australia Veterinary CT Scanner Industry Volume (K Unit) Forecast, by Application 2020 & 2033
- Table 67: South Korea Veterinary CT Scanner Industry Revenue (million) Forecast, by Application 2020 & 2033
- Table 68: South Korea Veterinary CT Scanner Industry Volume (K Unit) Forecast, by Application 2020 & 2033
- Table 69: Rest of Asia Pacific Veterinary CT Scanner Industry Revenue (million) Forecast, by Application 2020 & 2033
- Table 70: Rest of Asia Pacific Veterinary CT Scanner Industry Volume (K Unit) Forecast, by Application 2020 & 2033
- Table 71: Global Veterinary CT Scanner Industry Revenue million Forecast, by Product Type 2020 & 2033
- Table 72: Global Veterinary CT Scanner Industry Volume K Unit Forecast, by Product Type 2020 & 2033
- Table 73: Global Veterinary CT Scanner Industry Revenue million Forecast, by Animal Type 2020 & 2033
- Table 74: Global Veterinary CT Scanner Industry Volume K Unit Forecast, by Animal Type 2020 & 2033
- Table 75: Global Veterinary CT Scanner Industry Revenue million Forecast, by Application 2020 & 2033
- Table 76: Global Veterinary CT Scanner Industry Volume K Unit Forecast, by Application 2020 & 2033
- Table 77: Global Veterinary CT Scanner Industry Revenue million Forecast, by End-User 2020 & 2033
- Table 78: Global Veterinary CT Scanner Industry Volume K Unit Forecast, by End-User 2020 & 2033
- Table 79: Global Veterinary CT Scanner Industry Revenue million Forecast, by Country 2020 & 2033
- Table 80: Global Veterinary CT Scanner Industry Volume K Unit Forecast, by Country 2020 & 2033
- Table 81: GCC Veterinary CT Scanner Industry Revenue (million) Forecast, by Application 2020 & 2033
- Table 82: GCC Veterinary CT Scanner Industry Volume (K Unit) Forecast, by Application 2020 & 2033
- Table 83: South Africa Veterinary CT Scanner Industry Revenue (million) Forecast, by Application 2020 & 2033
- Table 84: South Africa Veterinary CT Scanner Industry Volume (K Unit) Forecast, by Application 2020 & 2033
- Table 85: Rest of Middle East and Africa Veterinary CT Scanner Industry Revenue (million) Forecast, by Application 2020 & 2033
- Table 86: Rest of Middle East and Africa Veterinary CT Scanner Industry Volume (K Unit) Forecast, by Application 2020 & 2033
- Table 87: Global Veterinary CT Scanner Industry Revenue million Forecast, by Product Type 2020 & 2033
- Table 88: Global Veterinary CT Scanner Industry Volume K Unit Forecast, by Product Type 2020 & 2033
- Table 89: Global Veterinary CT Scanner Industry Revenue million Forecast, by Animal Type 2020 & 2033
- Table 90: Global Veterinary CT Scanner Industry Volume K Unit Forecast, by Animal Type 2020 & 2033
- Table 91: Global Veterinary CT Scanner Industry Revenue million Forecast, by Application 2020 & 2033
- Table 92: Global Veterinary CT Scanner Industry Volume K Unit Forecast, by Application 2020 & 2033
- Table 93: Global Veterinary CT Scanner Industry Revenue million Forecast, by End-User 2020 & 2033
- Table 94: Global Veterinary CT Scanner Industry Volume K Unit Forecast, by End-User 2020 & 2033
- Table 95: Global Veterinary CT Scanner Industry Revenue million Forecast, by Country 2020 & 2033
- Table 96: Global Veterinary CT Scanner Industry Volume K Unit Forecast, by Country 2020 & 2033
- Table 97: Brazil Veterinary CT Scanner Industry Revenue (million) Forecast, by Application 2020 & 2033
- Table 98: Brazil Veterinary CT Scanner Industry Volume (K Unit) Forecast, by Application 2020 & 2033
- Table 99: Argentina Veterinary CT Scanner Industry Revenue (million) Forecast, by Application 2020 & 2033
- Table 100: Argentina Veterinary CT Scanner Industry Volume (K Unit) Forecast, by Application 2020 & 2033
- Table 101: Rest of South America Veterinary CT Scanner Industry Revenue (million) Forecast, by Application 2020 & 2033
- Table 102: Rest of South America Veterinary CT Scanner Industry Volume (K Unit) Forecast, by Application 2020 & 2033
Frequently Asked Questions
1. What is the projected Compound Annual Growth Rate (CAGR) of the Veterinary CT Scanner Industry?
The projected CAGR is approximately 7.15%.
2. Which companies are prominent players in the Veterinary CT Scanner Industry?
Key companies in the market include Samsung Electronics Co Ltd (Neurologica Corporation), Asto CT Inc, Canon Medical System Corporation, GE Healthcare, Isabelle Vets, Animage LLC, GNI ApS, Siemens Healthineers, Epica Animal Health.
3. What are the main segments of the Veterinary CT Scanner Industry?
The market segments include Product Type, Animal Type, Application, End-User.
4. Can you provide details about the market size?
The market size is estimated to be USD 449.71 million as of 2022.
5. What are some drivers contributing to market growth?
Increased Pet Ownership and Animal Health Expenditure; Rising Prevalence of Animal Diseases and Injuries.
6. What are the notable trends driving market growth?
Companion Animals Segment is Expected to Hold a Significant Market Share During the Forecast Period.
7. Are there any restraints impacting market growth?
High Cost of CT Imaging Devices; Low Animal Health Awareness in Emerging Markets.
8. Can you provide examples of recent developments in the market?
September 2022: A Fort Lauderdale, Florida-based referral hospital recently upgraded its treatment capabilities by installing a state-of-the-art Toshiba Aquilion 16 CT scanner, ensuring top-notch care for our beloved pets.
9. What pricing options are available for accessing the report?
Pricing options include single-user, multi-user, and enterprise licenses priced at USD 4750, USD 5250, and USD 8750 respectively.
10. Is the market size provided in terms of value or volume?
The market size is provided in terms of value, measured in million and volume, measured in K Unit.
11. Are there any specific market keywords associated with the report?
Yes, the market keyword associated with the report is "Veterinary CT Scanner Industry," which aids in identifying and referencing the specific market segment covered.
12. How do I determine which pricing option suits my needs best?
The pricing options vary based on user requirements and access needs. Individual users may opt for single-user licenses, while businesses requiring broader access may choose multi-user or enterprise licenses for cost-effective access to the report.
13. Are there any additional resources or data provided in the Veterinary CT Scanner Industry report?
While the report offers comprehensive insights, it's advisable to review the specific contents or supplementary materials provided to ascertain if additional resources or data are available.
14. How can I stay updated on further developments or reports in the Veterinary CT Scanner Industry?
To stay informed about further developments, trends, and reports in the Veterinary CT Scanner Industry, consider subscribing to industry newsletters, following relevant companies and organizations, or regularly checking reputable industry news sources and publications.
Methodology
Step 1 - Identification of Relevant Samples Size from Population Database


Step 2 - Approaches for Defining Global Market Size (Value, Volume* & Price*)

Note*: In applicable scenarios
Step 3 - Data Sources
Primary Research
- Web Analytics
- Survey Reports
- Research Institute
- Latest Research Reports
- Opinion Leaders
Secondary Research
- Annual Reports
- White Paper
- Latest Press Release
- Industry Association
- Paid Database
- Investor Presentations

Step 4 - Data Triangulation
Involves using different sources of information in order to increase the validity of a study
These sources are likely to be stakeholders in a program - participants, other researchers, program staff, other community members, and so on.
Then we put all data in single framework & apply various statistical tools to find out the dynamic on the market.
During the analysis stage, feedback from the stakeholder groups would be compared to determine areas of agreement as well as areas of divergence