
Key Insights
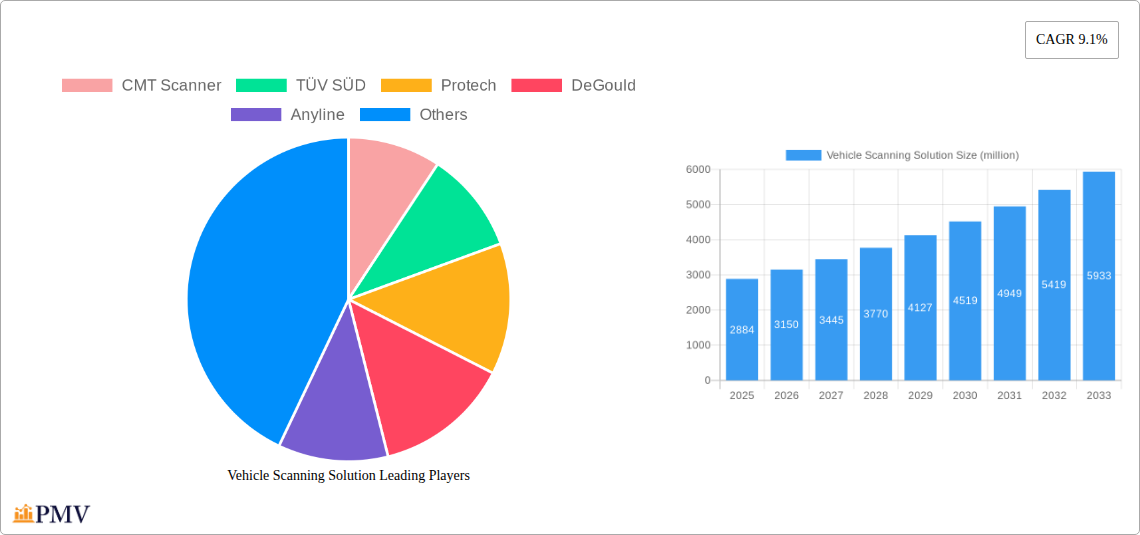
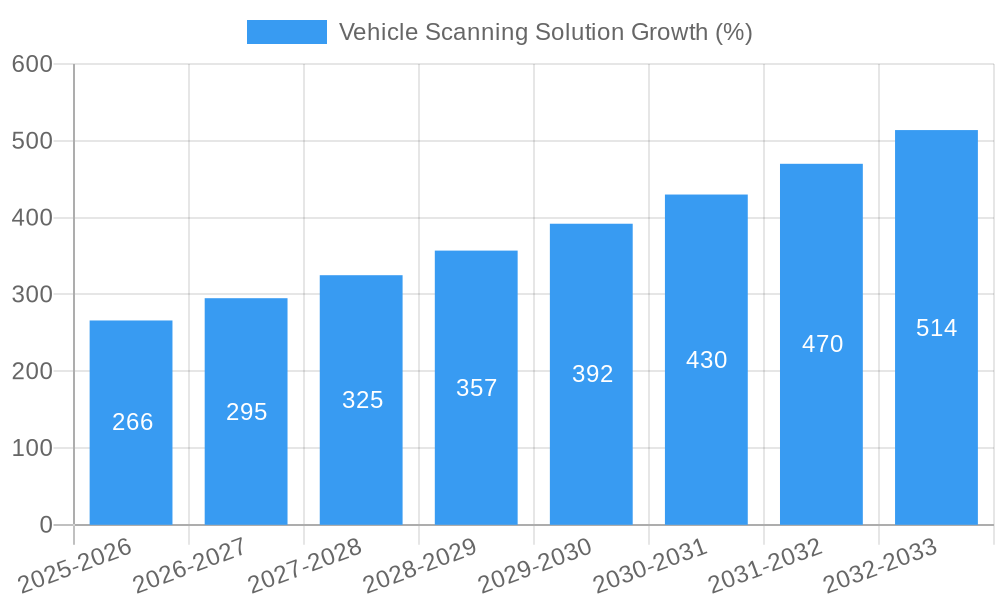
The vehicle scanning solutions market, currently valued at $2884 million in 2025, is projected to experience robust growth, driven by several key factors. The increasing adoption of advanced driver-assistance systems (ADAS) and autonomous driving technologies necessitates comprehensive vehicle inspections and diagnostics. Stringent government regulations regarding vehicle safety and emissions are further fueling demand for accurate and efficient scanning solutions. The rising prevalence of connected vehicles and the need for real-time data analysis for predictive maintenance contribute to market expansion. Moreover, technological advancements in sensor technology, artificial intelligence (AI), and machine learning (ML) are enhancing the capabilities of vehicle scanning systems, leading to improved accuracy and efficiency. This leads to faster diagnoses, reduced downtime, and optimized maintenance schedules, making these solutions attractive to vehicle manufacturers, repair shops, and fleet operators. Competition in the market is intense, with established players like TÜV SÜD and newer entrants like Anyline and AirPro Diagnostics vying for market share through innovation and strategic partnerships.
The market's compound annual growth rate (CAGR) of 9.1% from 2019 to 2033 suggests a significant growth trajectory. This growth is expected to be fueled by the continued integration of these technologies into various vehicle types, including passenger cars, commercial vehicles, and heavy-duty trucks. Furthermore, the expanding automotive industry in emerging economies will present lucrative opportunities for market expansion. However, factors like high initial investment costs for advanced scanning equipment and the need for skilled technicians could potentially restrain market growth to some degree. Nevertheless, the overall outlook for the vehicle scanning solutions market remains positive, driven by the increasing importance of vehicle safety, efficiency, and connectivity.
Vehicle Scanning Solution Market Report: 2019-2033
This comprehensive report provides an in-depth analysis of the global Vehicle Scanning Solution market, offering invaluable insights for businesses, investors, and stakeholders seeking to understand this rapidly evolving landscape. The study period covers 2019-2033, with 2025 serving as the base and estimated year. The forecast period spans 2025-2033, while the historical period encompasses 2019-2024. The report projects a market valuation exceeding $XX million by 2033, driven by significant technological advancements and increasing demand across diverse segments.
Vehicle Scanning Solution Market Structure & Competitive Dynamics
The global Vehicle Scanning Solution market exhibits a moderately concentrated structure, with key players like CMT Scanner, TÜV SÜD, Protech, and DeGould holding significant market share. The market's innovation ecosystem is robust, fueled by continuous advancements in sensor technology, AI, and data analytics. Regulatory frameworks, particularly concerning data privacy and vehicle safety, play a crucial role in shaping market dynamics. Product substitutes, such as traditional manual inspection methods, are gradually losing ground due to the efficiency and accuracy offered by vehicle scanning solutions. End-user trends point towards a growing preference for automated, data-driven solutions, driving market growth. M&A activity within the sector has been moderate in recent years, with deal values totaling approximately $XX million between 2019 and 2024. Key mergers and acquisitions have involved companies consolidating their market presence and expanding their product portfolios. For instance, a significant merger between two major players in 2022 resulted in a combined market share of approximately 15%, significantly impacting competitive dynamics.
- Market Concentration: Moderately concentrated, with top 5 players holding approximately XX% market share.
- Innovation Ecosystem: Robust, driven by advancements in AI, sensor technology, and data analytics.
- Regulatory Landscape: Significant influence from data privacy regulations and vehicle safety standards.
- M&A Activity: Moderate, with total deal values reaching approximately $XX million (2019-2024).
Vehicle Scanning Solution Industry Trends & Insights
The Vehicle Scanning Solution market is experiencing robust growth, with a projected Compound Annual Growth Rate (CAGR) of XX% during the forecast period (2025-2033). This growth is primarily driven by the increasing adoption of automated vehicle inspection systems across various sectors, including automotive manufacturing, automotive repair, and fleet management. Technological disruptions, such as the integration of AI and machine learning algorithms, are enhancing the accuracy and efficiency of vehicle scanning solutions. Consumer preferences are shifting towards more sophisticated and user-friendly solutions, creating new market opportunities. The competitive landscape is becoming increasingly dynamic, with new entrants and established players vying for market share. Market penetration has increased from XX% in 2019 to an estimated XX% in 2025. Key market growth drivers include stringent emission regulations, rising demand for vehicle safety, and the increasing adoption of connected car technologies.
Dominant Markets & Segments in Vehicle Scanning Solution
The North American market currently holds a dominant position in the Vehicle Scanning Solution market, accounting for approximately XX% of the global revenue in 2025. This dominance is attributed to several key factors:
- Strong Automotive Industry: A robust and technologically advanced automotive manufacturing and repair sector drives demand.
- Favorable Regulatory Environment: Supportive government regulations and policies promote the adoption of advanced vehicle inspection technologies.
- High Technological Adoption Rate: Early adoption of new technologies and a culture of innovation contribute to market growth.
Other regions, including Europe and Asia-Pacific, are expected to witness substantial growth in the coming years, driven by similar factors such as rising vehicle ownership, growing infrastructure development, and increased government investment in vehicle safety and emission control. The commercial vehicle segment currently represents the largest market share, benefiting from the need for regular inspections and maintenance in large fleets.
Vehicle Scanning Solution Product Innovations
Recent product innovations focus on enhancing the speed, accuracy, and versatility of vehicle scanning solutions. The integration of advanced AI algorithms allows for faster and more precise identification of defects, improving diagnostic capabilities. Miniaturization of sensors and improved data processing capabilities are making vehicle scanning solutions more portable and user-friendly. The development of cloud-based platforms is enhancing data management and analysis, providing valuable insights for vehicle maintenance and repair. These innovations address market needs for efficient, accurate, and cost-effective solutions.
Report Segmentation & Scope
This report segments the Vehicle Scanning Solution market based on several key parameters:
- By Technology: Optical, Ultrasonic, Laser, and others. Each technology segment exhibits varying growth projections based on technological advancements and market acceptance.
- By Application: Automotive Manufacturing, Automotive Repair, Fleet Management, and others. Market size and competitive intensity differ significantly across application segments.
- By Region: North America, Europe, Asia-Pacific, and Rest of the World. Regional variations in market size and growth are analyzed, considering economic factors, regulatory landscapes, and industry developments.
Key Drivers of Vehicle Scanning Solution Growth
Several key factors are fueling the growth of the Vehicle Scanning Solution market:
- Stringent Emission Regulations: Governments worldwide are imposing stricter emission standards, pushing the adoption of technologies that ensure vehicle compliance.
- Rising Demand for Vehicle Safety: Growing consumer awareness of vehicle safety features drives adoption of advanced inspection systems.
- Technological Advancements: Continuous innovations in sensor technology, AI, and data analytics are enhancing the accuracy and efficiency of vehicle scanning solutions.
Challenges in the Vehicle Scanning Solution Sector
Despite the positive outlook, the Vehicle Scanning Solution market faces several challenges:
- High Initial Investment Costs: The high cost of acquiring and implementing advanced vehicle scanning systems can deter some smaller players.
- Data Security Concerns: Protecting sensitive vehicle data poses a significant challenge, particularly in cloud-based solutions.
- Competition from Established Players: Established players in the automotive industry may pose a challenge to new entrants. These challenges impact market adoption and overall growth potential.
Leading Players in the Vehicle Scanning Solution Market
- CMT Scanner
- TÜV SÜD
- Protech
- DeGould
- Anyline
- AirPro Diagnostics
- Carscan
- VSSTA
- Uveye
- Nestor Technologies
- Polimek
- Ravin
- Twyla Tech
- Surface Scan
- Proovstation
- Innova
Key Developments in Vehicle Scanning Solution Sector
- January 2023: CMT Scanner launched a new AI-powered vehicle scanning solution, expanding its product portfolio.
- March 2024: A strategic partnership between TÜV SÜD and Protech resulted in the development of a joint vehicle inspection service.
- (Add further relevant developments with dates here)
Strategic Vehicle Scanning Solution Market Outlook
The Vehicle Scanning Solution market is poised for continued growth, driven by the aforementioned factors. Strategic opportunities exist for companies focused on developing innovative, user-friendly, and cost-effective solutions. Expansion into emerging markets and strategic partnerships will be crucial for success. The integration of advanced technologies, such as blockchain and IoT, offers further opportunities for innovation and market differentiation. The overall market presents strong growth prospects for those capitalizing on evolving technologies and market demands.
Vehicle Scanning Solution Segmentation
-
1. Application
- 1.1. Auto Manufacturers
- 1.2. Auto Dealers
- 1.3. Auto Repair Shop
- 1.4. Others
-
2. Type
- 2.1. Hardware-based Solutions
- 2.2. Software-based Solutions
Vehicle Scanning Solution Segmentation By Geography
-
1. North America
- 1.1. United States
- 1.2. Canada
- 1.3. Mexico
-
2. South America
- 2.1. Brazil
- 2.2. Argentina
- 2.3. Rest of South America
-
3. Europe
- 3.1. United Kingdom
- 3.2. Germany
- 3.3. France
- 3.4. Italy
- 3.5. Spain
- 3.6. Russia
- 3.7. Benelux
- 3.8. Nordics
- 3.9. Rest of Europe
-
4. Middle East & Africa
- 4.1. Turkey
- 4.2. Israel
- 4.3. GCC
- 4.4. North Africa
- 4.5. South Africa
- 4.6. Rest of Middle East & Africa
-
5. Asia Pacific
- 5.1. China
- 5.2. India
- 5.3. Japan
- 5.4. South Korea
- 5.5. ASEAN
- 5.6. Oceania
- 5.7. Rest of Asia Pacific

Vehicle Scanning Solution REPORT HIGHLIGHTS
| Aspects | Details |
|---|---|
| Study Period | 2019-2033 |
| Base Year | 2024 |
| Estimated Year | 2025 |
| Forecast Period | 2025-2033 |
| Historical Period | 2019-2024 |
| Growth Rate | CAGR of 9.1% from 2019-2033 |
| Segmentation |
|
Table of Contents
- 1. Introduction
- 1.1. Research Scope
- 1.2. Market Segmentation
- 1.3. Research Methodology
- 1.4. Definitions and Assumptions
- 2. Executive Summary
- 2.1. Introduction
- 3. Market Dynamics
- 3.1. Introduction
- 3.2. Market Drivers
- 3.3. Market Restrains
- 3.4. Market Trends
- 4. Market Factor Analysis
- 4.1. Porters Five Forces
- 4.2. Supply/Value Chain
- 4.3. PESTEL analysis
- 4.4. Market Entropy
- 4.5. Patent/Trademark Analysis
- 5. Global Vehicle Scanning Solution Analysis, Insights and Forecast, 2019-2031
- 5.1. Market Analysis, Insights and Forecast - by Application
- 5.1.1. Auto Manufacturers
- 5.1.2. Auto Dealers
- 5.1.3. Auto Repair Shop
- 5.1.4. Others
- 5.2. Market Analysis, Insights and Forecast - by Type
- 5.2.1. Hardware-based Solutions
- 5.2.2. Software-based Solutions
- 5.3. Market Analysis, Insights and Forecast - by Region
- 5.3.1. North America
- 5.3.2. South America
- 5.3.3. Europe
- 5.3.4. Middle East & Africa
- 5.3.5. Asia Pacific
- 5.1. Market Analysis, Insights and Forecast - by Application
- 6. North America Vehicle Scanning Solution Analysis, Insights and Forecast, 2019-2031
- 6.1. Market Analysis, Insights and Forecast - by Application
- 6.1.1. Auto Manufacturers
- 6.1.2. Auto Dealers
- 6.1.3. Auto Repair Shop
- 6.1.4. Others
- 6.2. Market Analysis, Insights and Forecast - by Type
- 6.2.1. Hardware-based Solutions
- 6.2.2. Software-based Solutions
- 6.1. Market Analysis, Insights and Forecast - by Application
- 7. South America Vehicle Scanning Solution Analysis, Insights and Forecast, 2019-2031
- 7.1. Market Analysis, Insights and Forecast - by Application
- 7.1.1. Auto Manufacturers
- 7.1.2. Auto Dealers
- 7.1.3. Auto Repair Shop
- 7.1.4. Others
- 7.2. Market Analysis, Insights and Forecast - by Type
- 7.2.1. Hardware-based Solutions
- 7.2.2. Software-based Solutions
- 7.1. Market Analysis, Insights and Forecast - by Application
- 8. Europe Vehicle Scanning Solution Analysis, Insights and Forecast, 2019-2031
- 8.1. Market Analysis, Insights and Forecast - by Application
- 8.1.1. Auto Manufacturers
- 8.1.2. Auto Dealers
- 8.1.3. Auto Repair Shop
- 8.1.4. Others
- 8.2. Market Analysis, Insights and Forecast - by Type
- 8.2.1. Hardware-based Solutions
- 8.2.2. Software-based Solutions
- 8.1. Market Analysis, Insights and Forecast - by Application
- 9. Middle East & Africa Vehicle Scanning Solution Analysis, Insights and Forecast, 2019-2031
- 9.1. Market Analysis, Insights and Forecast - by Application
- 9.1.1. Auto Manufacturers
- 9.1.2. Auto Dealers
- 9.1.3. Auto Repair Shop
- 9.1.4. Others
- 9.2. Market Analysis, Insights and Forecast - by Type
- 9.2.1. Hardware-based Solutions
- 9.2.2. Software-based Solutions
- 9.1. Market Analysis, Insights and Forecast - by Application
- 10. Asia Pacific Vehicle Scanning Solution Analysis, Insights and Forecast, 2019-2031
- 10.1. Market Analysis, Insights and Forecast - by Application
- 10.1.1. Auto Manufacturers
- 10.1.2. Auto Dealers
- 10.1.3. Auto Repair Shop
- 10.1.4. Others
- 10.2. Market Analysis, Insights and Forecast - by Type
- 10.2.1. Hardware-based Solutions
- 10.2.2. Software-based Solutions
- 10.1. Market Analysis, Insights and Forecast - by Application
- 11. Competitive Analysis
- 11.1. Global Market Share Analysis 2024
- 11.2. Company Profiles
- 11.2.1 CMT Scanner
- 11.2.1.1. Overview
- 11.2.1.2. Products
- 11.2.1.3. SWOT Analysis
- 11.2.1.4. Recent Developments
- 11.2.1.5. Financials (Based on Availability)
- 11.2.2 TÜV SÜD
- 11.2.2.1. Overview
- 11.2.2.2. Products
- 11.2.2.3. SWOT Analysis
- 11.2.2.4. Recent Developments
- 11.2.2.5. Financials (Based on Availability)
- 11.2.3 Protech
- 11.2.3.1. Overview
- 11.2.3.2. Products
- 11.2.3.3. SWOT Analysis
- 11.2.3.4. Recent Developments
- 11.2.3.5. Financials (Based on Availability)
- 11.2.4 DeGould
- 11.2.4.1. Overview
- 11.2.4.2. Products
- 11.2.4.3. SWOT Analysis
- 11.2.4.4. Recent Developments
- 11.2.4.5. Financials (Based on Availability)
- 11.2.5 Anyline
- 11.2.5.1. Overview
- 11.2.5.2. Products
- 11.2.5.3. SWOT Analysis
- 11.2.5.4. Recent Developments
- 11.2.5.5. Financials (Based on Availability)
- 11.2.6 AirPro Diagnostics
- 11.2.6.1. Overview
- 11.2.6.2. Products
- 11.2.6.3. SWOT Analysis
- 11.2.6.4. Recent Developments
- 11.2.6.5. Financials (Based on Availability)
- 11.2.7 Carscan
- 11.2.7.1. Overview
- 11.2.7.2. Products
- 11.2.7.3. SWOT Analysis
- 11.2.7.4. Recent Developments
- 11.2.7.5. Financials (Based on Availability)
- 11.2.8 VSSTA
- 11.2.8.1. Overview
- 11.2.8.2. Products
- 11.2.8.3. SWOT Analysis
- 11.2.8.4. Recent Developments
- 11.2.8.5. Financials (Based on Availability)
- 11.2.9 Uveye
- 11.2.9.1. Overview
- 11.2.9.2. Products
- 11.2.9.3. SWOT Analysis
- 11.2.9.4. Recent Developments
- 11.2.9.5. Financials (Based on Availability)
- 11.2.10 Nestor Technologies
- 11.2.10.1. Overview
- 11.2.10.2. Products
- 11.2.10.3. SWOT Analysis
- 11.2.10.4. Recent Developments
- 11.2.10.5. Financials (Based on Availability)
- 11.2.11 Polimek
- 11.2.11.1. Overview
- 11.2.11.2. Products
- 11.2.11.3. SWOT Analysis
- 11.2.11.4. Recent Developments
- 11.2.11.5. Financials (Based on Availability)
- 11.2.12 Ravin
- 11.2.12.1. Overview
- 11.2.12.2. Products
- 11.2.12.3. SWOT Analysis
- 11.2.12.4. Recent Developments
- 11.2.12.5. Financials (Based on Availability)
- 11.2.13 Twyla Tech
- 11.2.13.1. Overview
- 11.2.13.2. Products
- 11.2.13.3. SWOT Analysis
- 11.2.13.4. Recent Developments
- 11.2.13.5. Financials (Based on Availability)
- 11.2.14 Surface Scan
- 11.2.14.1. Overview
- 11.2.14.2. Products
- 11.2.14.3. SWOT Analysis
- 11.2.14.4. Recent Developments
- 11.2.14.5. Financials (Based on Availability)
- 11.2.15 Proovstation
- 11.2.15.1. Overview
- 11.2.15.2. Products
- 11.2.15.3. SWOT Analysis
- 11.2.15.4. Recent Developments
- 11.2.15.5. Financials (Based on Availability)
- 11.2.16 Innova
- 11.2.16.1. Overview
- 11.2.16.2. Products
- 11.2.16.3. SWOT Analysis
- 11.2.16.4. Recent Developments
- 11.2.16.5. Financials (Based on Availability)
- 11.2.1 CMT Scanner
List of Figures
- Figure 1: Global Vehicle Scanning Solution Revenue Breakdown (million, %) by Region 2024 & 2032
- Figure 2: North America Vehicle Scanning Solution Revenue (million), by Application 2024 & 2032
- Figure 3: North America Vehicle Scanning Solution Revenue Share (%), by Application 2024 & 2032
- Figure 4: North America Vehicle Scanning Solution Revenue (million), by Type 2024 & 2032
- Figure 5: North America Vehicle Scanning Solution Revenue Share (%), by Type 2024 & 2032
- Figure 6: North America Vehicle Scanning Solution Revenue (million), by Country 2024 & 2032
- Figure 7: North America Vehicle Scanning Solution Revenue Share (%), by Country 2024 & 2032
- Figure 8: South America Vehicle Scanning Solution Revenue (million), by Application 2024 & 2032
- Figure 9: South America Vehicle Scanning Solution Revenue Share (%), by Application 2024 & 2032
- Figure 10: South America Vehicle Scanning Solution Revenue (million), by Type 2024 & 2032
- Figure 11: South America Vehicle Scanning Solution Revenue Share (%), by Type 2024 & 2032
- Figure 12: South America Vehicle Scanning Solution Revenue (million), by Country 2024 & 2032
- Figure 13: South America Vehicle Scanning Solution Revenue Share (%), by Country 2024 & 2032
- Figure 14: Europe Vehicle Scanning Solution Revenue (million), by Application 2024 & 2032
- Figure 15: Europe Vehicle Scanning Solution Revenue Share (%), by Application 2024 & 2032
- Figure 16: Europe Vehicle Scanning Solution Revenue (million), by Type 2024 & 2032
- Figure 17: Europe Vehicle Scanning Solution Revenue Share (%), by Type 2024 & 2032
- Figure 18: Europe Vehicle Scanning Solution Revenue (million), by Country 2024 & 2032
- Figure 19: Europe Vehicle Scanning Solution Revenue Share (%), by Country 2024 & 2032
- Figure 20: Middle East & Africa Vehicle Scanning Solution Revenue (million), by Application 2024 & 2032
- Figure 21: Middle East & Africa Vehicle Scanning Solution Revenue Share (%), by Application 2024 & 2032
- Figure 22: Middle East & Africa Vehicle Scanning Solution Revenue (million), by Type 2024 & 2032
- Figure 23: Middle East & Africa Vehicle Scanning Solution Revenue Share (%), by Type 2024 & 2032
- Figure 24: Middle East & Africa Vehicle Scanning Solution Revenue (million), by Country 2024 & 2032
- Figure 25: Middle East & Africa Vehicle Scanning Solution Revenue Share (%), by Country 2024 & 2032
- Figure 26: Asia Pacific Vehicle Scanning Solution Revenue (million), by Application 2024 & 2032
- Figure 27: Asia Pacific Vehicle Scanning Solution Revenue Share (%), by Application 2024 & 2032
- Figure 28: Asia Pacific Vehicle Scanning Solution Revenue (million), by Type 2024 & 2032
- Figure 29: Asia Pacific Vehicle Scanning Solution Revenue Share (%), by Type 2024 & 2032
- Figure 30: Asia Pacific Vehicle Scanning Solution Revenue (million), by Country 2024 & 2032
- Figure 31: Asia Pacific Vehicle Scanning Solution Revenue Share (%), by Country 2024 & 2032
List of Tables
- Table 1: Global Vehicle Scanning Solution Revenue million Forecast, by Region 2019 & 2032
- Table 2: Global Vehicle Scanning Solution Revenue million Forecast, by Application 2019 & 2032
- Table 3: Global Vehicle Scanning Solution Revenue million Forecast, by Type 2019 & 2032
- Table 4: Global Vehicle Scanning Solution Revenue million Forecast, by Region 2019 & 2032
- Table 5: Global Vehicle Scanning Solution Revenue million Forecast, by Application 2019 & 2032
- Table 6: Global Vehicle Scanning Solution Revenue million Forecast, by Type 2019 & 2032
- Table 7: Global Vehicle Scanning Solution Revenue million Forecast, by Country 2019 & 2032
- Table 8: United States Vehicle Scanning Solution Revenue (million) Forecast, by Application 2019 & 2032
- Table 9: Canada Vehicle Scanning Solution Revenue (million) Forecast, by Application 2019 & 2032
- Table 10: Mexico Vehicle Scanning Solution Revenue (million) Forecast, by Application 2019 & 2032
- Table 11: Global Vehicle Scanning Solution Revenue million Forecast, by Application 2019 & 2032
- Table 12: Global Vehicle Scanning Solution Revenue million Forecast, by Type 2019 & 2032
- Table 13: Global Vehicle Scanning Solution Revenue million Forecast, by Country 2019 & 2032
- Table 14: Brazil Vehicle Scanning Solution Revenue (million) Forecast, by Application 2019 & 2032
- Table 15: Argentina Vehicle Scanning Solution Revenue (million) Forecast, by Application 2019 & 2032
- Table 16: Rest of South America Vehicle Scanning Solution Revenue (million) Forecast, by Application 2019 & 2032
- Table 17: Global Vehicle Scanning Solution Revenue million Forecast, by Application 2019 & 2032
- Table 18: Global Vehicle Scanning Solution Revenue million Forecast, by Type 2019 & 2032
- Table 19: Global Vehicle Scanning Solution Revenue million Forecast, by Country 2019 & 2032
- Table 20: United Kingdom Vehicle Scanning Solution Revenue (million) Forecast, by Application 2019 & 2032
- Table 21: Germany Vehicle Scanning Solution Revenue (million) Forecast, by Application 2019 & 2032
- Table 22: France Vehicle Scanning Solution Revenue (million) Forecast, by Application 2019 & 2032
- Table 23: Italy Vehicle Scanning Solution Revenue (million) Forecast, by Application 2019 & 2032
- Table 24: Spain Vehicle Scanning Solution Revenue (million) Forecast, by Application 2019 & 2032
- Table 25: Russia Vehicle Scanning Solution Revenue (million) Forecast, by Application 2019 & 2032
- Table 26: Benelux Vehicle Scanning Solution Revenue (million) Forecast, by Application 2019 & 2032
- Table 27: Nordics Vehicle Scanning Solution Revenue (million) Forecast, by Application 2019 & 2032
- Table 28: Rest of Europe Vehicle Scanning Solution Revenue (million) Forecast, by Application 2019 & 2032
- Table 29: Global Vehicle Scanning Solution Revenue million Forecast, by Application 2019 & 2032
- Table 30: Global Vehicle Scanning Solution Revenue million Forecast, by Type 2019 & 2032
- Table 31: Global Vehicle Scanning Solution Revenue million Forecast, by Country 2019 & 2032
- Table 32: Turkey Vehicle Scanning Solution Revenue (million) Forecast, by Application 2019 & 2032
- Table 33: Israel Vehicle Scanning Solution Revenue (million) Forecast, by Application 2019 & 2032
- Table 34: GCC Vehicle Scanning Solution Revenue (million) Forecast, by Application 2019 & 2032
- Table 35: North Africa Vehicle Scanning Solution Revenue (million) Forecast, by Application 2019 & 2032
- Table 36: South Africa Vehicle Scanning Solution Revenue (million) Forecast, by Application 2019 & 2032
- Table 37: Rest of Middle East & Africa Vehicle Scanning Solution Revenue (million) Forecast, by Application 2019 & 2032
- Table 38: Global Vehicle Scanning Solution Revenue million Forecast, by Application 2019 & 2032
- Table 39: Global Vehicle Scanning Solution Revenue million Forecast, by Type 2019 & 2032
- Table 40: Global Vehicle Scanning Solution Revenue million Forecast, by Country 2019 & 2032
- Table 41: China Vehicle Scanning Solution Revenue (million) Forecast, by Application 2019 & 2032
- Table 42: India Vehicle Scanning Solution Revenue (million) Forecast, by Application 2019 & 2032
- Table 43: Japan Vehicle Scanning Solution Revenue (million) Forecast, by Application 2019 & 2032
- Table 44: South Korea Vehicle Scanning Solution Revenue (million) Forecast, by Application 2019 & 2032
- Table 45: ASEAN Vehicle Scanning Solution Revenue (million) Forecast, by Application 2019 & 2032
- Table 46: Oceania Vehicle Scanning Solution Revenue (million) Forecast, by Application 2019 & 2032
- Table 47: Rest of Asia Pacific Vehicle Scanning Solution Revenue (million) Forecast, by Application 2019 & 2032
Frequently Asked Questions
1. What is the projected Compound Annual Growth Rate (CAGR) of the Vehicle Scanning Solution?
The projected CAGR is approximately 9.1%.
2. Which companies are prominent players in the Vehicle Scanning Solution?
Key companies in the market include CMT Scanner, TÜV SÜD, Protech, DeGould, Anyline, AirPro Diagnostics, Carscan, VSSTA, Uveye, Nestor Technologies, Polimek, Ravin, Twyla Tech, Surface Scan, Proovstation, Innova.
3. What are the main segments of the Vehicle Scanning Solution?
The market segments include Application, Type.
4. Can you provide details about the market size?
The market size is estimated to be USD 2884 million as of 2022.
5. What are some drivers contributing to market growth?
N/A
6. What are the notable trends driving market growth?
N/A
7. Are there any restraints impacting market growth?
N/A
8. Can you provide examples of recent developments in the market?
N/A
9. What pricing options are available for accessing the report?
Pricing options include single-user, multi-user, and enterprise licenses priced at USD 3950.00, USD 5925.00, and USD 7900.00 respectively.
10. Is the market size provided in terms of value or volume?
The market size is provided in terms of value, measured in million.
11. Are there any specific market keywords associated with the report?
Yes, the market keyword associated with the report is "Vehicle Scanning Solution," which aids in identifying and referencing the specific market segment covered.
12. How do I determine which pricing option suits my needs best?
The pricing options vary based on user requirements and access needs. Individual users may opt for single-user licenses, while businesses requiring broader access may choose multi-user or enterprise licenses for cost-effective access to the report.
13. Are there any additional resources or data provided in the Vehicle Scanning Solution report?
While the report offers comprehensive insights, it's advisable to review the specific contents or supplementary materials provided to ascertain if additional resources or data are available.
14. How can I stay updated on further developments or reports in the Vehicle Scanning Solution?
To stay informed about further developments, trends, and reports in the Vehicle Scanning Solution, consider subscribing to industry newsletters, following relevant companies and organizations, or regularly checking reputable industry news sources and publications.
Methodology
Step 1 - Identification of Relevant Samples Size from Population Database


Step 2 - Approaches for Defining Global Market Size (Value, Volume* & Price*)

Note*: In applicable scenarios
Step 3 - Data Sources
Primary Research
- Web Analytics
- Survey Reports
- Research Institute
- Latest Research Reports
- Opinion Leaders
Secondary Research
- Annual Reports
- White Paper
- Latest Press Release
- Industry Association
- Paid Database
- Investor Presentations

Step 4 - Data Triangulation
Involves using different sources of information in order to increase the validity of a study
These sources are likely to be stakeholders in a program - participants, other researchers, program staff, other community members, and so on.
Then we put all data in single framework & apply various statistical tools to find out the dynamic on the market.
During the analysis stage, feedback from the stakeholder groups would be compared to determine areas of agreement as well as areas of divergence


