

Key Insights
The global Variable Message Signs (VMS) market for Intelligent Transportation Systems (ITS) is experiencing robust expansion, projected to reach USD 1432 million by 2025, with a significant Compound Annual Growth Rate (CAGR) of 7.9% expected throughout the forecast period of 2025-2033. This growth is propelled by a confluence of factors, primarily the increasing adoption of smart city initiatives worldwide, which necessitate real-time traffic management and dissemination of critical information to commuters. Governments are heavily investing in upgrading existing transportation infrastructure and developing new intelligent systems to enhance road safety, reduce congestion, and improve overall transportation efficiency. The rising number of vehicles on roadways globally also contributes to the demand for VMS, as they play a crucial role in managing traffic flow and alerting drivers to potential hazards or disruptions. Furthermore, the continuous technological advancements in VMS, such as enhanced visibility, durability, and connectivity features, are driving market penetration across various transportation applications.
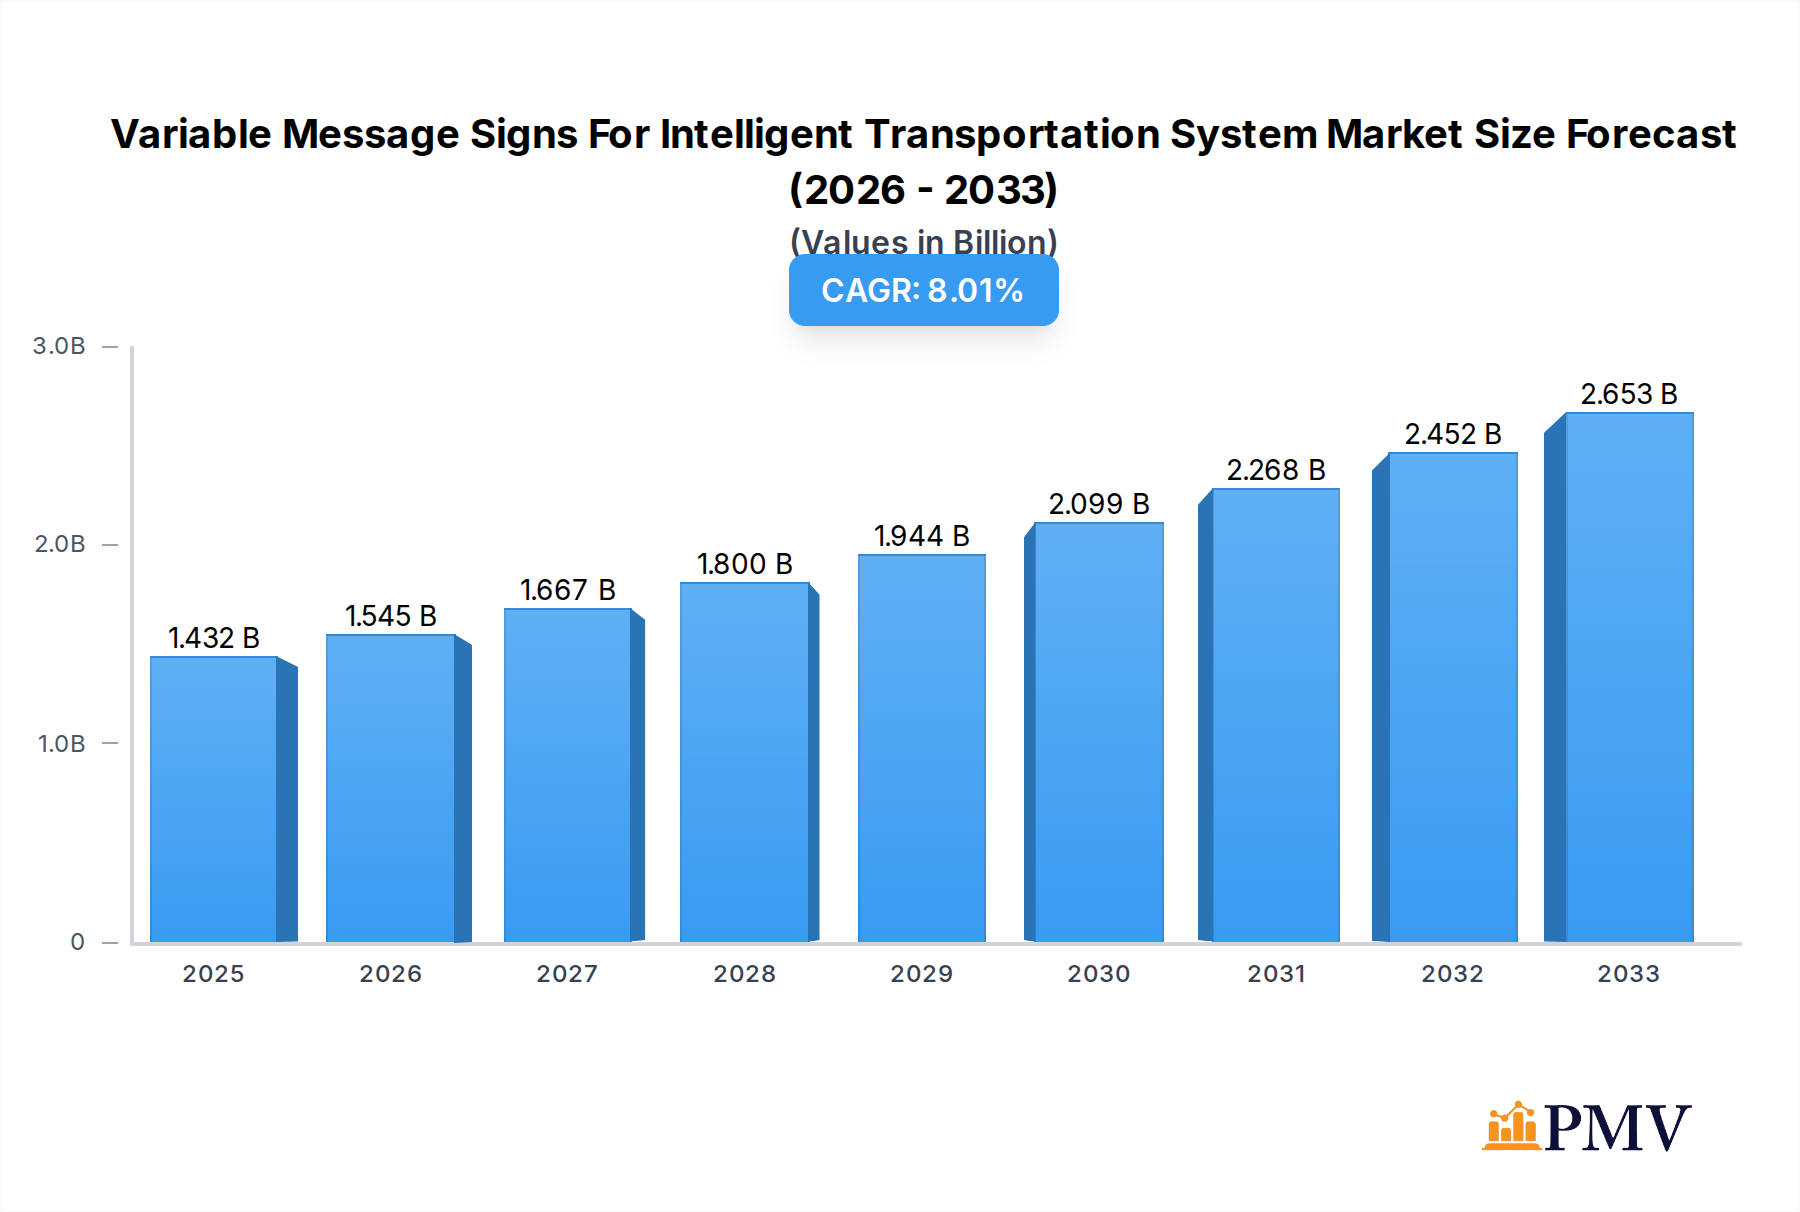
Variable Message Signs For Intelligent Transportation System Market Size (In Billion)
The market is segmented by application into Railways, Airports, Roadways, and Others, with Roadways expected to dominate due to the vast network of highways and urban roads requiring constant monitoring and communication. By type, Electro-Mechanical Signs, Reflective Flip-Disk Signs, and Light Emitting Signs constitute the key segments. Light Emitting Signs, particularly LED-based displays, are gaining substantial traction due to their superior brightness, energy efficiency, and versatility in displaying dynamic information. Key industry players like 3M Company, Daktronics, and SWARCO Group are actively involved in research and development, focusing on innovative solutions and strategic collaborations to capture a larger market share. While the market is poised for strong growth, potential challenges such as high initial investment costs and the need for standardized communication protocols could influence the pace of adoption in certain regions. Nevertheless, the overarching trend towards smarter, safer, and more efficient transportation systems ensures a bright future for the VMS market within ITS.

Variable Message Signs For Intelligent Transportation System Company Market Share
This comprehensive report provides an in-depth analysis of the global Variable Message Signs (VMS) for Intelligent Transportation Systems (ITS) market. Spanning the historical period of 2019–2024, the base year of 2025, and a robust forecast period from 2025–2033, this study offers critical insights into market dynamics, growth drivers, competitive landscape, and future opportunities. We delve into the technological advancements, industry trends, and evolving end-user demands shaping the VMS for ITS market, a crucial component of modern transportation infrastructure.
Variable Message Signs For Intelligent Transportation System Market Structure & Competitive Dynamics
The global Variable Message Signs (VMS) for Intelligent Transportation Systems (ITS) market exhibits a moderately concentrated structure, with key players dominating specific application segments and geographical regions. Leading companies like Daktronics, 3M Company, and SWARCO Group have established strong market positions through continuous innovation and strategic investments. The innovation ecosystem is characterized by rapid advancements in display technologies, connectivity, and software integration, driven by the increasing demand for real-time traffic management and safety solutions. Regulatory frameworks, while largely supportive of ITS deployment, can vary significantly across countries, impacting market entry and adoption rates. Product substitutes exist, primarily in the form of static signage, but their limitations in providing dynamic information make them less competitive in advanced ITS deployments. End-user trends strongly favor VMS solutions that offer enhanced safety, improved traffic flow, and reduced congestion. Mergers and acquisitions (M&A) are a significant aspect of market dynamics, with recent deals in the hundreds of millions of dollars aimed at consolidating market share, acquiring new technologies, and expanding geographical reach. For instance, a key acquisition in the last three years involved a $250 million deal to integrate advanced sensor technology into VMS solutions. The market share of the top five players is estimated to be around 60%, indicating a degree of consolidation.
- Market Concentration: Moderately concentrated, with a few key players holding significant market share.
- Innovation Ecosystem: Robust, driven by advancements in LED technology, IoT integration, and AI for traffic analysis.
- Regulatory Frameworks: Supportive of ITS but with regional variations influencing adoption.
- Product Substitutes: Limited in dynamic information delivery compared to VMS.
- End-User Trends: Focus on safety, efficiency, and real-time data.
- M&A Activities: Active, with deals in the hundreds of millions of dollars to enhance technological capabilities and market reach.
- Market Share (Top 5 Players): Approximately 60%.
Variable Message Signs For Intelligent Transportation System Industry Trends & Insights
The Variable Message Signs (VMS) for Intelligent Transportation Systems (ITS) market is poised for substantial growth, projected to achieve a Compound Annual Growth Rate (CAGR) of 12.5% over the forecast period. This expansion is primarily fueled by the escalating global investments in intelligent transportation infrastructure, aimed at enhancing road safety, optimizing traffic flow, and reducing environmental impact. Governments worldwide are increasingly prioritizing smart city initiatives and the deployment of connected vehicle technologies, which directly drives the demand for advanced VMS solutions. The adoption of Light Emitting Signs (LES), particularly full-color LED displays, is rapidly increasing due to their superior visibility, energy efficiency, and ability to display dynamic graphics and messages. These signs are becoming indispensable for real-time incident management, traffic diversion, and public information dissemination.
Technological disruptions are playing a pivotal role in shaping the VMS market. The integration of the Internet of Things (IoT) is enabling VMS to communicate seamlessly with other ITS components, traffic management centers, and even connected vehicles. This interconnectedness allows for more responsive and proactive traffic management strategies. Furthermore, advancements in artificial intelligence (AI) and machine learning are being leveraged to analyze traffic patterns, predict congestion, and optimize the information displayed on VMS in real-time. The development of advanced algorithms can now enable VMS to dynamically adjust messages based on live traffic conditions, weather alerts, and emergency situations, thereby maximizing their effectiveness.
Consumer preferences are shifting towards VMS that offer greater clarity, durability, and lower maintenance costs. The demand for solar-powered VMS is also growing in remote or off-grid locations, aligning with sustainability goals. The competitive dynamics within the industry are intense, characterized by continuous product innovation, strategic partnerships, and a focus on providing end-to-end solutions encompassing hardware, software, and installation services. Companies are investing heavily in research and development to improve the performance, reliability, and cost-effectiveness of their VMS offerings.
The market penetration of VMS in developing economies is expected to witness a significant surge as these regions invest heavily in upgrading their transportation infrastructure to accommodate growing populations and economic activity. The "Others" application segment, encompassing areas like ports, industrial zones, and university campuses, is also showing promising growth as organizations recognize the benefits of localized traffic management and safety information. The market is moving beyond basic message displays to sophisticated platforms that can integrate with broader smart city ecosystems. The total market value is expected to reach approximately $15 billion by 2033, a substantial increase from the $5 billion estimated for 2025. This growth underscores the critical role VMS plays in the evolution of intelligent transportation.
Dominant Markets & Segments in Variable Message Signs For Intelligent Transportation System
The Roadways application segment is unequivocally the dominant force within the global Variable Message Signs (VMS) for Intelligent Transportation Systems (ITS) market. This dominance stems from the sheer scale of road networks worldwide, the continuous need for real-time traffic management, and the critical importance of public safety on highways and urban thoroughfares. Governments and transportation authorities consistently allocate substantial budgets towards enhancing road infrastructure and implementing ITS solutions to combat congestion, reduce accidents, and improve the commuter experience.
Key drivers for the dominance of the Roadways segment include:
- Extensive Infrastructure: The vast network of highways, expressways, and urban roads necessitates widespread VMS deployment for guidance, warnings, and incident management.
- Traffic Congestion: Chronic traffic congestion in urban and suburban areas makes VMS an essential tool for dynamic route guidance and traffic flow optimization.
- Road Safety Initiatives: Governments worldwide are implementing stringent road safety measures, with VMS playing a crucial role in alerting drivers to hazards, speed limits, and emergency situations.
- Tolling and Lane Management: VMS are integral to dynamic tolling systems and variable lane management strategies, optimizing road capacity.
- Smart City Integration: As cities become "smarter," VMS are key components of integrated transportation networks, communicating with other ITS elements.
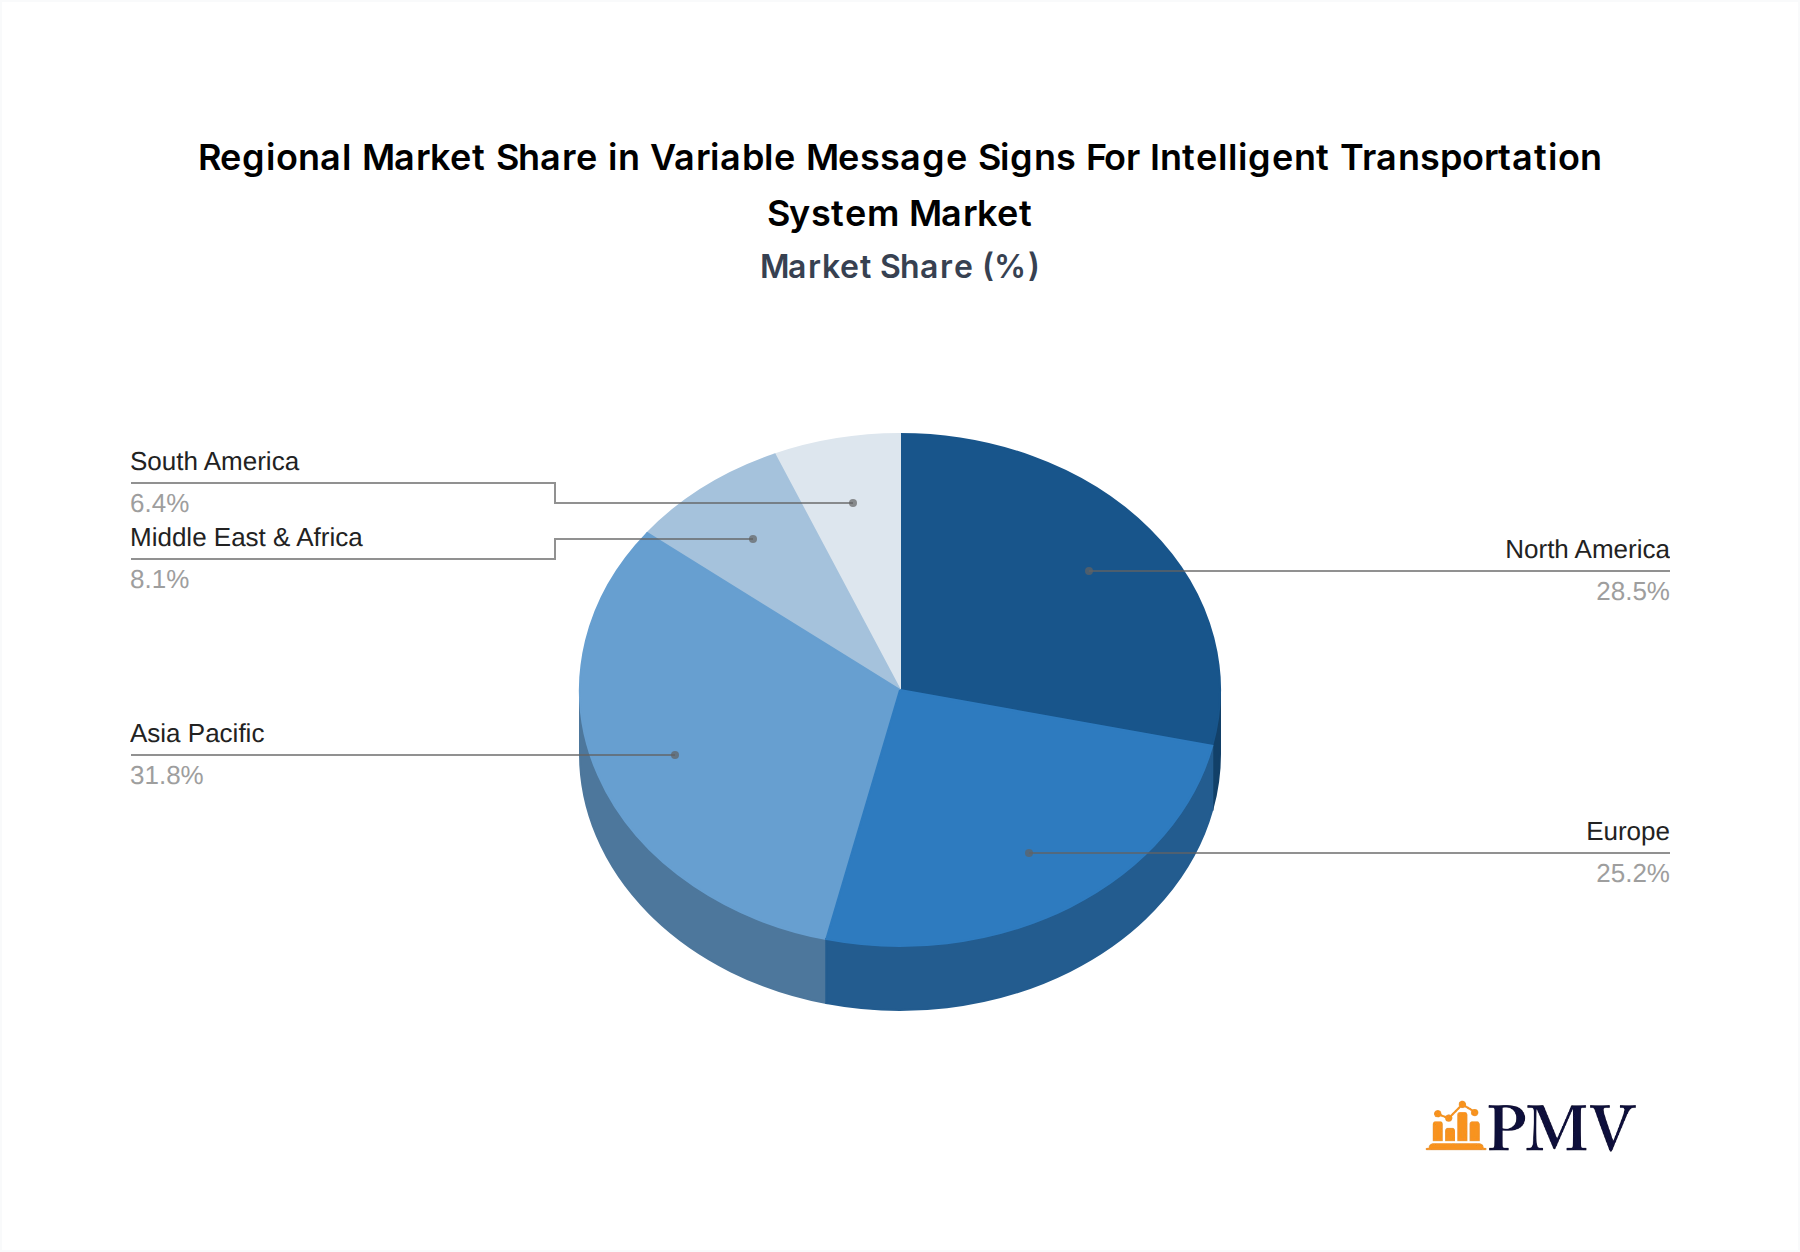
Geographically, North America and Europe currently lead the VMS for ITS market, driven by mature ITS infrastructure, significant government investments, and a strong focus on technological adoption. However, the Asia-Pacific region is exhibiting the fastest growth rate, propelled by rapid urbanization, massive infrastructure development projects, and increasing government initiatives to improve transportation efficiency and safety. Countries like China and India are investing billions of dollars in ITS, making them key growth markets.
Within the VMS technology types, Light Emitting Signs (LES) are rapidly gaining prominence and are projected to become the most dominant type in the coming years. Their superior brightness, color capabilities, energy efficiency, and long lifespan make them ideal for a wide range of ITS applications, from basic text messages to complex graphical displays. While Electro-Mechanical Signs and Reflective Flip-Disk Signs have a historical presence, their limitations in dynamic content and visibility in adverse conditions are leading to a gradual decline in their market share relative to LES. The market size for LES is projected to exceed $10 billion by 2033.
The "Others" application segment, encompassing railways, airports, and industrial zones, is also experiencing robust growth. Railways are increasingly adopting VMS for passenger information at stations and operational alerts. Airports utilize VMS for flight information, gate guidance, and traffic management within airport premises. The market size for the Roadways segment is estimated to be around $8 billion in 2025, with projected growth to $12 billion by 2033. The Asia-Pacific region is expected to contribute approximately 40% of the global market revenue by 2033.
Variable Message Signs For Intelligent Transportation System Product Innovations
Product innovation in the VMS for ITS sector is focused on enhancing functionality, improving energy efficiency, and integrating with broader intelligent transportation ecosystems. Key developments include the widespread adoption of full-color LED technology, enabling richer visual communication and dynamic content display. Innovations in solar-powered VMS are expanding deployment options for remote areas. Furthermore, advancements in connectivity protocols (e.g., 5G) and cloud-based management software are enabling real-time data exchange, remote diagnostics, and seamless integration with traffic management centers and AI-driven traffic analysis platforms. These innovations offer competitive advantages by providing greater reliability, reduced operational costs, and enhanced safety features for end-users.
Report Segmentation & Scope
This report meticulously segments the Variable Message Signs (VMS) for Intelligent Transportation Systems (ITS) market based on key parameters to provide a granular understanding of market dynamics. The segmentation includes:
Application:
- Roadways: This segment, projected to be the largest by market size, encompasses VMS deployed on highways, urban roads, and expressways for traffic management, safety, and information dissemination.
- Railways: Focuses on VMS applications within railway stations for passenger information and operational alerts, showing steady growth.
- Airports: Covers VMS used in airports for gate guidance, flight information, and internal traffic management, a niche but growing segment.
- Others: Includes VMS for ports, industrial zones, university campuses, and other specialized applications, demonstrating strong growth potential.
Type:
- Electro-Mechanical Signs: Traditional VMS technology, expected to see a gradual decline in market share.
- Reflective Flip-Disk Signs: Another established technology, facing increasing competition from newer solutions.
- Light Emitting Signs (LES): The fastest-growing and projected dominant segment, leveraging LED technology for superior performance and versatility. This segment is expected to capture over 65% of the market share by 2033.
The scope of this report covers the global market for VMS for ITS, with detailed analysis of market sizes, growth projections, and competitive landscapes for each segment.
Key Drivers of Variable Message Signs For Intelligent Transportation System Growth
The growth of the Variable Message Signs (VMS) for Intelligent Transportation Systems (ITS) market is propelled by a confluence of technological, economic, and regulatory factors.
- Technological Advancements: Continuous innovation in LED technology, connectivity (IoT, 5G), and AI-powered analytics is making VMS more effective, efficient, and integrated. The ability to display real-time, dynamic information is a key driver.
- Government Investments in ITS: Rising global investments in smart city initiatives and upgrading transportation infrastructure to improve safety and efficiency are directly boosting VMS adoption. For instance, government funding for highway modernization projects in North America and Europe amounts to billions annually.
- Increasing Demand for Road Safety: The urgent need to reduce road accidents and fatalities is a significant catalyst. VMS plays a crucial role in providing real-time hazard warnings, speed limit advisories, and emergency alerts.
- Traffic Congestion Management: As urban populations grow, traffic congestion becomes a major issue. VMS are essential for dynamic route guidance and managing traffic flow, contributing to economic productivity.
- Sustainability Initiatives: The development of energy-efficient VMS, including solar-powered options, aligns with global sustainability goals and is driving adoption in environmentally conscious regions.
Challenges in the Variable Message Signs For Intelligent Transportation System Sector
Despite its robust growth, the Variable Message Signs (VMS) for Intelligent Transportation Systems (ITS) sector faces several challenges that can impede its full potential.
- High Initial Investment Costs: The upfront cost of advanced VMS, particularly full-color LED displays and integrated software systems, can be substantial, posing a barrier for smaller municipalities or developing regions.
- Integration Complexity: Integrating VMS with existing traffic management systems and other ITS components can be complex and require specialized expertise, leading to potential delays and increased project costs.
- Maintenance and Durability: While LED technology has improved, maintaining VMS in harsh environmental conditions and ensuring long-term durability requires ongoing investment and specialized services. The annual maintenance cost can range from 5% to 10% of the initial system cost.
- Cybersecurity Concerns: As VMS become more connected, they become vulnerable to cyber threats. Ensuring robust cybersecurity measures to protect against unauthorized access and data breaches is paramount.
- Standardization and Interoperability: A lack of universal standards for VMS communication protocols can lead to interoperability issues between different manufacturers' equipment, hindering seamless system integration.
Leading Players in the Variable Message Signs For Intelligent Transportation System Market
- 3M Company
- Daktronics
- Triplesign System
- Valmont Industries
- Onyx Electronics
- Efftronics Systems
- SWARCO Group
- Skyline Products
- Wanco
- McCain
- Yaham Optoelectronics
Key Developments in Variable Message Signs For Intelligent Transportation System Sector
- 2023: Daktronics launched a new series of ultra-high-resolution LED VMS, offering enhanced visibility and dynamic content capabilities, impacting outdoor advertising and traffic information dissemination.
- 2023: SWARCO Group announced the acquisition of a leading traffic management software provider, strengthening its end-to-end ITS solution offerings and market reach. The deal value was approximately $150 million.
- 2022: 3M Company introduced an advanced, low-power consumption VMS solution utilizing novel reflective technologies, targeting areas with limited power access and promoting energy efficiency.
- 2022: Valmont Industries expanded its smart city solutions portfolio with new VMS integrated with advanced sensor technology for real-time environmental monitoring, enhancing urban infrastructure management.
- 2021: McCain received a significant contract worth $50 million for the deployment of VMS across a major national highway network, underscoring the ongoing investment in road infrastructure upgrades.
Strategic Variable Message Signs For Intelligent Transportation System Market Outlook
The strategic outlook for the Variable Message Signs (VMS) for Intelligent Transportation Systems (ITS) market is exceptionally positive, driven by the inexorable march towards smarter, safer, and more efficient transportation networks. Growth accelerators include the continued push for smart city integration, where VMS acts as a critical information hub, and the increasing adoption of autonomous and connected vehicles, which will rely heavily on dynamic roadside signage for guidance and safety. Strategic opportunities lie in developing AI-powered VMS that can proactively manage traffic and predict incidents, and in expanding into emerging markets with significant infrastructure development needs. The increasing demand for sustainable solutions, such as solar-powered VMS, also presents a significant growth avenue. Partnerships between VMS manufacturers, software developers, and government agencies will be crucial for unlocking the full potential of this dynamic market, aiming for a total market value exceeding $15 billion by 2033.
Variable Message Signs For Intelligent Transportation System Segmentation
-
1. Application
- 1.1. Railways
- 1.2. Airports
- 1.3. Roadways
- 1.4. Others
-
2. Type
- 2.1. Electro-Mechanical Signs
- 2.2. Reflective Flip-Disk Signs
- 2.3. Light Emitting Signs
Variable Message Signs For Intelligent Transportation System Segmentation By Geography
-
1. North America
- 1.1. United States
- 1.2. Canada
- 1.3. Mexico
-
2. South America
- 2.1. Brazil
- 2.2. Argentina
- 2.3. Rest of South America
-
3. Europe
- 3.1. United Kingdom
- 3.2. Germany
- 3.3. France
- 3.4. Italy
- 3.5. Spain
- 3.6. Russia
- 3.7. Benelux
- 3.8. Nordics
- 3.9. Rest of Europe
-
4. Middle East & Africa
- 4.1. Turkey
- 4.2. Israel
- 4.3. GCC
- 4.4. North Africa
- 4.5. South Africa
- 4.6. Rest of Middle East & Africa
-
5. Asia Pacific
- 5.1. China
- 5.2. India
- 5.3. Japan
- 5.4. South Korea
- 5.5. ASEAN
- 5.6. Oceania
- 5.7. Rest of Asia Pacific
Variable Message Signs For Intelligent Transportation System Regional Market Share
Geographic Coverage of Variable Message Signs For Intelligent Transportation System
Variable Message Signs For Intelligent Transportation System REPORT HIGHLIGHTS
| Aspects | Details |
|---|---|
| Study Period | 2020-2034 |
| Base Year | 2025 |
| Estimated Year | 2026 |
| Forecast Period | 2026-2034 |
| Historical Period | 2020-2025 |
| Growth Rate | CAGR of 7.9% from 2020-2034 |
| Segmentation |
|
Table of Contents
- 1. Introduction
- 1.1. Research Scope
- 1.2. Market Segmentation
- 1.3. Research Objective
- 1.4. Definitions and Assumptions
- 2. Executive Summary
- 2.1. Market Snapshot
- 3. Market Dynamics
- 3.1. Market Drivers
- 3.2. Market Restrains
- 3.3. Market Trends
- 3.4. Market Opportunities
- 4. Market Factor Analysis
- 4.1. Porters Five Forces
- 4.1.1. Bargaining Power of Suppliers
- 4.1.2. Bargaining Power of Buyers
- 4.1.3. Threat of New Entrants
- 4.1.4. Threat of Substitutes
- 4.1.5. Competitive Rivalry
- 4.2. PESTEL analysis
- 4.3. BCG Analysis
- 4.3.1. Stars (High Growth, High Market Share)
- 4.3.2. Cash Cows (Low Growth, High Market Share)
- 4.3.3. Question Mark (High Growth, Low Market Share)
- 4.3.4. Dogs (Low Growth, Low Market Share)
- 4.4. Ansoff Matrix Analysis
- 4.5. Supply Chain Analysis
- 4.6. Regulatory Landscape
- 4.7. Current Market Potential and Opportunity Assessment (TAM–SAM–SOM Framework)
- 4.8. PMV Analyst Note
- 4.1. Porters Five Forces
- 5. Market Analysis, Insights and Forecast 2021-2033
- 5.1. Market Analysis, Insights and Forecast - by Application
- 5.1.1. Railways
- 5.1.2. Airports
- 5.1.3. Roadways
- 5.1.4. Others
- 5.2. Market Analysis, Insights and Forecast - by Type
- 5.2.1. Electro-Mechanical Signs
- 5.2.2. Reflective Flip-Disk Signs
- 5.2.3. Light Emitting Signs
- 5.3. Market Analysis, Insights and Forecast - by Region
- 5.3.1. North America
- 5.3.2. South America
- 5.3.3. Europe
- 5.3.4. Middle East & Africa
- 5.3.5. Asia Pacific
- 5.1. Market Analysis, Insights and Forecast - by Application
- 6. Global Variable Message Signs For Intelligent Transportation System Analysis, Insights and Forecast, 2021-2033
- 6.1. Market Analysis, Insights and Forecast - by Application
- 6.1.1. Railways
- 6.1.2. Airports
- 6.1.3. Roadways
- 6.1.4. Others
- 6.2. Market Analysis, Insights and Forecast - by Type
- 6.2.1. Electro-Mechanical Signs
- 6.2.2. Reflective Flip-Disk Signs
- 6.2.3. Light Emitting Signs
- 6.1. Market Analysis, Insights and Forecast - by Application
- 7. North America Variable Message Signs For Intelligent Transportation System Analysis, Insights and Forecast, 2020-2032
- 7.1. Market Analysis, Insights and Forecast - by Application
- 7.1.1. Railways
- 7.1.2. Airports
- 7.1.3. Roadways
- 7.1.4. Others
- 7.2. Market Analysis, Insights and Forecast - by Type
- 7.2.1. Electro-Mechanical Signs
- 7.2.2. Reflective Flip-Disk Signs
- 7.2.3. Light Emitting Signs
- 7.1. Market Analysis, Insights and Forecast - by Application
- 8. South America Variable Message Signs For Intelligent Transportation System Analysis, Insights and Forecast, 2020-2032
- 8.1. Market Analysis, Insights and Forecast - by Application
- 8.1.1. Railways
- 8.1.2. Airports
- 8.1.3. Roadways
- 8.1.4. Others
- 8.2. Market Analysis, Insights and Forecast - by Type
- 8.2.1. Electro-Mechanical Signs
- 8.2.2. Reflective Flip-Disk Signs
- 8.2.3. Light Emitting Signs
- 8.1. Market Analysis, Insights and Forecast - by Application
- 9. Europe Variable Message Signs For Intelligent Transportation System Analysis, Insights and Forecast, 2020-2032
- 9.1. Market Analysis, Insights and Forecast - by Application
- 9.1.1. Railways
- 9.1.2. Airports
- 9.1.3. Roadways
- 9.1.4. Others
- 9.2. Market Analysis, Insights and Forecast - by Type
- 9.2.1. Electro-Mechanical Signs
- 9.2.2. Reflective Flip-Disk Signs
- 9.2.3. Light Emitting Signs
- 9.1. Market Analysis, Insights and Forecast - by Application
- 10. Middle East & Africa Variable Message Signs For Intelligent Transportation System Analysis, Insights and Forecast, 2020-2032
- 10.1. Market Analysis, Insights and Forecast - by Application
- 10.1.1. Railways
- 10.1.2. Airports
- 10.1.3. Roadways
- 10.1.4. Others
- 10.2. Market Analysis, Insights and Forecast - by Type
- 10.2.1. Electro-Mechanical Signs
- 10.2.2. Reflective Flip-Disk Signs
- 10.2.3. Light Emitting Signs
- 10.1. Market Analysis, Insights and Forecast - by Application
- 11. Asia Pacific Variable Message Signs For Intelligent Transportation System Analysis, Insights and Forecast, 2020-2032
- 11.1. Market Analysis, Insights and Forecast - by Application
- 11.1.1. Railways
- 11.1.2. Airports
- 11.1.3. Roadways
- 11.1.4. Others
- 11.2. Market Analysis, Insights and Forecast - by Type
- 11.2.1. Electro-Mechanical Signs
- 11.2.2. Reflective Flip-Disk Signs
- 11.2.3. Light Emitting Signs
- 11.1. Market Analysis, Insights and Forecast - by Application
- 12. Competitive Analysis
- 12.1. Company Profiles
- 12.1.1 3M Company
- 12.1.1.1. Company Overview
- 12.1.1.2. Products
- 12.1.1.3. Company Financials
- 12.1.1.4. SWOT Analysis
- 12.1.2 Daktronics
- 12.1.2.1. Company Overview
- 12.1.2.2. Products
- 12.1.2.3. Company Financials
- 12.1.2.4. SWOT Analysis
- 12.1.3 Triplesign System
- 12.1.3.1. Company Overview
- 12.1.3.2. Products
- 12.1.3.3. Company Financials
- 12.1.3.4. SWOT Analysis
- 12.1.4 Valmont Industries
- 12.1.4.1. Company Overview
- 12.1.4.2. Products
- 12.1.4.3. Company Financials
- 12.1.4.4. SWOT Analysis
- 12.1.5 Onyx Electronics
- 12.1.5.1. Company Overview
- 12.1.5.2. Products
- 12.1.5.3. Company Financials
- 12.1.5.4. SWOT Analysis
- 12.1.6 Efftronics Systems
- 12.1.6.1. Company Overview
- 12.1.6.2. Products
- 12.1.6.3. Company Financials
- 12.1.6.4. SWOT Analysis
- 12.1.7 SWARCO Group
- 12.1.7.1. Company Overview
- 12.1.7.2. Products
- 12.1.7.3. Company Financials
- 12.1.7.4. SWOT Analysis
- 12.1.8 Skyline Products
- 12.1.8.1. Company Overview
- 12.1.8.2. Products
- 12.1.8.3. Company Financials
- 12.1.8.4. SWOT Analysis
- 12.1.9 Wanco
- 12.1.9.1. Company Overview
- 12.1.9.2. Products
- 12.1.9.3. Company Financials
- 12.1.9.4. SWOT Analysis
- 12.1.10 McCain
- 12.1.10.1. Company Overview
- 12.1.10.2. Products
- 12.1.10.3. Company Financials
- 12.1.10.4. SWOT Analysis
- 12.1.11 Yaham Optoelectronics
- 12.1.11.1. Company Overview
- 12.1.11.2. Products
- 12.1.11.3. Company Financials
- 12.1.11.4. SWOT Analysis
- 12.1.1 3M Company
- 12.2. Market Entropy
- 12.2.1 Company's Key Areas Served
- 12.2.2 Recent Developments
- 12.3. Company Market Share Analysis 2025
- 12.3.1 Top 5 Companies Market Share Analysis
- 12.3.2 Top 3 Companies Market Share Analysis
- 12.4. List of Potential Customers
- 13. Research Methodology
List of Figures
- Figure 1: Global Variable Message Signs For Intelligent Transportation System Revenue Breakdown (million, %) by Region 2025 & 2033
- Figure 2: North America Variable Message Signs For Intelligent Transportation System Revenue (million), by Application 2025 & 2033
- Figure 3: North America Variable Message Signs For Intelligent Transportation System Revenue Share (%), by Application 2025 & 2033
- Figure 4: North America Variable Message Signs For Intelligent Transportation System Revenue (million), by Type 2025 & 2033
- Figure 5: North America Variable Message Signs For Intelligent Transportation System Revenue Share (%), by Type 2025 & 2033
- Figure 6: North America Variable Message Signs For Intelligent Transportation System Revenue (million), by Country 2025 & 2033
- Figure 7: North America Variable Message Signs For Intelligent Transportation System Revenue Share (%), by Country 2025 & 2033
- Figure 8: South America Variable Message Signs For Intelligent Transportation System Revenue (million), by Application 2025 & 2033
- Figure 9: South America Variable Message Signs For Intelligent Transportation System Revenue Share (%), by Application 2025 & 2033
- Figure 10: South America Variable Message Signs For Intelligent Transportation System Revenue (million), by Type 2025 & 2033
- Figure 11: South America Variable Message Signs For Intelligent Transportation System Revenue Share (%), by Type 2025 & 2033
- Figure 12: South America Variable Message Signs For Intelligent Transportation System Revenue (million), by Country 2025 & 2033
- Figure 13: South America Variable Message Signs For Intelligent Transportation System Revenue Share (%), by Country 2025 & 2033
- Figure 14: Europe Variable Message Signs For Intelligent Transportation System Revenue (million), by Application 2025 & 2033
- Figure 15: Europe Variable Message Signs For Intelligent Transportation System Revenue Share (%), by Application 2025 & 2033
- Figure 16: Europe Variable Message Signs For Intelligent Transportation System Revenue (million), by Type 2025 & 2033
- Figure 17: Europe Variable Message Signs For Intelligent Transportation System Revenue Share (%), by Type 2025 & 2033
- Figure 18: Europe Variable Message Signs For Intelligent Transportation System Revenue (million), by Country 2025 & 2033
- Figure 19: Europe Variable Message Signs For Intelligent Transportation System Revenue Share (%), by Country 2025 & 2033
- Figure 20: Middle East & Africa Variable Message Signs For Intelligent Transportation System Revenue (million), by Application 2025 & 2033
- Figure 21: Middle East & Africa Variable Message Signs For Intelligent Transportation System Revenue Share (%), by Application 2025 & 2033
- Figure 22: Middle East & Africa Variable Message Signs For Intelligent Transportation System Revenue (million), by Type 2025 & 2033
- Figure 23: Middle East & Africa Variable Message Signs For Intelligent Transportation System Revenue Share (%), by Type 2025 & 2033
- Figure 24: Middle East & Africa Variable Message Signs For Intelligent Transportation System Revenue (million), by Country 2025 & 2033
- Figure 25: Middle East & Africa Variable Message Signs For Intelligent Transportation System Revenue Share (%), by Country 2025 & 2033
- Figure 26: Asia Pacific Variable Message Signs For Intelligent Transportation System Revenue (million), by Application 2025 & 2033
- Figure 27: Asia Pacific Variable Message Signs For Intelligent Transportation System Revenue Share (%), by Application 2025 & 2033
- Figure 28: Asia Pacific Variable Message Signs For Intelligent Transportation System Revenue (million), by Type 2025 & 2033
- Figure 29: Asia Pacific Variable Message Signs For Intelligent Transportation System Revenue Share (%), by Type 2025 & 2033
- Figure 30: Asia Pacific Variable Message Signs For Intelligent Transportation System Revenue (million), by Country 2025 & 2033
- Figure 31: Asia Pacific Variable Message Signs For Intelligent Transportation System Revenue Share (%), by Country 2025 & 2033
List of Tables
- Table 1: Global Variable Message Signs For Intelligent Transportation System Revenue million Forecast, by Application 2020 & 2033
- Table 2: Global Variable Message Signs For Intelligent Transportation System Revenue million Forecast, by Type 2020 & 2033
- Table 3: Global Variable Message Signs For Intelligent Transportation System Revenue million Forecast, by Region 2020 & 2033
- Table 4: Global Variable Message Signs For Intelligent Transportation System Revenue million Forecast, by Application 2020 & 2033
- Table 5: Global Variable Message Signs For Intelligent Transportation System Revenue million Forecast, by Type 2020 & 2033
- Table 6: Global Variable Message Signs For Intelligent Transportation System Revenue million Forecast, by Country 2020 & 2033
- Table 7: United States Variable Message Signs For Intelligent Transportation System Revenue (million) Forecast, by Application 2020 & 2033
- Table 8: Canada Variable Message Signs For Intelligent Transportation System Revenue (million) Forecast, by Application 2020 & 2033
- Table 9: Mexico Variable Message Signs For Intelligent Transportation System Revenue (million) Forecast, by Application 2020 & 2033
- Table 10: Global Variable Message Signs For Intelligent Transportation System Revenue million Forecast, by Application 2020 & 2033
- Table 11: Global Variable Message Signs For Intelligent Transportation System Revenue million Forecast, by Type 2020 & 2033
- Table 12: Global Variable Message Signs For Intelligent Transportation System Revenue million Forecast, by Country 2020 & 2033
- Table 13: Brazil Variable Message Signs For Intelligent Transportation System Revenue (million) Forecast, by Application 2020 & 2033
- Table 14: Argentina Variable Message Signs For Intelligent Transportation System Revenue (million) Forecast, by Application 2020 & 2033
- Table 15: Rest of South America Variable Message Signs For Intelligent Transportation System Revenue (million) Forecast, by Application 2020 & 2033
- Table 16: Global Variable Message Signs For Intelligent Transportation System Revenue million Forecast, by Application 2020 & 2033
- Table 17: Global Variable Message Signs For Intelligent Transportation System Revenue million Forecast, by Type 2020 & 2033
- Table 18: Global Variable Message Signs For Intelligent Transportation System Revenue million Forecast, by Country 2020 & 2033
- Table 19: United Kingdom Variable Message Signs For Intelligent Transportation System Revenue (million) Forecast, by Application 2020 & 2033
- Table 20: Germany Variable Message Signs For Intelligent Transportation System Revenue (million) Forecast, by Application 2020 & 2033
- Table 21: France Variable Message Signs For Intelligent Transportation System Revenue (million) Forecast, by Application 2020 & 2033
- Table 22: Italy Variable Message Signs For Intelligent Transportation System Revenue (million) Forecast, by Application 2020 & 2033
- Table 23: Spain Variable Message Signs For Intelligent Transportation System Revenue (million) Forecast, by Application 2020 & 2033
- Table 24: Russia Variable Message Signs For Intelligent Transportation System Revenue (million) Forecast, by Application 2020 & 2033
- Table 25: Benelux Variable Message Signs For Intelligent Transportation System Revenue (million) Forecast, by Application 2020 & 2033
- Table 26: Nordics Variable Message Signs For Intelligent Transportation System Revenue (million) Forecast, by Application 2020 & 2033
- Table 27: Rest of Europe Variable Message Signs For Intelligent Transportation System Revenue (million) Forecast, by Application 2020 & 2033
- Table 28: Global Variable Message Signs For Intelligent Transportation System Revenue million Forecast, by Application 2020 & 2033
- Table 29: Global Variable Message Signs For Intelligent Transportation System Revenue million Forecast, by Type 2020 & 2033
- Table 30: Global Variable Message Signs For Intelligent Transportation System Revenue million Forecast, by Country 2020 & 2033
- Table 31: Turkey Variable Message Signs For Intelligent Transportation System Revenue (million) Forecast, by Application 2020 & 2033
- Table 32: Israel Variable Message Signs For Intelligent Transportation System Revenue (million) Forecast, by Application 2020 & 2033
- Table 33: GCC Variable Message Signs For Intelligent Transportation System Revenue (million) Forecast, by Application 2020 & 2033
- Table 34: North Africa Variable Message Signs For Intelligent Transportation System Revenue (million) Forecast, by Application 2020 & 2033
- Table 35: South Africa Variable Message Signs For Intelligent Transportation System Revenue (million) Forecast, by Application 2020 & 2033
- Table 36: Rest of Middle East & Africa Variable Message Signs For Intelligent Transportation System Revenue (million) Forecast, by Application 2020 & 2033
- Table 37: Global Variable Message Signs For Intelligent Transportation System Revenue million Forecast, by Application 2020 & 2033
- Table 38: Global Variable Message Signs For Intelligent Transportation System Revenue million Forecast, by Type 2020 & 2033
- Table 39: Global Variable Message Signs For Intelligent Transportation System Revenue million Forecast, by Country 2020 & 2033
- Table 40: China Variable Message Signs For Intelligent Transportation System Revenue (million) Forecast, by Application 2020 & 2033
- Table 41: India Variable Message Signs For Intelligent Transportation System Revenue (million) Forecast, by Application 2020 & 2033
- Table 42: Japan Variable Message Signs For Intelligent Transportation System Revenue (million) Forecast, by Application 2020 & 2033
- Table 43: South Korea Variable Message Signs For Intelligent Transportation System Revenue (million) Forecast, by Application 2020 & 2033
- Table 44: ASEAN Variable Message Signs For Intelligent Transportation System Revenue (million) Forecast, by Application 2020 & 2033
- Table 45: Oceania Variable Message Signs For Intelligent Transportation System Revenue (million) Forecast, by Application 2020 & 2033
- Table 46: Rest of Asia Pacific Variable Message Signs For Intelligent Transportation System Revenue (million) Forecast, by Application 2020 & 2033
Frequently Asked Questions
1. What is the projected Compound Annual Growth Rate (CAGR) of the Variable Message Signs For Intelligent Transportation System?
The projected CAGR is approximately 7.9%.
2. Which companies are prominent players in the Variable Message Signs For Intelligent Transportation System?
Key companies in the market include 3M Company, Daktronics, Triplesign System, Valmont Industries, Onyx Electronics, Efftronics Systems, SWARCO Group, Skyline Products, Wanco, McCain, Yaham Optoelectronics.
3. What are the main segments of the Variable Message Signs For Intelligent Transportation System?
The market segments include Application, Type.
4. Can you provide details about the market size?
The market size is estimated to be USD 1432 million as of 2022.
5. What are some drivers contributing to market growth?
N/A
6. What are the notable trends driving market growth?
N/A
7. Are there any restraints impacting market growth?
N/A
8. Can you provide examples of recent developments in the market?
N/A
9. What pricing options are available for accessing the report?
Pricing options include single-user, multi-user, and enterprise licenses priced at USD 2900.00, USD 4350.00, and USD 5800.00 respectively.
10. Is the market size provided in terms of value or volume?
The market size is provided in terms of value, measured in million.
11. Are there any specific market keywords associated with the report?
Yes, the market keyword associated with the report is "Variable Message Signs For Intelligent Transportation System," which aids in identifying and referencing the specific market segment covered.
12. How do I determine which pricing option suits my needs best?
The pricing options vary based on user requirements and access needs. Individual users may opt for single-user licenses, while businesses requiring broader access may choose multi-user or enterprise licenses for cost-effective access to the report.
13. Are there any additional resources or data provided in the Variable Message Signs For Intelligent Transportation System report?
While the report offers comprehensive insights, it's advisable to review the specific contents or supplementary materials provided to ascertain if additional resources or data are available.
14. How can I stay updated on further developments or reports in the Variable Message Signs For Intelligent Transportation System?
To stay informed about further developments, trends, and reports in the Variable Message Signs For Intelligent Transportation System, consider subscribing to industry newsletters, following relevant companies and organizations, or regularly checking reputable industry news sources and publications.
Methodology
Step 1 - Identification of Relevant Samples Size from Population Database


Step 2 - Approaches for Defining Global Market Size (Value, Volume* & Price*)

Note*: In applicable scenarios
Step 3 - Data Sources
Primary Research
- Web Analytics
- Survey Reports
- Research Institute
- Latest Research Reports
- Opinion Leaders
Secondary Research
- Annual Reports
- White Paper
- Latest Press Release
- Industry Association
- Paid Database
- Investor Presentations

Step 4 - Data Triangulation
Involves using different sources of information in order to increase the validity of a study
These sources are likely to be stakeholders in a program - participants, other researchers, program staff, other community members, and so on.
Then we put all data in single framework & apply various statistical tools to find out the dynamic on the market.
During the analysis stage, feedback from the stakeholder groups would be compared to determine areas of agreement as well as areas of divergence