Key Insights
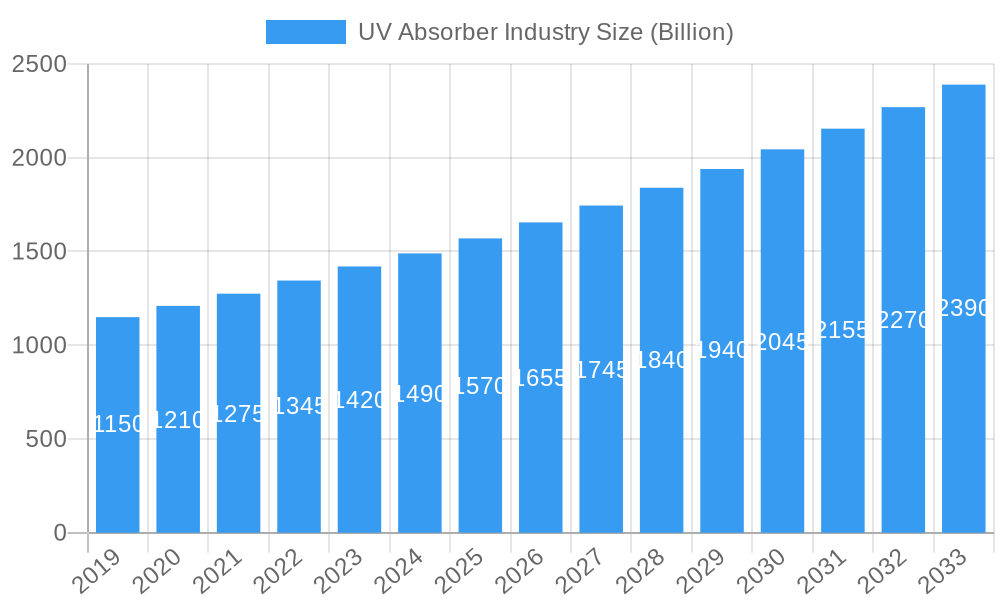
The global UV Absorber market is poised for robust expansion, projected to reach 1.49 Billion by 2025, driven by a Compound Annual Growth Rate (CAGR) of 5.5% from 2019 to 2033. This significant growth is primarily fueled by the escalating demand for advanced protection against UV degradation in a wide array of end-use industries. Key growth drivers include the increasing adoption of UV absorbers in plastics to enhance durability and extend product lifespan, the burgeoning coatings sector demanding improved weatherability and aesthetic retention, and the rising popularity of personal care products offering sun protection. Furthermore, the adhesives industry's need for enhanced product stability under UV exposure contributes to this upward trajectory. The market is witnessing a strong trend towards the development and utilization of high-performance UV absorbers, including triazines and benzophenones, which offer superior efficacy and broader spectrum protection. Innovations in nanotechnology are also paving the way for more efficient and sustainable UV absorption solutions.
UV Absorber Industry Market Size (In Billion)
Despite this promising outlook, certain restraints could influence market dynamics. Stringent environmental regulations concerning the production and disposal of some chemical compounds, alongside the price volatility of raw materials, may pose challenges for market expansion. However, the persistent emphasis on product longevity and performance across consumer and industrial goods, coupled with a growing awareness of the damaging effects of UV radiation, is expected to outweigh these limitations. The market is segmented by types, including Benzotriazole, Triazine, Benzophenone, and Others, and by applications such as Adhesives, Coatings, Personal Care, Plastics, and Others. Geographically, the Asia Pacific region, led by China and India, is anticipated to be a dominant force due to its extensive manufacturing base and increasing consumer demand. North America and Europe also represent significant markets, driven by technological advancements and stringent product quality standards.
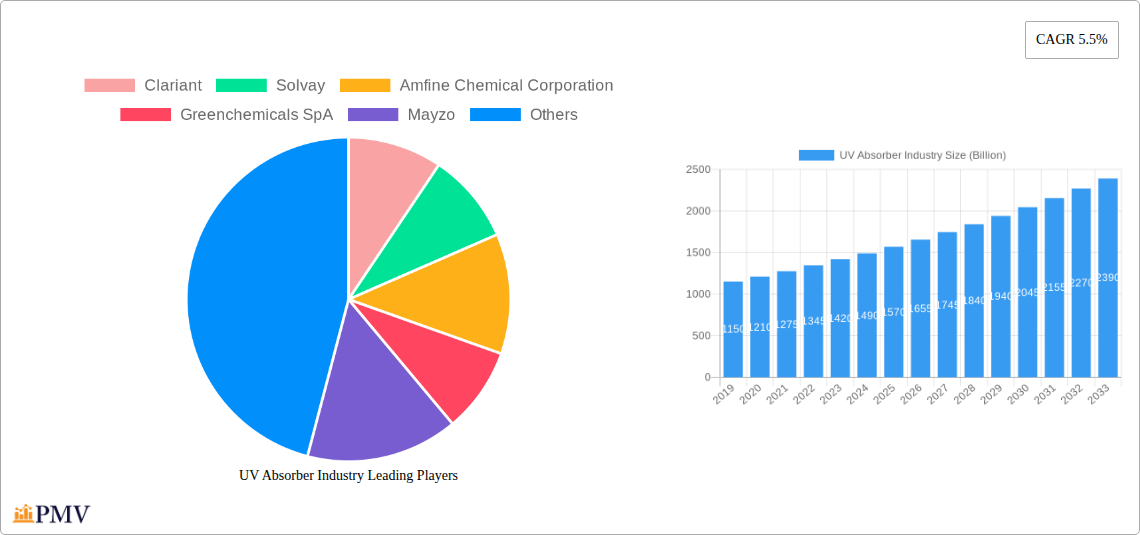
UV Absorber Industry Company Market Share
Unlock in-depth insights into the global UV Absorber Industry with this comprehensive market research report. Covering the historical period of 2019–2024, base year 2025, estimated year 2025, and a robust forecast period of 2025–2033, this report delves into market structure, competitive landscapes, emerging trends, dominant segments, product innovations, key growth drivers, challenges, and strategic outlook. Our analysis offers actionable intelligence for stakeholders seeking to navigate the evolving UV stabilizer market.
UV Absorber Industry Market Structure & Competitive Dynamics
The UV Absorber Industry exhibits a moderately concentrated market structure, with key players like BASF SE, Clariant, and Solvay commanding significant market share. Innovation ecosystems are driven by continuous R&D focused on enhancing UV protection efficacy, broadening application compatibility, and developing sustainable alternatives. Regulatory frameworks, particularly concerning environmental impact and product safety, are increasingly shaping market entry and product development. Product substitutes, such as inorganic UV blockers and physical barriers, present a moderate competitive threat, but the superior performance and versatility of chemical UV absorbers maintain their dominance. End-user trends indicate a growing demand for high-performance, long-lasting UV protection in plastics, coatings, and personal care products. Mergers and acquisitions (M&A) activities are expected to continue, with estimated deal values in the billions of dollars, as larger companies seek to consolidate market position and acquire innovative technologies. The market size is projected to reach Billion USD in 2025, with M&A activities contributing a significant Billion USD to the industry's financial landscape.
- Market Concentration: Moderately concentrated, with key players holding substantial market share.
- Innovation Ecosystems: Driven by R&D for enhanced efficacy, sustainability, and application expansion.
- Regulatory Frameworks: Increasing influence on product development and market access.
- Product Substitutes: Inorganic UV blockers and physical barriers offer alternative solutions.
- End-User Trends: Growing demand for durable UV protection across various industries.
- M&A Activities: Expected to continue, consolidating market share and driving technological advancements, with estimated deal values reaching Billion USD.
UV Absorber Industry Industry Trends & Insights
The UV Absorber Industry is poised for substantial growth, driven by a confluence of factors. A primary growth driver is the increasing awareness and demand for extended product lifespan and performance integrity across diverse applications, including automotive coatings, construction materials, textiles, and consumer electronics. This heightened demand translates into an estimated Compound Annual Growth Rate (CAGR) of XX% during the forecast period. Technological disruptions are at the forefront, with ongoing research into novel UV absorber chemistries that offer superior photostability, reduced migration, and enhanced compatibility with emerging polymer systems. Nanotechnology is also playing a crucial role, with the development of nano-sized UV absorbers that provide exceptional protection at lower concentrations, leading to market penetration rates of XX% in specialized segments. Consumer preferences are leaning towards eco-friendly and non-toxic UV protection solutions, compelling manufacturers to invest in sustainable production processes and bio-based UV absorbers. This shift is influencing product formulations in the personal care sector, particularly in sunscreens and cosmetic products, where transparency and skin safety are paramount.
Competitive dynamics are intensifying, with established players like BASF SE and Clariant investing heavily in expanding their product portfolios and geographical reach. New entrants and smaller specialty chemical manufacturers are focusing on niche applications and innovative solutions to gain a foothold. The market penetration of advanced UV absorbers is expected to rise as industries recognize the economic benefits of preventing material degradation. The global market size is anticipated to reach Billion USD by 2033, a significant increase from the Billion USD valued in 2025. The study period of 2019–2033 provides a comprehensive view of market evolution. The increasing use of UV absorbers in high-performance plastics for automotive and construction industries, demanding enhanced durability and aesthetic appeal, is a key indicator of market expansion. Furthermore, the personal care segment, driven by consumer demand for sun protection and anti-aging products, continues to be a major contributor to market growth, with an estimated Billion USD market share. The overall industry trends point towards a dynamic and expanding market, influenced by technological innovation, shifting consumer priorities, and a persistent need for material protection.
Dominant Markets & Segments in UV Absorber Industry
The UV Absorber Industry is characterized by distinct regional dominance and segment leadership. Among the types of UV absorbers, Benzotriazoles continue to hold a dominant position due to their broad UV absorption spectrum and cost-effectiveness, accounting for an estimated XX% market share in 2025. They are widely utilized across various applications. Triazines, known for their superior thermal stability and high performance in demanding environments, are experiencing rapid growth, particularly in engineering plastics and automotive coatings. The Benzophenone segment remains significant, especially in personal care and certain coating applications, offering a balance of UV absorption and cost. The "Others" category encompasses specialized UV absorbers with unique properties, catering to niche but high-value applications.
In terms of applications, Plastics represent the largest and most dominant segment, projected to account for XX% of the total market value in 2025. The increasing demand for durable and weather-resistant plastic products in automotive, construction, packaging, and electronics industries fuels this dominance. Coatings, including automotive, industrial, and architectural coatings, form the second-largest segment, driven by the need to protect surfaces from UV-induced degradation and maintain aesthetic appeal. The Personal Care segment is a rapidly expanding area, with a growing consumer focus on sun protection and anti-aging properties in cosmetics and skincare products. Adhesives and other niche applications also contribute to market demand, albeit with smaller market shares.
Geographically, Asia Pacific is the leading market for UV absorbers, driven by the robust growth of its manufacturing sector, particularly in China, India, and Southeast Asian countries. Favorable economic policies, increasing infrastructure development, and a burgeoning automotive and construction industry contribute significantly to this dominance. North America and Europe follow as mature markets with a strong emphasis on high-performance and sustainable UV absorber solutions.
- Dominant Types:
- Benzotriazoles: Broad UV spectrum, cost-effective, widely used across applications.
- Triazines: Superior thermal stability, high performance in demanding applications.
- Benzophenones: Balanced UV absorption and cost, prominent in personal care and coatings.
- Others: Specialized UV absorbers for niche, high-value applications.
- Dominant Applications:
- Plastics: Largest segment due to demand in automotive, construction, packaging, and electronics.
- Coatings: Significant demand for protection and aesthetic preservation in automotive, industrial, and architectural sectors.
- Personal Care: Rapidly growing segment driven by consumer demand for sun protection and anti-aging.
- Adhesives & Others: Niche applications contributing to overall market demand.
- Dominant Regions:
- Asia Pacific: Leading market due to strong manufacturing growth and industrial development.
- North America & Europe: Mature markets focused on high-performance and sustainable solutions.
UV Absorber Industry Product Innovations
Product innovations in the UV Absorber Industry are primarily focused on developing next-generation UV stabilizers that offer enhanced performance, improved environmental profiles, and broader application suitability. Key trends include the development of high-efficiency, low-migration UV absorbers that minimize leaching from materials, especially crucial for food packaging and sensitive applications. Advancements in encapsulation technologies are creating UV absorbers with prolonged release mechanisms, offering extended protection. Furthermore, there is a strong push towards sustainable and bio-based UV absorbers derived from renewable resources, catering to increasing consumer and regulatory demand for eco-friendly solutions. These innovations aim to provide competitive advantages through superior material protection, reduced environmental impact, and compliance with evolving industry standards.
Report Segmentation & Scope
This report meticulously segments the UV Absorber Industry by product type and application. The product type segmentation includes Benzotriazole, Triazine, Benzophenone, and Others, each analyzed for its market size, growth projections, and competitive dynamics. The application segmentation covers Adhesives, Coatings, Personal Care, Plastics, and Others. Each segment's market share, projected growth trajectory, and key influencing factors are thoroughly examined. The scope of the report encompasses the global market, providing detailed analysis for the study period of 2019–2033, with a base year of 2025.
- Types: Benzotriazole, Triazine, Benzophenone, Others.
- Applications: Adhesives, Coatings, Personal Care, Plastics, Others.
Key Drivers of UV Absorber Industry Growth
Several key drivers are propelling the growth of the UV Absorber Industry. Technological advancements in developing more efficient and durable UV stabilizers are a primary catalyst. The increasing awareness of UV-induced degradation and its detrimental impact on product lifespan and performance is driving demand across industries. Economic growth, particularly in emerging economies, leads to increased manufacturing activities and a higher demand for protective additives in plastics, coatings, and consumer goods. Stringent regulatory frameworks mandating enhanced product durability and safety also contribute, pushing manufacturers to adopt superior UV protection solutions. For instance, automotive industry standards for interior and exterior material longevity directly impact UV absorber consumption. The growing demand for sustainable solutions is also a significant driver, pushing innovation in bio-based and eco-friendly UV absorbers.
Challenges in the UV Absorber Industry Sector
Despite robust growth, the UV Absorber Industry faces several challenges. Regulatory hurdles and evolving compliance standards, particularly concerning environmental impact and specific chemical restrictions, can pose barriers to market entry and product development. Supply chain disruptions and volatility in raw material prices can impact production costs and availability. Intense competitive pressures from both established players and emerging manufacturers can lead to price erosion. Furthermore, the development of highly effective and cost-competitive product substitutes, such as inorganic UV blockers, can present a challenge in certain application areas. Quantifiable impacts of these challenges include potential delays in product launches and an increase in operational costs by XX%.
Leading Players in the UV Absorber Industry Market
- Clariant
- Solvay
- Amfine Chemical Corporation
- Greenchemicals SpA
- Mayzo
- Everlight Chemical Industrial Corp
- Anhui Best Progress Imp & Exp Co Ltd
- BASF SE
- Huntsman International LLC
- Partners in Chemicals
- Hangzhou Disheng Import&Export Co Ltd
- Suqian Liansheng Technology Co Ltd
- Rianlon Corporation
- NYACOL® Nano Technologies Inc
- Suqian Liansheng Technology Co Ltd
- SABO S p A
- Hunan Chemical BV
- Tiangang Auxiliary Co Ltd
- Milliken Chemical
- The Cary Company
Key Developments in UV Absorber Industry Sector
- 2023: BASF SE launches a new line of high-performance UV absorbers for demanding automotive coating applications, enhancing durability and color fastness.
- 2023: Clariant introduces an innovative bio-based UV absorber derived from renewable resources, catering to the growing demand for sustainable solutions in personal care.
- 2022: Solvay expands its production capacity for advanced Triazine UV absorbers to meet the surging demand from the global plastics industry.
- 2022: Amfine Chemical Corporation announces a strategic partnership with a key distributor in North America to strengthen its market presence and customer reach for specialized UV absorbers.
- 2021: Rianlon Corporation invests in new R&D facilities focused on developing novel UV absorber chemistries with improved photostability and broader spectrum protection.
Strategic UV Absorber Industry Market Outlook
The strategic outlook for the UV Absorber Industry is exceptionally promising, characterized by continuous innovation and expanding application horizons. Growth accelerators include the increasing demand for high-performance materials in sectors like renewable energy (e.g., solar panels), advanced packaging, and next-generation electronics, all of which require robust UV protection. Strategic opportunities lie in the development of multifunctional UV absorbers that combine UV protection with other desirable properties, such as flame retardancy or antimicrobial activity. Furthermore, the growing emphasis on circular economy principles will drive demand for UV stabilizers that are compatible with recycling processes and are derived from sustainable sources. Companies that invest in research and development for environmentally friendly alternatives and focus on niche, high-value applications are well-positioned for significant market expansion. The global UV absorber market is projected to reach Billion USD by 2033, reflecting substantial future growth potential.
UV Absorber Industry Segmentation
-
1. Types
- 1.1. Benzotriazole
- 1.2. Triazine
- 1.3. Benzophenone
- 1.4. Others
-
2. Application
- 2.1. Adhesives
- 2.2. Coatings
- 2.3. Personal Care
- 2.4. Plastics
- 2.5. Others
UV Absorber Industry Segmentation By Geography
-
1. Asia Pacific
- 1.1. China
- 1.2. India
- 1.3. Japan
- 1.4. South Korea
- 1.5. Rest of Asia Pacific
-
2. North America
- 2.1. United States
- 2.2. Canada
- 2.3. Mexico
-
3. Europe
- 3.1. Germany
- 3.2. United Kingdom
- 3.3. France
- 3.4. Italy
- 3.5. Rest of Europe
-
4. South America
- 4.1. Brazil
- 4.2. Argentina
- 4.3. Rest of South America
-
5. Middle East and Africa
- 5.1. Saudi Arabia
- 5.2. South Africa
- 5.3. Rest of Middle East and Africa
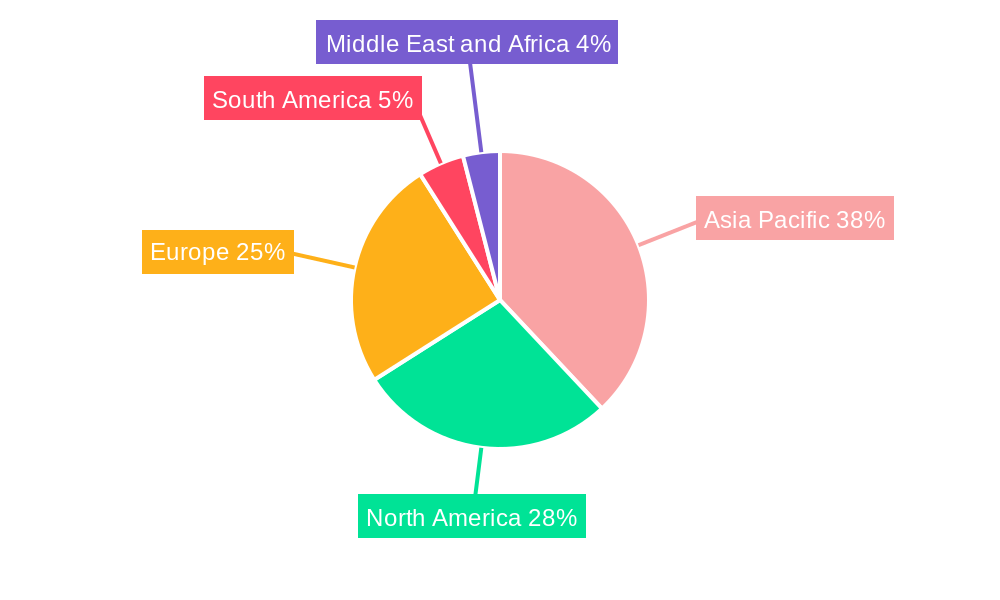
UV Absorber Industry Regional Market Share
Geographic Coverage of UV Absorber Industry
UV Absorber Industry REPORT HIGHLIGHTS
| Aspects | Details |
|---|---|
| Study Period | 2020-2034 |
| Base Year | 2025 |
| Estimated Year | 2026 |
| Forecast Period | 2026-2034 |
| Historical Period | 2020-2025 |
| Growth Rate | CAGR of 5.5% from 2020-2034 |
| Segmentation |
|
Table of Contents
- 1. Introduction
- 1.1. Research Scope
- 1.2. Market Segmentation
- 1.3. Research Objective
- 1.4. Definitions and Assumptions
- 2. Executive Summary
- 2.1. Market Snapshot
- 3. Market Dynamics
- 3.1. Market Drivers
- 3.2. Market Restrains
- 3.3. Market Trends
- 3.4. Market Opportunities
- 4. Market Factor Analysis
- 4.1. Porters Five Forces
- 4.1.1. Bargaining Power of Suppliers
- 4.1.2. Bargaining Power of Buyers
- 4.1.3. Threat of New Entrants
- 4.1.4. Threat of Substitutes
- 4.1.5. Competitive Rivalry
- 4.2. PESTEL analysis
- 4.3. BCG Analysis
- 4.3.1. Stars (High Growth, High Market Share)
- 4.3.2. Cash Cows (Low Growth, High Market Share)
- 4.3.3. Question Mark (High Growth, Low Market Share)
- 4.3.4. Dogs (Low Growth, Low Market Share)
- 4.4. Ansoff Matrix Analysis
- 4.5. Supply Chain Analysis
- 4.6. Regulatory Landscape
- 4.7. Current Market Potential and Opportunity Assessment (TAM–SAM–SOM Framework)
- 4.8. PMV Analyst Note
- 4.1. Porters Five Forces
- 5. Market Analysis, Insights and Forecast 2021-2033
- 5.1. Market Analysis, Insights and Forecast - by Types
- 5.1.1. Benzotriazole
- 5.1.2. Triazine
- 5.1.3. Benzophenone
- 5.1.4. Others
- 5.2. Market Analysis, Insights and Forecast - by Application
- 5.2.1. Adhesives
- 5.2.2. Coatings
- 5.2.3. Personal Care
- 5.2.4. Plastics
- 5.2.5. Others
- 5.3. Market Analysis, Insights and Forecast - by Region
- 5.3.1. Asia Pacific
- 5.3.2. North America
- 5.3.3. Europe
- 5.3.4. South America
- 5.3.5. Middle East and Africa
- 5.1. Market Analysis, Insights and Forecast - by Types
- 6. Global UV Absorber Industry Analysis, Insights and Forecast, 2021-2033
- 6.1. Market Analysis, Insights and Forecast - by Types
- 6.1.1. Benzotriazole
- 6.1.2. Triazine
- 6.1.3. Benzophenone
- 6.1.4. Others
- 6.2. Market Analysis, Insights and Forecast - by Application
- 6.2.1. Adhesives
- 6.2.2. Coatings
- 6.2.3. Personal Care
- 6.2.4. Plastics
- 6.2.5. Others
- 6.1. Market Analysis, Insights and Forecast - by Types
- 7. Asia Pacific UV Absorber Industry Analysis, Insights and Forecast, 2020-2032
- 7.1. Market Analysis, Insights and Forecast - by Types
- 7.1.1. Benzotriazole
- 7.1.2. Triazine
- 7.1.3. Benzophenone
- 7.1.4. Others
- 7.2. Market Analysis, Insights and Forecast - by Application
- 7.2.1. Adhesives
- 7.2.2. Coatings
- 7.2.3. Personal Care
- 7.2.4. Plastics
- 7.2.5. Others
- 7.1. Market Analysis, Insights and Forecast - by Types
- 8. North America UV Absorber Industry Analysis, Insights and Forecast, 2020-2032
- 8.1. Market Analysis, Insights and Forecast - by Types
- 8.1.1. Benzotriazole
- 8.1.2. Triazine
- 8.1.3. Benzophenone
- 8.1.4. Others
- 8.2. Market Analysis, Insights and Forecast - by Application
- 8.2.1. Adhesives
- 8.2.2. Coatings
- 8.2.3. Personal Care
- 8.2.4. Plastics
- 8.2.5. Others
- 8.1. Market Analysis, Insights and Forecast - by Types
- 9. Europe UV Absorber Industry Analysis, Insights and Forecast, 2020-2032
- 9.1. Market Analysis, Insights and Forecast - by Types
- 9.1.1. Benzotriazole
- 9.1.2. Triazine
- 9.1.3. Benzophenone
- 9.1.4. Others
- 9.2. Market Analysis, Insights and Forecast - by Application
- 9.2.1. Adhesives
- 9.2.2. Coatings
- 9.2.3. Personal Care
- 9.2.4. Plastics
- 9.2.5. Others
- 9.1. Market Analysis, Insights and Forecast - by Types
- 10. South America UV Absorber Industry Analysis, Insights and Forecast, 2020-2032
- 10.1. Market Analysis, Insights and Forecast - by Types
- 10.1.1. Benzotriazole
- 10.1.2. Triazine
- 10.1.3. Benzophenone
- 10.1.4. Others
- 10.2. Market Analysis, Insights and Forecast - by Application
- 10.2.1. Adhesives
- 10.2.2. Coatings
- 10.2.3. Personal Care
- 10.2.4. Plastics
- 10.2.5. Others
- 10.1. Market Analysis, Insights and Forecast - by Types
- 11. Middle East and Africa UV Absorber Industry Analysis, Insights and Forecast, 2020-2032
- 11.1. Market Analysis, Insights and Forecast - by Types
- 11.1.1. Benzotriazole
- 11.1.2. Triazine
- 11.1.3. Benzophenone
- 11.1.4. Others
- 11.2. Market Analysis, Insights and Forecast - by Application
- 11.2.1. Adhesives
- 11.2.2. Coatings
- 11.2.3. Personal Care
- 11.2.4. Plastics
- 11.2.5. Others
- 11.1. Market Analysis, Insights and Forecast - by Types
- 12. Competitive Analysis
- 12.1. Company Profiles
- 12.1.1 Clariant
- 12.1.1.1. Company Overview
- 12.1.1.2. Products
- 12.1.1.3. Company Financials
- 12.1.1.4. SWOT Analysis
- 12.1.2 Solvay
- 12.1.2.1. Company Overview
- 12.1.2.2. Products
- 12.1.2.3. Company Financials
- 12.1.2.4. SWOT Analysis
- 12.1.3 Amfine Chemical Corporation
- 12.1.3.1. Company Overview
- 12.1.3.2. Products
- 12.1.3.3. Company Financials
- 12.1.3.4. SWOT Analysis
- 12.1.4 Greenchemicals SpA
- 12.1.4.1. Company Overview
- 12.1.4.2. Products
- 12.1.4.3. Company Financials
- 12.1.4.4. SWOT Analysis
- 12.1.5 Mayzo
- 12.1.5.1. Company Overview
- 12.1.5.2. Products
- 12.1.5.3. Company Financials
- 12.1.5.4. SWOT Analysis
- 12.1.6 Everlight Chemical Industrial Corp
- 12.1.6.1. Company Overview
- 12.1.6.2. Products
- 12.1.6.3. Company Financials
- 12.1.6.4. SWOT Analysis
- 12.1.7 Anhui Best Progress Imp & Exp Co Ltd
- 12.1.7.1. Company Overview
- 12.1.7.2. Products
- 12.1.7.3. Company Financials
- 12.1.7.4. SWOT Analysis
- 12.1.8 BASF SE
- 12.1.8.1. Company Overview
- 12.1.8.2. Products
- 12.1.8.3. Company Financials
- 12.1.8.4. SWOT Analysis
- 12.1.9 Huntsman International LLC
- 12.1.9.1. Company Overview
- 12.1.9.2. Products
- 12.1.9.3. Company Financials
- 12.1.9.4. SWOT Analysis
- 12.1.10 Partners in Chemicals
- 12.1.10.1. Company Overview
- 12.1.10.2. Products
- 12.1.10.3. Company Financials
- 12.1.10.4. SWOT Analysis
- 12.1.11 Hangzhou Disheng Import&Export Co Ltd
- 12.1.11.1. Company Overview
- 12.1.11.2. Products
- 12.1.11.3. Company Financials
- 12.1.11.4. SWOT Analysis
- 12.1.12 Suqian Liansheng Technology Co Ltd
- 12.1.12.1. Company Overview
- 12.1.12.2. Products
- 12.1.12.3. Company Financials
- 12.1.12.4. SWOT Analysis
- 12.1.13 Rianlon Corporation
- 12.1.13.1. Company Overview
- 12.1.13.2. Products
- 12.1.13.3. Company Financials
- 12.1.13.4. SWOT Analysis
- 12.1.14 NYACOL® Nano Technologies Inc
- 12.1.14.1. Company Overview
- 12.1.14.2. Products
- 12.1.14.3. Company Financials
- 12.1.14.4. SWOT Analysis
- 12.1.15 Suqian Liansheng Technology Co Ltd
- 12.1.15.1. Company Overview
- 12.1.15.2. Products
- 12.1.15.3. Company Financials
- 12.1.15.4. SWOT Analysis
- 12.1.16 SABO S p A
- 12.1.16.1. Company Overview
- 12.1.16.2. Products
- 12.1.16.3. Company Financials
- 12.1.16.4. SWOT Analysis
- 12.1.17 Hunan Chemical BV
- 12.1.17.1. Company Overview
- 12.1.17.2. Products
- 12.1.17.3. Company Financials
- 12.1.17.4. SWOT Analysis
- 12.1.18 Tiangang Auxiliary Co Ltd
- 12.1.18.1. Company Overview
- 12.1.18.2. Products
- 12.1.18.3. Company Financials
- 12.1.18.4. SWOT Analysis
- 12.1.19 Milliken Chemical
- 12.1.19.1. Company Overview
- 12.1.19.2. Products
- 12.1.19.3. Company Financials
- 12.1.19.4. SWOT Analysis
- 12.1.20 The Cary Company
- 12.1.20.1. Company Overview
- 12.1.20.2. Products
- 12.1.20.3. Company Financials
- 12.1.20.4. SWOT Analysis
- 12.1.1 Clariant
- 12.2. Market Entropy
- 12.2.1 Company's Key Areas Served
- 12.2.2 Recent Developments
- 12.3. Company Market Share Analysis 2025
- 12.3.1 Top 5 Companies Market Share Analysis
- 12.3.2 Top 3 Companies Market Share Analysis
- 12.4. List of Potential Customers
- 13. Research Methodology
List of Figures
- Figure 1: Global UV Absorber Industry Revenue Breakdown (Billion, %) by Region 2025 & 2033
- Figure 2: Global UV Absorber Industry Volume Breakdown (K Tons, %) by Region 2025 & 2033
- Figure 3: Asia Pacific UV Absorber Industry Revenue (Billion), by Types 2025 & 2033
- Figure 4: Asia Pacific UV Absorber Industry Volume (K Tons), by Types 2025 & 2033
- Figure 5: Asia Pacific UV Absorber Industry Revenue Share (%), by Types 2025 & 2033
- Figure 6: Asia Pacific UV Absorber Industry Volume Share (%), by Types 2025 & 2033
- Figure 7: Asia Pacific UV Absorber Industry Revenue (Billion), by Application 2025 & 2033
- Figure 8: Asia Pacific UV Absorber Industry Volume (K Tons), by Application 2025 & 2033
- Figure 9: Asia Pacific UV Absorber Industry Revenue Share (%), by Application 2025 & 2033
- Figure 10: Asia Pacific UV Absorber Industry Volume Share (%), by Application 2025 & 2033
- Figure 11: Asia Pacific UV Absorber Industry Revenue (Billion), by Country 2025 & 2033
- Figure 12: Asia Pacific UV Absorber Industry Volume (K Tons), by Country 2025 & 2033
- Figure 13: Asia Pacific UV Absorber Industry Revenue Share (%), by Country 2025 & 2033
- Figure 14: Asia Pacific UV Absorber Industry Volume Share (%), by Country 2025 & 2033
- Figure 15: North America UV Absorber Industry Revenue (Billion), by Types 2025 & 2033
- Figure 16: North America UV Absorber Industry Volume (K Tons), by Types 2025 & 2033
- Figure 17: North America UV Absorber Industry Revenue Share (%), by Types 2025 & 2033
- Figure 18: North America UV Absorber Industry Volume Share (%), by Types 2025 & 2033
- Figure 19: North America UV Absorber Industry Revenue (Billion), by Application 2025 & 2033
- Figure 20: North America UV Absorber Industry Volume (K Tons), by Application 2025 & 2033
- Figure 21: North America UV Absorber Industry Revenue Share (%), by Application 2025 & 2033
- Figure 22: North America UV Absorber Industry Volume Share (%), by Application 2025 & 2033
- Figure 23: North America UV Absorber Industry Revenue (Billion), by Country 2025 & 2033
- Figure 24: North America UV Absorber Industry Volume (K Tons), by Country 2025 & 2033
- Figure 25: North America UV Absorber Industry Revenue Share (%), by Country 2025 & 2033
- Figure 26: North America UV Absorber Industry Volume Share (%), by Country 2025 & 2033
- Figure 27: Europe UV Absorber Industry Revenue (Billion), by Types 2025 & 2033
- Figure 28: Europe UV Absorber Industry Volume (K Tons), by Types 2025 & 2033
- Figure 29: Europe UV Absorber Industry Revenue Share (%), by Types 2025 & 2033
- Figure 30: Europe UV Absorber Industry Volume Share (%), by Types 2025 & 2033
- Figure 31: Europe UV Absorber Industry Revenue (Billion), by Application 2025 & 2033
- Figure 32: Europe UV Absorber Industry Volume (K Tons), by Application 2025 & 2033
- Figure 33: Europe UV Absorber Industry Revenue Share (%), by Application 2025 & 2033
- Figure 34: Europe UV Absorber Industry Volume Share (%), by Application 2025 & 2033
- Figure 35: Europe UV Absorber Industry Revenue (Billion), by Country 2025 & 2033
- Figure 36: Europe UV Absorber Industry Volume (K Tons), by Country 2025 & 2033
- Figure 37: Europe UV Absorber Industry Revenue Share (%), by Country 2025 & 2033
- Figure 38: Europe UV Absorber Industry Volume Share (%), by Country 2025 & 2033
- Figure 39: South America UV Absorber Industry Revenue (Billion), by Types 2025 & 2033
- Figure 40: South America UV Absorber Industry Volume (K Tons), by Types 2025 & 2033
- Figure 41: South America UV Absorber Industry Revenue Share (%), by Types 2025 & 2033
- Figure 42: South America UV Absorber Industry Volume Share (%), by Types 2025 & 2033
- Figure 43: South America UV Absorber Industry Revenue (Billion), by Application 2025 & 2033
- Figure 44: South America UV Absorber Industry Volume (K Tons), by Application 2025 & 2033
- Figure 45: South America UV Absorber Industry Revenue Share (%), by Application 2025 & 2033
- Figure 46: South America UV Absorber Industry Volume Share (%), by Application 2025 & 2033
- Figure 47: South America UV Absorber Industry Revenue (Billion), by Country 2025 & 2033
- Figure 48: South America UV Absorber Industry Volume (K Tons), by Country 2025 & 2033
- Figure 49: South America UV Absorber Industry Revenue Share (%), by Country 2025 & 2033
- Figure 50: South America UV Absorber Industry Volume Share (%), by Country 2025 & 2033
- Figure 51: Middle East and Africa UV Absorber Industry Revenue (Billion), by Types 2025 & 2033
- Figure 52: Middle East and Africa UV Absorber Industry Volume (K Tons), by Types 2025 & 2033
- Figure 53: Middle East and Africa UV Absorber Industry Revenue Share (%), by Types 2025 & 2033
- Figure 54: Middle East and Africa UV Absorber Industry Volume Share (%), by Types 2025 & 2033
- Figure 55: Middle East and Africa UV Absorber Industry Revenue (Billion), by Application 2025 & 2033
- Figure 56: Middle East and Africa UV Absorber Industry Volume (K Tons), by Application 2025 & 2033
- Figure 57: Middle East and Africa UV Absorber Industry Revenue Share (%), by Application 2025 & 2033
- Figure 58: Middle East and Africa UV Absorber Industry Volume Share (%), by Application 2025 & 2033
- Figure 59: Middle East and Africa UV Absorber Industry Revenue (Billion), by Country 2025 & 2033
- Figure 60: Middle East and Africa UV Absorber Industry Volume (K Tons), by Country 2025 & 2033
- Figure 61: Middle East and Africa UV Absorber Industry Revenue Share (%), by Country 2025 & 2033
- Figure 62: Middle East and Africa UV Absorber Industry Volume Share (%), by Country 2025 & 2033
List of Tables
- Table 1: Global UV Absorber Industry Revenue Billion Forecast, by Types 2020 & 2033
- Table 2: Global UV Absorber Industry Volume K Tons Forecast, by Types 2020 & 2033
- Table 3: Global UV Absorber Industry Revenue Billion Forecast, by Application 2020 & 2033
- Table 4: Global UV Absorber Industry Volume K Tons Forecast, by Application 2020 & 2033
- Table 5: Global UV Absorber Industry Revenue Billion Forecast, by Region 2020 & 2033
- Table 6: Global UV Absorber Industry Volume K Tons Forecast, by Region 2020 & 2033
- Table 7: Global UV Absorber Industry Revenue Billion Forecast, by Types 2020 & 2033
- Table 8: Global UV Absorber Industry Volume K Tons Forecast, by Types 2020 & 2033
- Table 9: Global UV Absorber Industry Revenue Billion Forecast, by Application 2020 & 2033
- Table 10: Global UV Absorber Industry Volume K Tons Forecast, by Application 2020 & 2033
- Table 11: Global UV Absorber Industry Revenue Billion Forecast, by Country 2020 & 2033
- Table 12: Global UV Absorber Industry Volume K Tons Forecast, by Country 2020 & 2033
- Table 13: China UV Absorber Industry Revenue (Billion) Forecast, by Application 2020 & 2033
- Table 14: China UV Absorber Industry Volume (K Tons) Forecast, by Application 2020 & 2033
- Table 15: India UV Absorber Industry Revenue (Billion) Forecast, by Application 2020 & 2033
- Table 16: India UV Absorber Industry Volume (K Tons) Forecast, by Application 2020 & 2033
- Table 17: Japan UV Absorber Industry Revenue (Billion) Forecast, by Application 2020 & 2033
- Table 18: Japan UV Absorber Industry Volume (K Tons) Forecast, by Application 2020 & 2033
- Table 19: South Korea UV Absorber Industry Revenue (Billion) Forecast, by Application 2020 & 2033
- Table 20: South Korea UV Absorber Industry Volume (K Tons) Forecast, by Application 2020 & 2033
- Table 21: Rest of Asia Pacific UV Absorber Industry Revenue (Billion) Forecast, by Application 2020 & 2033
- Table 22: Rest of Asia Pacific UV Absorber Industry Volume (K Tons) Forecast, by Application 2020 & 2033
- Table 23: Global UV Absorber Industry Revenue Billion Forecast, by Types 2020 & 2033
- Table 24: Global UV Absorber Industry Volume K Tons Forecast, by Types 2020 & 2033
- Table 25: Global UV Absorber Industry Revenue Billion Forecast, by Application 2020 & 2033
- Table 26: Global UV Absorber Industry Volume K Tons Forecast, by Application 2020 & 2033
- Table 27: Global UV Absorber Industry Revenue Billion Forecast, by Country 2020 & 2033
- Table 28: Global UV Absorber Industry Volume K Tons Forecast, by Country 2020 & 2033
- Table 29: United States UV Absorber Industry Revenue (Billion) Forecast, by Application 2020 & 2033
- Table 30: United States UV Absorber Industry Volume (K Tons) Forecast, by Application 2020 & 2033
- Table 31: Canada UV Absorber Industry Revenue (Billion) Forecast, by Application 2020 & 2033
- Table 32: Canada UV Absorber Industry Volume (K Tons) Forecast, by Application 2020 & 2033
- Table 33: Mexico UV Absorber Industry Revenue (Billion) Forecast, by Application 2020 & 2033
- Table 34: Mexico UV Absorber Industry Volume (K Tons) Forecast, by Application 2020 & 2033
- Table 35: Global UV Absorber Industry Revenue Billion Forecast, by Types 2020 & 2033
- Table 36: Global UV Absorber Industry Volume K Tons Forecast, by Types 2020 & 2033
- Table 37: Global UV Absorber Industry Revenue Billion Forecast, by Application 2020 & 2033
- Table 38: Global UV Absorber Industry Volume K Tons Forecast, by Application 2020 & 2033
- Table 39: Global UV Absorber Industry Revenue Billion Forecast, by Country 2020 & 2033
- Table 40: Global UV Absorber Industry Volume K Tons Forecast, by Country 2020 & 2033
- Table 41: Germany UV Absorber Industry Revenue (Billion) Forecast, by Application 2020 & 2033
- Table 42: Germany UV Absorber Industry Volume (K Tons) Forecast, by Application 2020 & 2033
- Table 43: United Kingdom UV Absorber Industry Revenue (Billion) Forecast, by Application 2020 & 2033
- Table 44: United Kingdom UV Absorber Industry Volume (K Tons) Forecast, by Application 2020 & 2033
- Table 45: France UV Absorber Industry Revenue (Billion) Forecast, by Application 2020 & 2033
- Table 46: France UV Absorber Industry Volume (K Tons) Forecast, by Application 2020 & 2033
- Table 47: Italy UV Absorber Industry Revenue (Billion) Forecast, by Application 2020 & 2033
- Table 48: Italy UV Absorber Industry Volume (K Tons) Forecast, by Application 2020 & 2033
- Table 49: Rest of Europe UV Absorber Industry Revenue (Billion) Forecast, by Application 2020 & 2033
- Table 50: Rest of Europe UV Absorber Industry Volume (K Tons) Forecast, by Application 2020 & 2033
- Table 51: Global UV Absorber Industry Revenue Billion Forecast, by Types 2020 & 2033
- Table 52: Global UV Absorber Industry Volume K Tons Forecast, by Types 2020 & 2033
- Table 53: Global UV Absorber Industry Revenue Billion Forecast, by Application 2020 & 2033
- Table 54: Global UV Absorber Industry Volume K Tons Forecast, by Application 2020 & 2033
- Table 55: Global UV Absorber Industry Revenue Billion Forecast, by Country 2020 & 2033
- Table 56: Global UV Absorber Industry Volume K Tons Forecast, by Country 2020 & 2033
- Table 57: Brazil UV Absorber Industry Revenue (Billion) Forecast, by Application 2020 & 2033
- Table 58: Brazil UV Absorber Industry Volume (K Tons) Forecast, by Application 2020 & 2033
- Table 59: Argentina UV Absorber Industry Revenue (Billion) Forecast, by Application 2020 & 2033
- Table 60: Argentina UV Absorber Industry Volume (K Tons) Forecast, by Application 2020 & 2033
- Table 61: Rest of South America UV Absorber Industry Revenue (Billion) Forecast, by Application 2020 & 2033
- Table 62: Rest of South America UV Absorber Industry Volume (K Tons) Forecast, by Application 2020 & 2033
- Table 63: Global UV Absorber Industry Revenue Billion Forecast, by Types 2020 & 2033
- Table 64: Global UV Absorber Industry Volume K Tons Forecast, by Types 2020 & 2033
- Table 65: Global UV Absorber Industry Revenue Billion Forecast, by Application 2020 & 2033
- Table 66: Global UV Absorber Industry Volume K Tons Forecast, by Application 2020 & 2033
- Table 67: Global UV Absorber Industry Revenue Billion Forecast, by Country 2020 & 2033
- Table 68: Global UV Absorber Industry Volume K Tons Forecast, by Country 2020 & 2033
- Table 69: Saudi Arabia UV Absorber Industry Revenue (Billion) Forecast, by Application 2020 & 2033
- Table 70: Saudi Arabia UV Absorber Industry Volume (K Tons) Forecast, by Application 2020 & 2033
- Table 71: South Africa UV Absorber Industry Revenue (Billion) Forecast, by Application 2020 & 2033
- Table 72: South Africa UV Absorber Industry Volume (K Tons) Forecast, by Application 2020 & 2033
- Table 73: Rest of Middle East and Africa UV Absorber Industry Revenue (Billion) Forecast, by Application 2020 & 2033
- Table 74: Rest of Middle East and Africa UV Absorber Industry Volume (K Tons) Forecast, by Application 2020 & 2033
Frequently Asked Questions
1. What is the projected Compound Annual Growth Rate (CAGR) of the UV Absorber Industry?
The projected CAGR is approximately 5.5%.
2. Which companies are prominent players in the UV Absorber Industry?
Key companies in the market include Clariant, Solvay, Amfine Chemical Corporation, Greenchemicals SpA, Mayzo, Everlight Chemical Industrial Corp, Anhui Best Progress Imp & Exp Co Ltd, BASF SE, Huntsman International LLC, Partners in Chemicals, Hangzhou Disheng Import&Export Co Ltd, Suqian Liansheng Technology Co Ltd , Rianlon Corporation, NYACOL® Nano Technologies Inc, Suqian Liansheng Technology Co Ltd, SABO S p A, Hunan Chemical BV, Tiangang Auxiliary Co Ltd, Milliken Chemical, The Cary Company.
3. What are the main segments of the UV Absorber Industry?
The market segments include Types, Application.
4. Can you provide details about the market size?
The market size is estimated to be USD 1.49 Billion as of 2022.
5. What are some drivers contributing to market growth?
; Growing Application in Plastics and Packaging; Other Drivers.
6. What are the notable trends driving market growth?
Plastic to Dominate the Market.
7. Are there any restraints impacting market growth?
; Environmental Concerns of Benzotriazole UV Absorber; Unfavorable Conditions Arising Due to COVID-19 Outbreak.
8. Can you provide examples of recent developments in the market?
N/A
9. What pricing options are available for accessing the report?
Pricing options include single-user, multi-user, and enterprise licenses priced at USD 4750, USD 5250, and USD 8750 respectively.
10. Is the market size provided in terms of value or volume?
The market size is provided in terms of value, measured in Billion and volume, measured in K Tons.
11. Are there any specific market keywords associated with the report?
Yes, the market keyword associated with the report is "UV Absorber Industry," which aids in identifying and referencing the specific market segment covered.
12. How do I determine which pricing option suits my needs best?
The pricing options vary based on user requirements and access needs. Individual users may opt for single-user licenses, while businesses requiring broader access may choose multi-user or enterprise licenses for cost-effective access to the report.
13. Are there any additional resources or data provided in the UV Absorber Industry report?
While the report offers comprehensive insights, it's advisable to review the specific contents or supplementary materials provided to ascertain if additional resources or data are available.
14. How can I stay updated on further developments or reports in the UV Absorber Industry?
To stay informed about further developments, trends, and reports in the UV Absorber Industry, consider subscribing to industry newsletters, following relevant companies and organizations, or regularly checking reputable industry news sources and publications.
Methodology
Step 1 - Identification of Relevant Samples Size from Population Database


Step 2 - Approaches for Defining Global Market Size (Value, Volume* & Price*)

Note*: In applicable scenarios
Step 3 - Data Sources
Primary Research
- Web Analytics
- Survey Reports
- Research Institute
- Latest Research Reports
- Opinion Leaders
Secondary Research
- Annual Reports
- White Paper
- Latest Press Release
- Industry Association
- Paid Database
- Investor Presentations

Step 4 - Data Triangulation
Involves using different sources of information in order to increase the validity of a study
These sources are likely to be stakeholders in a program - participants, other researchers, program staff, other community members, and so on.
Then we put all data in single framework & apply various statistical tools to find out the dynamic on the market.
During the analysis stage, feedback from the stakeholder groups would be compared to determine areas of agreement as well as areas of divergence

