

Key Insights
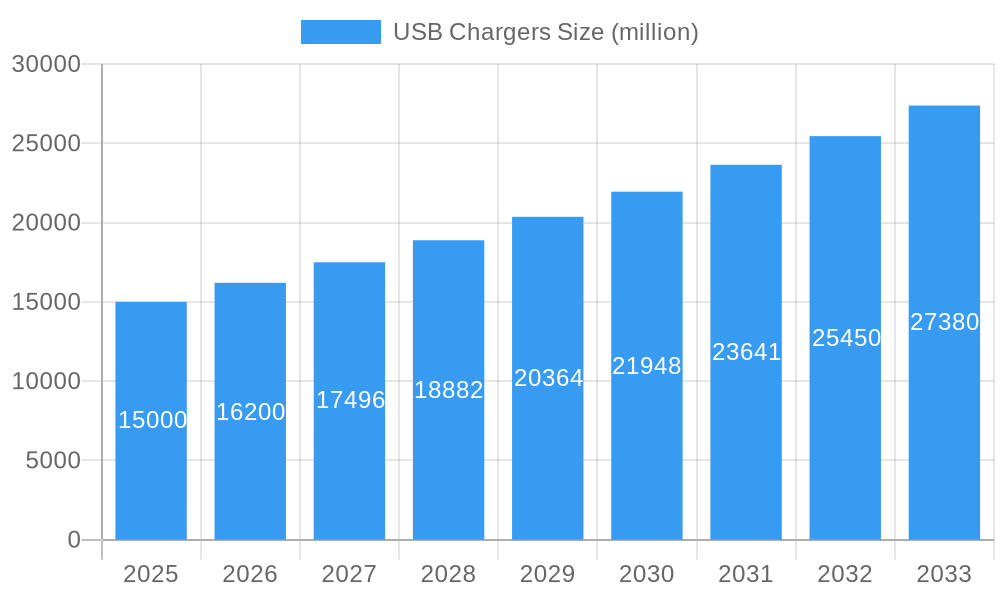
The global USB charger market is experiencing robust growth, driven by the increasing demand for portable electronic devices and the proliferation of fast-charging technologies. The market, estimated at $15 billion in 2025, is projected to witness a Compound Annual Growth Rate (CAGR) of 8% from 2025 to 2033, reaching approximately $28 billion by the end of the forecast period. Several factors contribute to this expansion. The rising adoption of smartphones, tablets, wearables, and other power-hungry gadgets fuels the demand for efficient and reliable charging solutions. Furthermore, advancements in charging technologies, such as USB-C Power Delivery (PD) and Quick Charge, are driving the adoption of higher-wattage chargers capable of faster charging speeds. The market is segmented by application (individual, commercial, others) and port type (1, 2, 3, 4, and others), offering diverse options to cater to varying consumer needs. The commercial segment is expected to show significant growth due to increasing workplace adoption of mobile devices and the demand for multiple charging stations in public spaces.
USB Chargers Market Size (In Billion)
Competition in the USB charger market is intense, with established brands like Anker, Belkin, and Mophie/Zagg vying for market share alongside emerging players. Regional distribution shows a strong concentration in North America and Asia Pacific, driven by high consumer electronics adoption rates in these regions. However, growing smartphone penetration in developing economies within regions like South America and Africa presents significant opportunities for market expansion. Potential restraints include the increasing prevalence of wireless charging technology and concerns regarding the environmental impact of electronic waste generation from charger obsolescence. Nevertheless, the market is anticipated to continue its growth trajectory fueled by consumer demand for efficient and convenient charging solutions, innovation in charging technology, and growing smartphone penetration globally. The market's future success will hinge on manufacturers' ability to innovate and adapt to evolving consumer preferences and technological advancements.
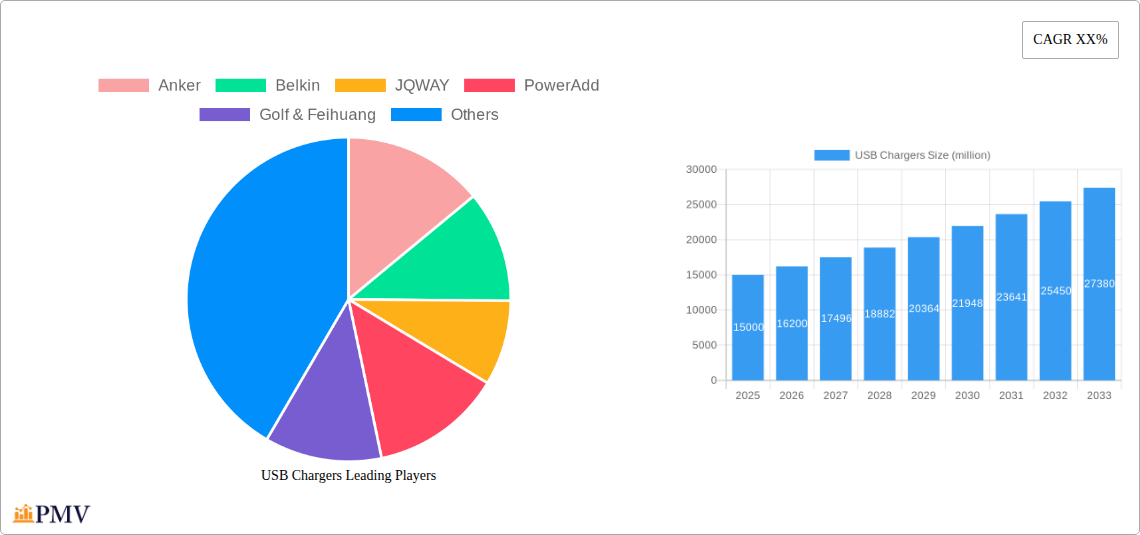
USB Chargers Company Market Share
USB Chargers Market Report: A Comprehensive Analysis (2019-2033)
This comprehensive report provides an in-depth analysis of the global USB Chargers market, offering valuable insights into market structure, competitive dynamics, industry trends, and future growth potential. The report covers the period from 2019 to 2033, with a focus on the base year 2025 and a forecast period from 2025 to 2033. The study encompasses a market size exceeding $XX million in 2025, projected to reach $XX million by 2033, exhibiting a CAGR of XX%. This report is essential for industry stakeholders, investors, and market researchers seeking a complete understanding of this rapidly evolving market.
USB Chargers Market Structure & Competitive Dynamics
The global USB chargers market is characterized by a moderately concentrated landscape, with several key players holding significant market share. Anker, Belkin, and RAVPower are among the leading brands, collectively accounting for an estimated XX% of the market in 2025. The market exhibits a dynamic competitive environment fueled by continuous product innovation, strategic mergers and acquisitions (M&A), and evolving consumer preferences. M&A activity in the period 2019-2024 witnessed approximately $XX million in deal value, primarily driven by companies seeking to expand their product portfolios and geographical reach. Regulatory frameworks, particularly concerning energy efficiency and safety standards, play a crucial role in shaping market dynamics. Furthermore, the rise of wireless charging technology presents a significant product substitute, gradually impacting the market share of traditional USB chargers. End-user trends are shifting towards higher-capacity and faster-charging solutions, demanding advanced technologies and innovative features.
- Market Concentration: Moderately concentrated, with top 5 players holding XX% market share in 2025.
- Innovation Ecosystems: Active R&D leading to faster charging speeds, increased power output, and compact designs.
- Regulatory Frameworks: Stringent safety and efficiency standards influencing product development and market entry.
- Product Substitutes: Wireless charging technology posing a competitive threat.
- End-User Trends: Increasing demand for higher-capacity and faster-charging solutions.
- M&A Activities: Total deal value of approximately $XX million during 2019-2024.
USB Chargers Industry Trends & Insights
The global USB chargers market is experiencing robust growth, driven by the proliferation of portable electronic devices, increasing demand for fast charging capabilities, and the rising adoption of USB-C technology. The market has witnessed a CAGR of XX% during the historical period (2019-2024), and this growth is projected to continue into the forecast period (2025-2033). Technological disruptions, such as the introduction of GaN (Gallium Nitride) technology, are significantly improving charging speeds and efficiency. Consumer preferences are shifting towards compact, multi-port chargers offering greater convenience and versatility. Intense competition among major players is pushing innovation and driving down prices, making USB chargers increasingly accessible to a wider consumer base. Market penetration is high in developed regions, but significant growth opportunities exist in emerging markets.
Dominant Markets & Segments in USB Chargers
The North American region currently dominates the global USB chargers market, driven by high per capita consumption of electronic devices and robust consumer spending. Within the application segments, individual use constitutes the largest market share, followed by commercial use. Among charger types, multi-port chargers (2-4 ports) are gaining popularity over single-port chargers due to increased convenience and efficiency.
Key Drivers for North American Dominance:
- High disposable income
- Extensive electronic device usage
- Strong consumer electronics retail infrastructure
Segment Dominance Analysis:
- Application: Individual use accounts for the largest market share (XX%), followed by commercial use (XX%). Other applications, such as automotive and industrial applications, have a smaller, but steadily growing share.
- Type: Multi-port chargers (2-4 ports) show the fastest growth, overtaking single-port chargers in market share.
USB Chargers Product Innovations
Recent years have witnessed significant advancements in USB charger technology. The adoption of GaN technology has led to smaller, more efficient chargers with faster charging speeds. The introduction of USB-C PD (Power Delivery) has standardized charging protocols, enhancing interoperability across devices. Furthermore, wireless charging technology, while still a niche segment, continues to evolve and compete with traditional USB chargers.
Report Segmentation & Scope
This report segments the USB chargers market across various parameters, including Application (Individual Use, Commercial Use, Others) and Type (1 Port, 2 Ports, 3 Ports, 4 Ports, Others). Each segment's growth trajectory, market size, and competitive dynamics are thoroughly examined. Individual use is projected to maintain its significant market share throughout the forecast period due to high individual device ownership, while the commercial use segment demonstrates consistent growth, driven by demand from businesses and organizations. Multi-port chargers are anticipated to experience accelerated growth in both individual and commercial segments.
Key Drivers of USB Chargers Growth
The growth of the USB chargers market is driven by several key factors. The widespread adoption of smartphones, tablets, and other portable electronic devices necessitates a constant supply of chargers. Technological advancements, particularly GaN technology and USB-C PD, improve charging speeds and efficiency. Furthermore, government regulations promoting energy efficiency are creating a demand for advanced charger technology.
Challenges in the USB Chargers Sector
The USB chargers sector faces challenges including intense competition, increasing raw material costs, and the potential disruption from emerging wireless charging technologies. Supply chain disruptions and the need to comply with stringent safety and regulatory standards can also pose significant hurdles for manufacturers. The impact of these challenges on market growth is quantified within the report.
Leading Players in the USB Chargers Market
- Anker
- Belkin
- JQWAY
- PowerAdd
- Golf & Feihuang
- Aukey
- Mophie/Zagg
- Amazon Basics
- Incipio
- Jasco
- Ventev
- RAVPower
- iLuv
- Philips
- IO Gear
- Monoprice
- Zendure
- 360 Electrical
- E'aiito
- Unu Electronics
- Jackery
- Huntkey
- Cyntur
- Radio Shack
Key Developments in USB Chargers Sector
- 2022 Q4: Anker launches a new line of GaN-based chargers with significantly improved efficiency.
- 2023 Q1: Belkin introduces a wireless charging pad compatible with multiple device types.
- 2023 Q3: A major merger between two smaller charger manufacturers results in expanded market reach. (Specific details within the full report).
Strategic USB Chargers Market Outlook
The future of the USB chargers market is bright, driven by continuous technological advancements, growing demand for fast and efficient charging solutions, and the increasing penetration of smartphones and other mobile devices in emerging markets. Strategic opportunities exist for manufacturers focusing on innovative designs, advanced charging technologies, and environmentally friendly materials. The market is poised for significant growth in the coming years, presenting lucrative opportunities for players with a strong focus on R&D and strategic partnerships.
USB Chargers Segmentation
-
1. Application
- 1.1. Individual Use
- 1.2. Commercial Use
- 1.3. Others
-
2. Types
- 2.1. 1 Port
- 2.2. 2 Ports
- 2.3. 3 Ports
- 2.4. 4 Ports
- 2.5. Others
USB Chargers Segmentation By Geography
-
1. North America
- 1.1. United States
- 1.2. Canada
- 1.3. Mexico
-
2. South America
- 2.1. Brazil
- 2.2. Argentina
- 2.3. Rest of South America
-
3. Europe
- 3.1. United Kingdom
- 3.2. Germany
- 3.3. France
- 3.4. Italy
- 3.5. Spain
- 3.6. Russia
- 3.7. Benelux
- 3.8. Nordics
- 3.9. Rest of Europe
-
4. Middle East & Africa
- 4.1. Turkey
- 4.2. Israel
- 4.3. GCC
- 4.4. North Africa
- 4.5. South Africa
- 4.6. Rest of Middle East & Africa
-
5. Asia Pacific
- 5.1. China
- 5.2. India
- 5.3. Japan
- 5.4. South Korea
- 5.5. ASEAN
- 5.6. Oceania
- 5.7. Rest of Asia Pacific
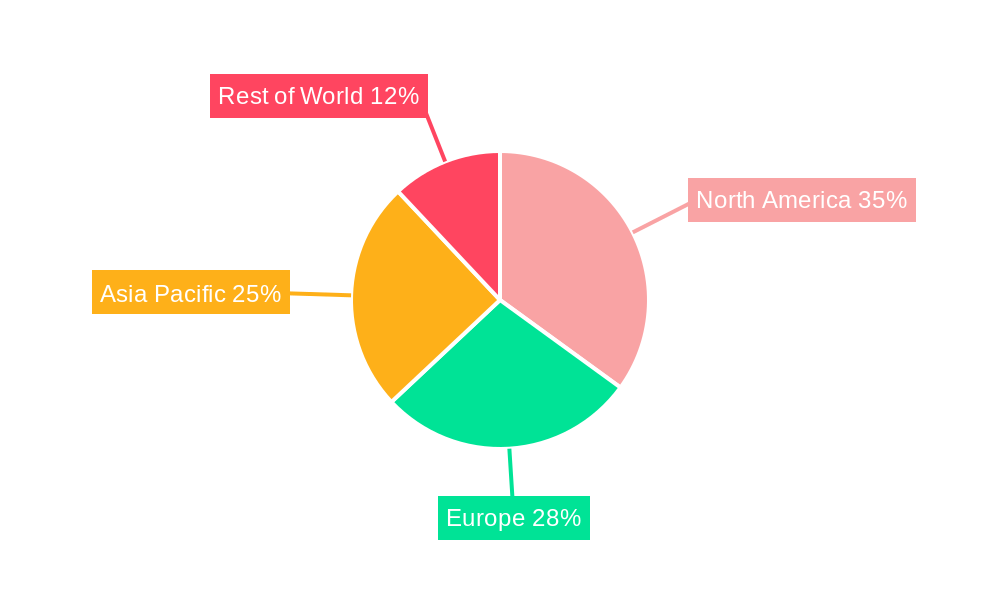
USB Chargers Regional Market Share
Geographic Coverage of USB Chargers
USB Chargers REPORT HIGHLIGHTS
| Aspects | Details |
|---|---|
| Study Period | 2020-2034 |
| Base Year | 2025 |
| Estimated Year | 2026 |
| Forecast Period | 2026-2034 |
| Historical Period | 2020-2025 |
| Growth Rate | CAGR of XX% from 2020-2034 |
| Segmentation |
|
Table of Contents
- 1. Introduction
- 1.1. Research Scope
- 1.2. Market Segmentation
- 1.3. Research Methodology
- 1.4. Definitions and Assumptions
- 2. Executive Summary
- 2.1. Introduction
- 3. Market Dynamics
- 3.1. Introduction
- 3.2. Market Drivers
- 3.3. Market Restrains
- 3.4. Market Trends
- 4. Market Factor Analysis
- 4.1. Porters Five Forces
- 4.2. Supply/Value Chain
- 4.3. PESTEL analysis
- 4.4. Market Entropy
- 4.5. Patent/Trademark Analysis
- 5. Global USB Chargers Analysis, Insights and Forecast, 2020-2032
- 5.1. Market Analysis, Insights and Forecast - by Application
- 5.1.1. Individual Use
- 5.1.2. Commercial Use
- 5.1.3. Others
- 5.2. Market Analysis, Insights and Forecast - by Types
- 5.2.1. 1 Port
- 5.2.2. 2 Ports
- 5.2.3. 3 Ports
- 5.2.4. 4 Ports
- 5.2.5. Others
- 5.3. Market Analysis, Insights and Forecast - by Region
- 5.3.1. North America
- 5.3.2. South America
- 5.3.3. Europe
- 5.3.4. Middle East & Africa
- 5.3.5. Asia Pacific
- 5.1. Market Analysis, Insights and Forecast - by Application
- 6. North America USB Chargers Analysis, Insights and Forecast, 2020-2032
- 6.1. Market Analysis, Insights and Forecast - by Application
- 6.1.1. Individual Use
- 6.1.2. Commercial Use
- 6.1.3. Others
- 6.2. Market Analysis, Insights and Forecast - by Types
- 6.2.1. 1 Port
- 6.2.2. 2 Ports
- 6.2.3. 3 Ports
- 6.2.4. 4 Ports
- 6.2.5. Others
- 6.1. Market Analysis, Insights and Forecast - by Application
- 7. South America USB Chargers Analysis, Insights and Forecast, 2020-2032
- 7.1. Market Analysis, Insights and Forecast - by Application
- 7.1.1. Individual Use
- 7.1.2. Commercial Use
- 7.1.3. Others
- 7.2. Market Analysis, Insights and Forecast - by Types
- 7.2.1. 1 Port
- 7.2.2. 2 Ports
- 7.2.3. 3 Ports
- 7.2.4. 4 Ports
- 7.2.5. Others
- 7.1. Market Analysis, Insights and Forecast - by Application
- 8. Europe USB Chargers Analysis, Insights and Forecast, 2020-2032
- 8.1. Market Analysis, Insights and Forecast - by Application
- 8.1.1. Individual Use
- 8.1.2. Commercial Use
- 8.1.3. Others
- 8.2. Market Analysis, Insights and Forecast - by Types
- 8.2.1. 1 Port
- 8.2.2. 2 Ports
- 8.2.3. 3 Ports
- 8.2.4. 4 Ports
- 8.2.5. Others
- 8.1. Market Analysis, Insights and Forecast - by Application
- 9. Middle East & Africa USB Chargers Analysis, Insights and Forecast, 2020-2032
- 9.1. Market Analysis, Insights and Forecast - by Application
- 9.1.1. Individual Use
- 9.1.2. Commercial Use
- 9.1.3. Others
- 9.2. Market Analysis, Insights and Forecast - by Types
- 9.2.1. 1 Port
- 9.2.2. 2 Ports
- 9.2.3. 3 Ports
- 9.2.4. 4 Ports
- 9.2.5. Others
- 9.1. Market Analysis, Insights and Forecast - by Application
- 10. Asia Pacific USB Chargers Analysis, Insights and Forecast, 2020-2032
- 10.1. Market Analysis, Insights and Forecast - by Application
- 10.1.1. Individual Use
- 10.1.2. Commercial Use
- 10.1.3. Others
- 10.2. Market Analysis, Insights and Forecast - by Types
- 10.2.1. 1 Port
- 10.2.2. 2 Ports
- 10.2.3. 3 Ports
- 10.2.4. 4 Ports
- 10.2.5. Others
- 10.1. Market Analysis, Insights and Forecast - by Application
- 11. Competitive Analysis
- 11.1. Global Market Share Analysis 2025
- 11.2. Company Profiles
- 11.2.1 Anker
- 11.2.1.1. Overview
- 11.2.1.2. Products
- 11.2.1.3. SWOT Analysis
- 11.2.1.4. Recent Developments
- 11.2.1.5. Financials (Based on Availability)
- 11.2.2 Belkin
- 11.2.2.1. Overview
- 11.2.2.2. Products
- 11.2.2.3. SWOT Analysis
- 11.2.2.4. Recent Developments
- 11.2.2.5. Financials (Based on Availability)
- 11.2.3 JQWAY
- 11.2.3.1. Overview
- 11.2.3.2. Products
- 11.2.3.3. SWOT Analysis
- 11.2.3.4. Recent Developments
- 11.2.3.5. Financials (Based on Availability)
- 11.2.4 PowerAdd
- 11.2.4.1. Overview
- 11.2.4.2. Products
- 11.2.4.3. SWOT Analysis
- 11.2.4.4. Recent Developments
- 11.2.4.5. Financials (Based on Availability)
- 11.2.5 Golf & Feihuang
- 11.2.5.1. Overview
- 11.2.5.2. Products
- 11.2.5.3. SWOT Analysis
- 11.2.5.4. Recent Developments
- 11.2.5.5. Financials (Based on Availability)
- 11.2.6 Aukey
- 11.2.6.1. Overview
- 11.2.6.2. Products
- 11.2.6.3. SWOT Analysis
- 11.2.6.4. Recent Developments
- 11.2.6.5. Financials (Based on Availability)
- 11.2.7 Mophie/Zagg
- 11.2.7.1. Overview
- 11.2.7.2. Products
- 11.2.7.3. SWOT Analysis
- 11.2.7.4. Recent Developments
- 11.2.7.5. Financials (Based on Availability)
- 11.2.8 Amazon Basics
- 11.2.8.1. Overview
- 11.2.8.2. Products
- 11.2.8.3. SWOT Analysis
- 11.2.8.4. Recent Developments
- 11.2.8.5. Financials (Based on Availability)
- 11.2.9 Incipio
- 11.2.9.1. Overview
- 11.2.9.2. Products
- 11.2.9.3. SWOT Analysis
- 11.2.9.4. Recent Developments
- 11.2.9.5. Financials (Based on Availability)
- 11.2.10 Jasco
- 11.2.10.1. Overview
- 11.2.10.2. Products
- 11.2.10.3. SWOT Analysis
- 11.2.10.4. Recent Developments
- 11.2.10.5. Financials (Based on Availability)
- 11.2.11 Ventev
- 11.2.11.1. Overview
- 11.2.11.2. Products
- 11.2.11.3. SWOT Analysis
- 11.2.11.4. Recent Developments
- 11.2.11.5. Financials (Based on Availability)
- 11.2.12 RAVPower
- 11.2.12.1. Overview
- 11.2.12.2. Products
- 11.2.12.3. SWOT Analysis
- 11.2.12.4. Recent Developments
- 11.2.12.5. Financials (Based on Availability)
- 11.2.13 iLuv
- 11.2.13.1. Overview
- 11.2.13.2. Products
- 11.2.13.3. SWOT Analysis
- 11.2.13.4. Recent Developments
- 11.2.13.5. Financials (Based on Availability)
- 11.2.14 Philips
- 11.2.14.1. Overview
- 11.2.14.2. Products
- 11.2.14.3. SWOT Analysis
- 11.2.14.4. Recent Developments
- 11.2.14.5. Financials (Based on Availability)
- 11.2.15 IO Gear
- 11.2.15.1. Overview
- 11.2.15.2. Products
- 11.2.15.3. SWOT Analysis
- 11.2.15.4. Recent Developments
- 11.2.15.5. Financials (Based on Availability)
- 11.2.16 Monoprice
- 11.2.16.1. Overview
- 11.2.16.2. Products
- 11.2.16.3. SWOT Analysis
- 11.2.16.4. Recent Developments
- 11.2.16.5. Financials (Based on Availability)
- 11.2.17 Zendure
- 11.2.17.1. Overview
- 11.2.17.2. Products
- 11.2.17.3. SWOT Analysis
- 11.2.17.4. Recent Developments
- 11.2.17.5. Financials (Based on Availability)
- 11.2.18 360 Electrical
- 11.2.18.1. Overview
- 11.2.18.2. Products
- 11.2.18.3. SWOT Analysis
- 11.2.18.4. Recent Developments
- 11.2.18.5. Financials (Based on Availability)
- 11.2.19 E'aiito
- 11.2.19.1. Overview
- 11.2.19.2. Products
- 11.2.19.3. SWOT Analysis
- 11.2.19.4. Recent Developments
- 11.2.19.5. Financials (Based on Availability)
- 11.2.20 Unu Electronics
- 11.2.20.1. Overview
- 11.2.20.2. Products
- 11.2.20.3. SWOT Analysis
- 11.2.20.4. Recent Developments
- 11.2.20.5. Financials (Based on Availability)
- 11.2.21 Jackery
- 11.2.21.1. Overview
- 11.2.21.2. Products
- 11.2.21.3. SWOT Analysis
- 11.2.21.4. Recent Developments
- 11.2.21.5. Financials (Based on Availability)
- 11.2.22 Huntkey
- 11.2.22.1. Overview
- 11.2.22.2. Products
- 11.2.22.3. SWOT Analysis
- 11.2.22.4. Recent Developments
- 11.2.22.5. Financials (Based on Availability)
- 11.2.23 Cyntur
- 11.2.23.1. Overview
- 11.2.23.2. Products
- 11.2.23.3. SWOT Analysis
- 11.2.23.4. Recent Developments
- 11.2.23.5. Financials (Based on Availability)
- 11.2.24 Radio Shack
- 11.2.24.1. Overview
- 11.2.24.2. Products
- 11.2.24.3. SWOT Analysis
- 11.2.24.4. Recent Developments
- 11.2.24.5. Financials (Based on Availability)
- 11.2.1 Anker
List of Figures
- Figure 1: Global USB Chargers Revenue Breakdown (million, %) by Region 2025 & 2033
- Figure 2: North America USB Chargers Revenue (million), by Application 2025 & 2033
- Figure 3: North America USB Chargers Revenue Share (%), by Application 2025 & 2033
- Figure 4: North America USB Chargers Revenue (million), by Types 2025 & 2033
- Figure 5: North America USB Chargers Revenue Share (%), by Types 2025 & 2033
- Figure 6: North America USB Chargers Revenue (million), by Country 2025 & 2033
- Figure 7: North America USB Chargers Revenue Share (%), by Country 2025 & 2033
- Figure 8: South America USB Chargers Revenue (million), by Application 2025 & 2033
- Figure 9: South America USB Chargers Revenue Share (%), by Application 2025 & 2033
- Figure 10: South America USB Chargers Revenue (million), by Types 2025 & 2033
- Figure 11: South America USB Chargers Revenue Share (%), by Types 2025 & 2033
- Figure 12: South America USB Chargers Revenue (million), by Country 2025 & 2033
- Figure 13: South America USB Chargers Revenue Share (%), by Country 2025 & 2033
- Figure 14: Europe USB Chargers Revenue (million), by Application 2025 & 2033
- Figure 15: Europe USB Chargers Revenue Share (%), by Application 2025 & 2033
- Figure 16: Europe USB Chargers Revenue (million), by Types 2025 & 2033
- Figure 17: Europe USB Chargers Revenue Share (%), by Types 2025 & 2033
- Figure 18: Europe USB Chargers Revenue (million), by Country 2025 & 2033
- Figure 19: Europe USB Chargers Revenue Share (%), by Country 2025 & 2033
- Figure 20: Middle East & Africa USB Chargers Revenue (million), by Application 2025 & 2033
- Figure 21: Middle East & Africa USB Chargers Revenue Share (%), by Application 2025 & 2033
- Figure 22: Middle East & Africa USB Chargers Revenue (million), by Types 2025 & 2033
- Figure 23: Middle East & Africa USB Chargers Revenue Share (%), by Types 2025 & 2033
- Figure 24: Middle East & Africa USB Chargers Revenue (million), by Country 2025 & 2033
- Figure 25: Middle East & Africa USB Chargers Revenue Share (%), by Country 2025 & 2033
- Figure 26: Asia Pacific USB Chargers Revenue (million), by Application 2025 & 2033
- Figure 27: Asia Pacific USB Chargers Revenue Share (%), by Application 2025 & 2033
- Figure 28: Asia Pacific USB Chargers Revenue (million), by Types 2025 & 2033
- Figure 29: Asia Pacific USB Chargers Revenue Share (%), by Types 2025 & 2033
- Figure 30: Asia Pacific USB Chargers Revenue (million), by Country 2025 & 2033
- Figure 31: Asia Pacific USB Chargers Revenue Share (%), by Country 2025 & 2033
List of Tables
- Table 1: Global USB Chargers Revenue million Forecast, by Application 2020 & 2033
- Table 2: Global USB Chargers Revenue million Forecast, by Types 2020 & 2033
- Table 3: Global USB Chargers Revenue million Forecast, by Region 2020 & 2033
- Table 4: Global USB Chargers Revenue million Forecast, by Application 2020 & 2033
- Table 5: Global USB Chargers Revenue million Forecast, by Types 2020 & 2033
- Table 6: Global USB Chargers Revenue million Forecast, by Country 2020 & 2033
- Table 7: United States USB Chargers Revenue (million) Forecast, by Application 2020 & 2033
- Table 8: Canada USB Chargers Revenue (million) Forecast, by Application 2020 & 2033
- Table 9: Mexico USB Chargers Revenue (million) Forecast, by Application 2020 & 2033
- Table 10: Global USB Chargers Revenue million Forecast, by Application 2020 & 2033
- Table 11: Global USB Chargers Revenue million Forecast, by Types 2020 & 2033
- Table 12: Global USB Chargers Revenue million Forecast, by Country 2020 & 2033
- Table 13: Brazil USB Chargers Revenue (million) Forecast, by Application 2020 & 2033
- Table 14: Argentina USB Chargers Revenue (million) Forecast, by Application 2020 & 2033
- Table 15: Rest of South America USB Chargers Revenue (million) Forecast, by Application 2020 & 2033
- Table 16: Global USB Chargers Revenue million Forecast, by Application 2020 & 2033
- Table 17: Global USB Chargers Revenue million Forecast, by Types 2020 & 2033
- Table 18: Global USB Chargers Revenue million Forecast, by Country 2020 & 2033
- Table 19: United Kingdom USB Chargers Revenue (million) Forecast, by Application 2020 & 2033
- Table 20: Germany USB Chargers Revenue (million) Forecast, by Application 2020 & 2033
- Table 21: France USB Chargers Revenue (million) Forecast, by Application 2020 & 2033
- Table 22: Italy USB Chargers Revenue (million) Forecast, by Application 2020 & 2033
- Table 23: Spain USB Chargers Revenue (million) Forecast, by Application 2020 & 2033
- Table 24: Russia USB Chargers Revenue (million) Forecast, by Application 2020 & 2033
- Table 25: Benelux USB Chargers Revenue (million) Forecast, by Application 2020 & 2033
- Table 26: Nordics USB Chargers Revenue (million) Forecast, by Application 2020 & 2033
- Table 27: Rest of Europe USB Chargers Revenue (million) Forecast, by Application 2020 & 2033
- Table 28: Global USB Chargers Revenue million Forecast, by Application 2020 & 2033
- Table 29: Global USB Chargers Revenue million Forecast, by Types 2020 & 2033
- Table 30: Global USB Chargers Revenue million Forecast, by Country 2020 & 2033
- Table 31: Turkey USB Chargers Revenue (million) Forecast, by Application 2020 & 2033
- Table 32: Israel USB Chargers Revenue (million) Forecast, by Application 2020 & 2033
- Table 33: GCC USB Chargers Revenue (million) Forecast, by Application 2020 & 2033
- Table 34: North Africa USB Chargers Revenue (million) Forecast, by Application 2020 & 2033
- Table 35: South Africa USB Chargers Revenue (million) Forecast, by Application 2020 & 2033
- Table 36: Rest of Middle East & Africa USB Chargers Revenue (million) Forecast, by Application 2020 & 2033
- Table 37: Global USB Chargers Revenue million Forecast, by Application 2020 & 2033
- Table 38: Global USB Chargers Revenue million Forecast, by Types 2020 & 2033
- Table 39: Global USB Chargers Revenue million Forecast, by Country 2020 & 2033
- Table 40: China USB Chargers Revenue (million) Forecast, by Application 2020 & 2033
- Table 41: India USB Chargers Revenue (million) Forecast, by Application 2020 & 2033
- Table 42: Japan USB Chargers Revenue (million) Forecast, by Application 2020 & 2033
- Table 43: South Korea USB Chargers Revenue (million) Forecast, by Application 2020 & 2033
- Table 44: ASEAN USB Chargers Revenue (million) Forecast, by Application 2020 & 2033
- Table 45: Oceania USB Chargers Revenue (million) Forecast, by Application 2020 & 2033
- Table 46: Rest of Asia Pacific USB Chargers Revenue (million) Forecast, by Application 2020 & 2033
Frequently Asked Questions
1. What is the projected Compound Annual Growth Rate (CAGR) of the USB Chargers?
The projected CAGR is approximately XX%.
2. Which companies are prominent players in the USB Chargers?
Key companies in the market include Anker, Belkin, JQWAY, PowerAdd, Golf & Feihuang, Aukey, Mophie/Zagg, Amazon Basics, Incipio, Jasco, Ventev, RAVPower, iLuv, Philips, IO Gear, Monoprice, Zendure, 360 Electrical, E'aiito, Unu Electronics, Jackery, Huntkey, Cyntur, Radio Shack.
3. What are the main segments of the USB Chargers?
The market segments include Application, Types.
4. Can you provide details about the market size?
The market size is estimated to be USD XXX million as of 2022.
5. What are some drivers contributing to market growth?
N/A
6. What are the notable trends driving market growth?
N/A
7. Are there any restraints impacting market growth?
N/A
8. Can you provide examples of recent developments in the market?
N/A
9. What pricing options are available for accessing the report?
Pricing options include single-user, multi-user, and enterprise licenses priced at USD 2900.00, USD 4350.00, and USD 5800.00 respectively.
10. Is the market size provided in terms of value or volume?
The market size is provided in terms of value, measured in million.
11. Are there any specific market keywords associated with the report?
Yes, the market keyword associated with the report is "USB Chargers," which aids in identifying and referencing the specific market segment covered.
12. How do I determine which pricing option suits my needs best?
The pricing options vary based on user requirements and access needs. Individual users may opt for single-user licenses, while businesses requiring broader access may choose multi-user or enterprise licenses for cost-effective access to the report.
13. Are there any additional resources or data provided in the USB Chargers report?
While the report offers comprehensive insights, it's advisable to review the specific contents or supplementary materials provided to ascertain if additional resources or data are available.
14. How can I stay updated on further developments or reports in the USB Chargers?
To stay informed about further developments, trends, and reports in the USB Chargers, consider subscribing to industry newsletters, following relevant companies and organizations, or regularly checking reputable industry news sources and publications.
Methodology
Step 1 - Identification of Relevant Samples Size from Population Database


Step 2 - Approaches for Defining Global Market Size (Value, Volume* & Price*)

Note*: In applicable scenarios
Step 3 - Data Sources
Primary Research
- Web Analytics
- Survey Reports
- Research Institute
- Latest Research Reports
- Opinion Leaders
Secondary Research
- Annual Reports
- White Paper
- Latest Press Release
- Industry Association
- Paid Database
- Investor Presentations

Step 4 - Data Triangulation
Involves using different sources of information in order to increase the validity of a study
These sources are likely to be stakeholders in a program - participants, other researchers, program staff, other community members, and so on.
Then we put all data in single framework & apply various statistical tools to find out the dynamic on the market.
During the analysis stage, feedback from the stakeholder groups would be compared to determine areas of agreement as well as areas of divergence