
Key Insights
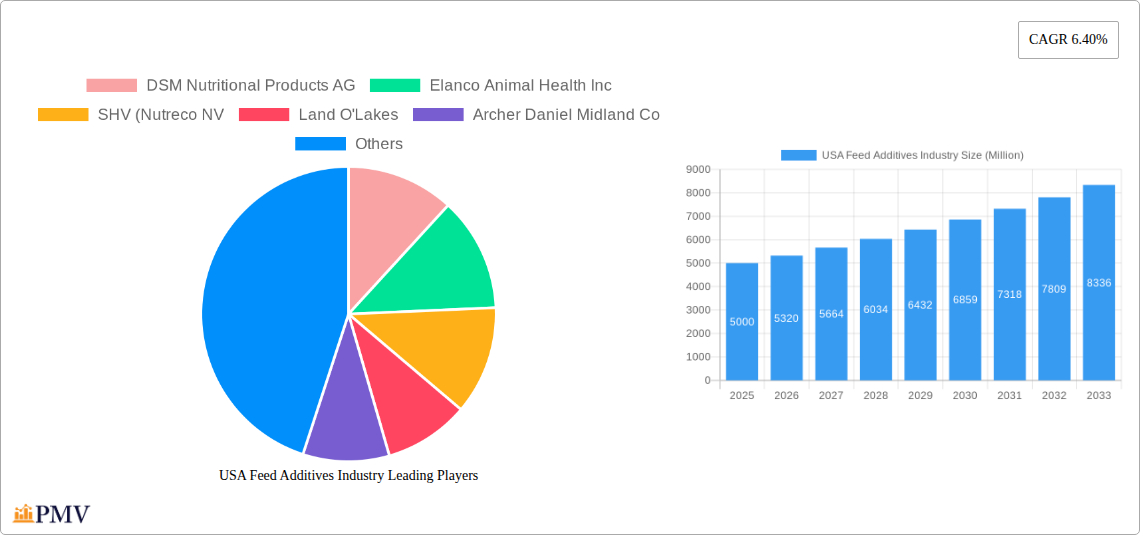
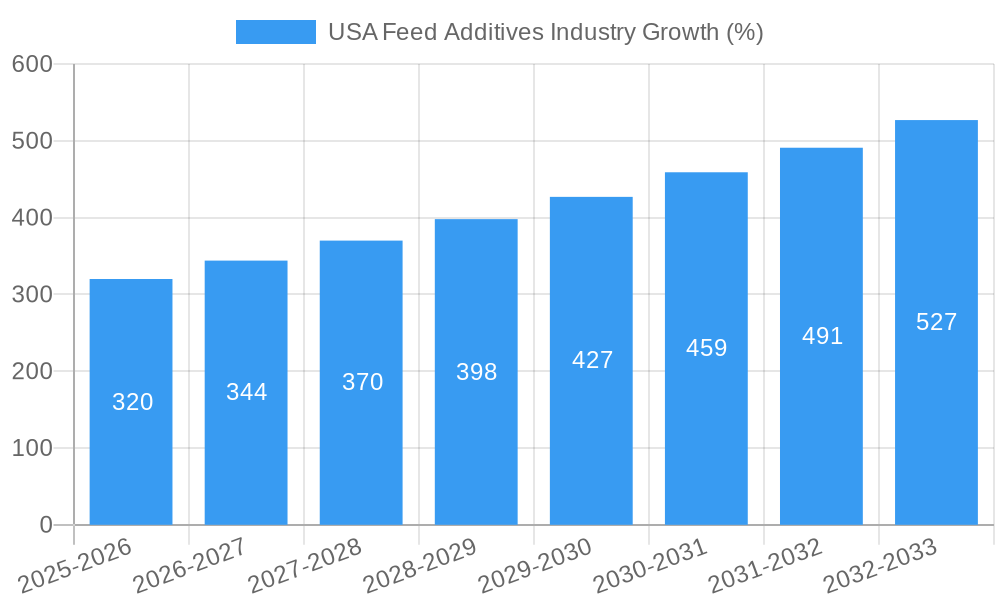
The US feed additives market, valued at approximately $5 billion in 2025, is projected to experience robust growth, exhibiting a compound annual growth rate (CAGR) of 6.40% from 2025 to 2033. This expansion is driven by several key factors. The increasing demand for animal protein globally fuels higher livestock production, thereby increasing the need for feed additives to enhance animal health, productivity, and feed efficiency. Furthermore, rising consumer awareness regarding animal welfare and the need for sustainable livestock farming practices are pushing the adoption of high-quality, specialized feed additives that promote animal health and minimize environmental impact. Technological advancements in feed additive formulations, including the development of novel, highly effective, and targeted additives, also contribute significantly to market growth. Specific segments within the market, such as acidifiers for improving gut health and additives for aquaculture, are expected to outperform others due to increased demand in these respective sectors. However, regulatory scrutiny regarding the use of certain additives and fluctuations in raw material costs pose potential challenges to sustained growth. Competition amongst established players like DSM, Elanco, and Cargill, alongside the emergence of innovative startups, shapes the market landscape, driving innovation and price competition.
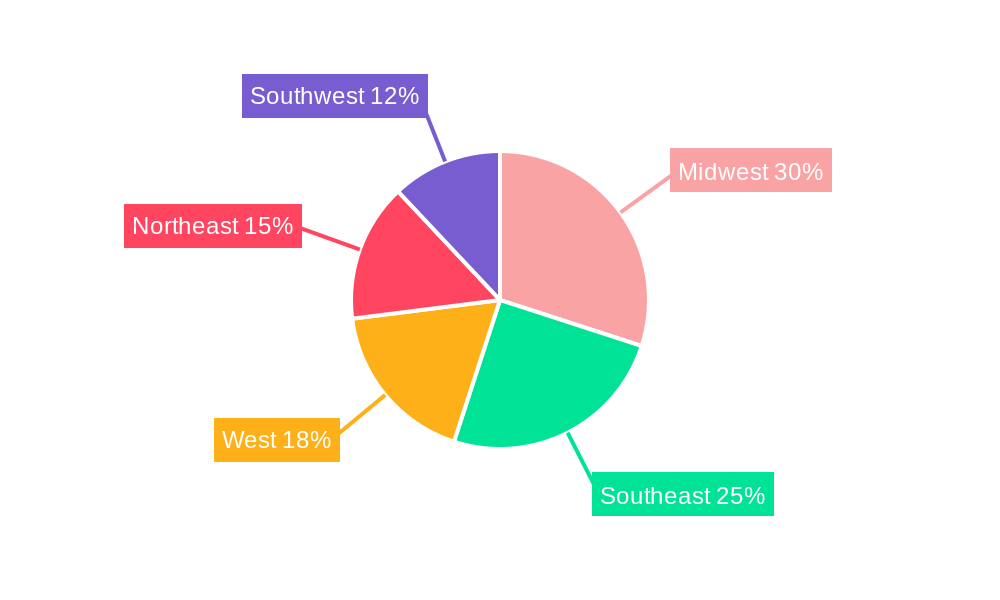
The regional distribution within the US shows variations in market share, with the Midwest and Southeast likely holding larger shares due to significant livestock concentrations. Growth within each region will be influenced by specific factors such as local regulations, agricultural practices, and the concentration of animal production facilities. The forecast period (2025-2033) presents considerable opportunities for market expansion, particularly for companies that leverage technological advancements, focus on sustainable solutions, and cater to the increasing demand for high-quality feed additives across various animal segments. The continued rise in consumer demand for meat and other animal products will continue to support growth in the sector. Companies focusing on developing innovative and environmentally friendly feed additives are well-positioned to capture a significant market share.
USA Feed Additives Industry Market Report: 2019-2033
This comprehensive report provides a detailed analysis of the USA Feed Additives industry, covering market size, segmentation, competitive landscape, growth drivers, and future outlook. The study period spans from 2019 to 2033, with 2025 serving as the base and estimated year. The report offers actionable insights for industry stakeholders, including manufacturers, distributors, and investors.
USA Feed Additives Industry Market Structure & Competitive Dynamics
The USA feed additives market exhibits a moderately concentrated structure, with several multinational corporations holding significant market share. Key players such as DSM Nutritional Products AG, Elanco Animal Health Inc, Cargill Inc, and BASF SE compete fiercely, leveraging their extensive distribution networks and R&D capabilities. The market is characterized by continuous innovation, driven by the demand for enhanced animal productivity, improved feed efficiency, and sustainable farming practices. Regulatory frameworks, such as FDA guidelines on feed additive safety and efficacy, significantly impact market dynamics. Product substitution, particularly with the rise of natural and plant-based alternatives, poses a challenge to conventional synthetic additives. End-user trends, including increasing demand for organic and sustainably produced animal products, further shape market dynamics. The market has witnessed significant M&A activity in recent years, as evidenced by:
- December 2022: Adisseo's acquisition of Nor-Feed, valued at approximately XX Million, signifying a strategic move into botanical additives.
- June 2022: The Delacon-Cargill partnership, creating a global player in plant-based phytogenic feed additives, showcasing collaborative growth strategies. The deal value is estimated at XX Million.
- These and other acquisitions reflect a consolidated market, with larger players seeking to expand their product portfolios and geographical reach. Market share analysis reveals that the top five players collectively hold approximately 60% of the market, while smaller specialized firms cater to niche segments.
USA Feed Additives Industry Industry Trends & Insights
The USA feed additives market is experiencing robust growth, driven by factors such as increasing livestock production, rising consumer demand for animal protein, and the growing adoption of advanced feed technologies. Technological advancements, such as the development of precision feeding systems and novel feed additives, are further propelling market expansion. Consumer preferences for sustainably produced animal products are driving demand for environmentally friendly and ethically sourced feed additives. The market is witnessing a shift towards plant-based and natural additives, presenting both opportunities and challenges for established players. The compound annual growth rate (CAGR) during the forecast period (2025-2033) is estimated at xx%, driven by several market drivers, including increased adoption of aquaculture in the country, regulatory bodies pushing towards better animal welfare, and advancements in animal nutrition knowledge.
Market penetration of novel feed additives, such as those aimed at improving gut health and reducing methane emissions, is gradually increasing, reflecting a growing awareness of the importance of animal health and environmental sustainability. The competitive landscape is characterized by intense rivalry, with companies constantly striving to innovate and differentiate their product offerings.
Dominant Markets & Segments in USA Feed Additives Industry
Within the USA feed additives market, the swine segment holds a dominant position, driven by the substantial size of the swine farming industry and the high demand for feed additives to enhance productivity and health. The aquaculture segment is experiencing rapid growth, fueled by the increasing global consumption of seafood and the adoption of intensive aquaculture practices.
Key Drivers for Swine Segment Dominance:
- High demand for pork: The substantial US pork production necessitates large volumes of feed additives.
- Focus on productivity: Producers prioritize feed efficiency and animal health to maximize profitability.
- Technological advancements: New feed additives are continuously developed to address specific challenges in swine production.
Key Drivers for Aquaculture Segment Growth:
- Rising seafood consumption: Increasing global demand for seafood drives aquaculture expansion.
- Intensive farming practices: High-density farming requires effective disease management and feed efficiency.
- Government support: Initiatives promoting sustainable aquaculture practices further stimulate growth.
The acidifiers segment is also prominent due to its crucial role in optimizing gut health and feed digestibility, benefits evident across various animal species. The other ruminants and other animals segments contribute significantly to the overall market, driven by the specific needs and challenges of these animal categories.
USA Feed Additives Industry Product Innovations
Recent innovations in the feed additives industry focus on enhancing animal health, improving feed efficiency, and promoting sustainability. Technological trends include the development of precision feed additives tailored to specific animal needs, plant-based alternatives to conventional synthetic additives, and feed additives designed to reduce environmental impact, such as methane-reducing additives. These innovations cater to the growing demand for healthier, more sustainable, and ethically produced animal products, aligning with market trends and consumer preferences.
Report Segmentation & Scope
The report segments the USA feed additives market across various animal species (aquaculture, swine, other ruminants, other animals) and additive types (acidifiers, other additives). Each segment is analyzed in detail, considering growth projections, market size, and competitive dynamics.
Aquaculture: This segment demonstrates a strong CAGR, fueled by increasing seafood demand and technological advancements in aquaculture practices.
Swine: This segment maintains a significant market share due to the scale of swine farming and focus on feed efficiency.
Other Ruminants: This segment exhibits steady growth, influenced by factors like beef consumption trends and focus on animal health.
Other Animals: This segment encompasses diverse animal species with varying needs, contributing substantially to the overall market.
Acidifiers: This category experiences consistent growth due to its essential role in enhancing digestion and gut health.
Other Additives: This broad category comprises numerous additives catering to specific animal needs, demonstrating diverse growth dynamics.
Key Drivers of USA Feed Additives Industry Growth
The growth of the USA feed additives market is driven by several key factors:
- Increased livestock production: Expanding livestock farming requires higher volumes of feed additives.
- Growing demand for animal protein: Rising global protein consumption fuels demand for efficient animal production.
- Technological advancements: Innovations in feed additive technology continuously improve animal health and productivity.
- Regulatory support: Government initiatives promoting sustainable animal agriculture positively impact market growth.
Challenges in the USA Feed Additives Industry Sector
The USA feed additives industry faces several challenges:
- Stringent regulatory requirements: Compliance with stringent safety and efficacy regulations adds to costs.
- Supply chain disruptions: Global events can disrupt raw material supply, impacting production.
- Fluctuations in raw material prices: Price volatility of raw materials influences production costs and profitability.
- Intense competition: The presence of numerous established players leads to price pressures.
Leading Players in the USA Feed Additives Industry Market
- DSM Nutritional Products AG
- Elanco Animal Health Inc
- SHV (Nutreco NV)
- Land O'Lakes
- Archer Daniel Midland Co
- BASF SE
- Alltech Inc
- Cargill Inc
- IFF (Danisco Animal Nutrition)
- Adisseo
Key Developments in USA Feed Additives Industry Sector
- April 2022: Elanco and Royal DSM partnered on Bovaer, a methane-reducing feed additive for cattle.
- June 2022: Delacon and Cargill collaborated to create a global plant-based phytogenic feed additives business.
- December 2022: Adisseo acquired Nor-Feed to expand into botanical additives.
Strategic USA Feed Additives Industry Market Outlook
The USA feed additives market holds significant future potential, driven by continued growth in livestock production, technological advancements, and increasing consumer demand for sustainable animal products. Strategic opportunities exist in developing innovative feed additives that address specific animal health and environmental challenges. Companies focusing on sustainable and ethically produced products are poised for success. Further M&A activity is anticipated as larger players seek to consolidate market share and expand their product portfolios. The focus on precision feeding and data-driven approaches will further shape the market’s trajectory.
USA Feed Additives Industry Segmentation
-
1. Additive
-
1.1. Acidifiers
-
1.1.1. By Sub Additive
- 1.1.1.1. Fumaric Acid
- 1.1.1.2. Lactic Acid
- 1.1.1.3. Propionic Acid
- 1.1.1.4. Other Acidifiers
-
1.1.1. By Sub Additive
-
1.2. Amino Acids
- 1.2.1. Lysine
- 1.2.2. Methionine
- 1.2.3. Threonine
- 1.2.4. Tryptophan
- 1.2.5. Other Amino Acids
-
1.3. Antioxidants
- 1.3.1. Butylated Hydroxyanisole (BHA)
- 1.3.2. Butylated Hydroxytoluene (BHT)
- 1.3.3. Citric Acid
- 1.3.4. Ethoxyquin
- 1.3.5. Propyl Gallate
- 1.3.6. Tocopherols
- 1.3.7. Other Antioxidants
-
1.4. Binders
- 1.4.1. Natural Binders
- 1.4.2. Synthetic Binders
-
1.5. Enzymes
- 1.5.1. Carbohydrases
- 1.5.2. Phytases
- 1.5.3. Other Enzymes
- 1.6. Flavors & Sweeteners
-
1.7. Minerals
- 1.7.1. Macrominerals
- 1.7.2. Microminerals
-
1.8. Mycotoxin Detoxifiers
- 1.8.1. Biotransformers
-
1.9. Phytogenics
- 1.9.1. Essential Oil
- 1.9.2. Herbs & Spices
- 1.9.3. Other Phytogenics
-
1.10. Pigments
- 1.10.1. Carotenoids
- 1.10.2. Curcumin & Spirulina
-
1.11. Prebiotics
- 1.11.1. Fructo Oligosaccharides
- 1.11.2. Galacto Oligosaccharides
- 1.11.3. Inulin
- 1.11.4. Lactulose
- 1.11.5. Mannan Oligosaccharides
- 1.11.6. Xylo Oligosaccharides
- 1.11.7. Other Prebiotics
-
1.12. Probiotics
- 1.12.1. Bifidobacteria
- 1.12.2. Enterococcus
- 1.12.3. Lactobacilli
- 1.12.4. Pediococcus
- 1.12.5. Streptococcus
- 1.12.6. Other Probiotics
-
1.13. Vitamins
- 1.13.1. Vitamin A
- 1.13.2. Vitamin B
- 1.13.3. Vitamin C
- 1.13.4. Vitamin E
- 1.13.5. Other Vitamins
-
1.14. Yeast
- 1.14.1. Live Yeast
- 1.14.2. Selenium Yeast
- 1.14.3. Spent Yeast
- 1.14.4. Torula Dried Yeast
- 1.14.5. Whey Yeast
- 1.14.6. Yeast Derivatives
-
1.1. Acidifiers
-
2. Animal
-
2.1. Aquaculture
-
2.1.1. By Sub Animal
- 2.1.1.1. Fish
- 2.1.1.2. Shrimp
- 2.1.1.3. Other Aquaculture Species
-
2.1.1. By Sub Animal
-
2.2. Poultry
- 2.2.1. Broiler
- 2.2.2. Layer
- 2.2.3. Other Poultry Birds
-
2.3. Ruminants
- 2.3.1. Beef Cattle
- 2.3.2. Dairy Cattle
- 2.3.3. Other Ruminants
- 2.4. Swine
- 2.5. Other Animals
-
2.1. Aquaculture
USA Feed Additives Industry Segmentation By Geography
-
1. North America
- 1.1. United States
- 1.2. Canada
- 1.3. Mexico
-
2. South America
- 2.1. Brazil
- 2.2. Argentina
- 2.3. Rest of South America
-
3. Europe
- 3.1. United Kingdom
- 3.2. Germany
- 3.3. France
- 3.4. Italy
- 3.5. Spain
- 3.6. Russia
- 3.7. Benelux
- 3.8. Nordics
- 3.9. Rest of Europe
-
4. Middle East & Africa
- 4.1. Turkey
- 4.2. Israel
- 4.3. GCC
- 4.4. North Africa
- 4.5. South Africa
- 4.6. Rest of Middle East & Africa
-
5. Asia Pacific
- 5.1. China
- 5.2. India
- 5.3. Japan
- 5.4. South Korea
- 5.5. ASEAN
- 5.6. Oceania
- 5.7. Rest of Asia Pacific
USA Feed Additives Industry REPORT HIGHLIGHTS
| Aspects | Details |
|---|---|
| Study Period | 2019-2033 |
| Base Year | 2024 |
| Estimated Year | 2025 |
| Forecast Period | 2025-2033 |
| Historical Period | 2019-2024 |
| Growth Rate | CAGR of 6.40% from 2019-2033 |
| Segmentation |
|
Table of Contents
- 1. Introduction
- 1.1. Research Scope
- 1.2. Market Segmentation
- 1.3. Research Methodology
- 1.4. Definitions and Assumptions
- 2. Executive Summary
- 2.1. Introduction
- 3. Market Dynamics
- 3.1. Introduction
- 3.2. Market Drivers
- 3.2.1. Growing Livestock Population; Area Under Forage Production is Increasing; Increasing Demand for Animal Products
- 3.3. Market Restrains
- 3.3.1. Competition Amongst Industries and High Input Prices; Growing Shift Toward Vegan-Based Diet
- 3.4. Market Trends
- 3.4.1. OTHER KEY INDUSTRY TRENDS COVERED IN THE REPORT
- 4. Market Factor Analysis
- 4.1. Porters Five Forces
- 4.2. Supply/Value Chain
- 4.3. PESTEL analysis
- 4.4. Market Entropy
- 4.5. Patent/Trademark Analysis
- 5. Global USA Feed Additives Industry Analysis, Insights and Forecast, 2019-2031
- 5.1. Market Analysis, Insights and Forecast - by Additive
- 5.1.1. Acidifiers
- 5.1.1.1. By Sub Additive
- 5.1.1.1.1. Fumaric Acid
- 5.1.1.1.2. Lactic Acid
- 5.1.1.1.3. Propionic Acid
- 5.1.1.1.4. Other Acidifiers
- 5.1.1.1. By Sub Additive
- 5.1.2. Amino Acids
- 5.1.2.1. Lysine
- 5.1.2.2. Methionine
- 5.1.2.3. Threonine
- 5.1.2.4. Tryptophan
- 5.1.2.5. Other Amino Acids
- 5.1.3. Antioxidants
- 5.1.3.1. Butylated Hydroxyanisole (BHA)
- 5.1.3.2. Butylated Hydroxytoluene (BHT)
- 5.1.3.3. Citric Acid
- 5.1.3.4. Ethoxyquin
- 5.1.3.5. Propyl Gallate
- 5.1.3.6. Tocopherols
- 5.1.3.7. Other Antioxidants
- 5.1.4. Binders
- 5.1.4.1. Natural Binders
- 5.1.4.2. Synthetic Binders
- 5.1.5. Enzymes
- 5.1.5.1. Carbohydrases
- 5.1.5.2. Phytases
- 5.1.5.3. Other Enzymes
- 5.1.6. Flavors & Sweeteners
- 5.1.7. Minerals
- 5.1.7.1. Macrominerals
- 5.1.7.2. Microminerals
- 5.1.8. Mycotoxin Detoxifiers
- 5.1.8.1. Biotransformers
- 5.1.9. Phytogenics
- 5.1.9.1. Essential Oil
- 5.1.9.2. Herbs & Spices
- 5.1.9.3. Other Phytogenics
- 5.1.10. Pigments
- 5.1.10.1. Carotenoids
- 5.1.10.2. Curcumin & Spirulina
- 5.1.11. Prebiotics
- 5.1.11.1. Fructo Oligosaccharides
- 5.1.11.2. Galacto Oligosaccharides
- 5.1.11.3. Inulin
- 5.1.11.4. Lactulose
- 5.1.11.5. Mannan Oligosaccharides
- 5.1.11.6. Xylo Oligosaccharides
- 5.1.11.7. Other Prebiotics
- 5.1.12. Probiotics
- 5.1.12.1. Bifidobacteria
- 5.1.12.2. Enterococcus
- 5.1.12.3. Lactobacilli
- 5.1.12.4. Pediococcus
- 5.1.12.5. Streptococcus
- 5.1.12.6. Other Probiotics
- 5.1.13. Vitamins
- 5.1.13.1. Vitamin A
- 5.1.13.2. Vitamin B
- 5.1.13.3. Vitamin C
- 5.1.13.4. Vitamin E
- 5.1.13.5. Other Vitamins
- 5.1.14. Yeast
- 5.1.14.1. Live Yeast
- 5.1.14.2. Selenium Yeast
- 5.1.14.3. Spent Yeast
- 5.1.14.4. Torula Dried Yeast
- 5.1.14.5. Whey Yeast
- 5.1.14.6. Yeast Derivatives
- 5.1.1. Acidifiers
- 5.2. Market Analysis, Insights and Forecast - by Animal
- 5.2.1. Aquaculture
- 5.2.1.1. By Sub Animal
- 5.2.1.1.1. Fish
- 5.2.1.1.2. Shrimp
- 5.2.1.1.3. Other Aquaculture Species
- 5.2.1.1. By Sub Animal
- 5.2.2. Poultry
- 5.2.2.1. Broiler
- 5.2.2.2. Layer
- 5.2.2.3. Other Poultry Birds
- 5.2.3. Ruminants
- 5.2.3.1. Beef Cattle
- 5.2.3.2. Dairy Cattle
- 5.2.3.3. Other Ruminants
- 5.2.4. Swine
- 5.2.5. Other Animals
- 5.2.1. Aquaculture
- 5.3. Market Analysis, Insights and Forecast - by Region
- 5.3.1. North America
- 5.3.2. South America
- 5.3.3. Europe
- 5.3.4. Middle East & Africa
- 5.3.5. Asia Pacific
- 5.1. Market Analysis, Insights and Forecast - by Additive
- 6. North America USA Feed Additives Industry Analysis, Insights and Forecast, 2019-2031
- 6.1. Market Analysis, Insights and Forecast - by Additive
- 6.1.1. Acidifiers
- 6.1.1.1. By Sub Additive
- 6.1.1.1.1. Fumaric Acid
- 6.1.1.1.2. Lactic Acid
- 6.1.1.1.3. Propionic Acid
- 6.1.1.1.4. Other Acidifiers
- 6.1.1.1. By Sub Additive
- 6.1.2. Amino Acids
- 6.1.2.1. Lysine
- 6.1.2.2. Methionine
- 6.1.2.3. Threonine
- 6.1.2.4. Tryptophan
- 6.1.2.5. Other Amino Acids
- 6.1.3. Antioxidants
- 6.1.3.1. Butylated Hydroxyanisole (BHA)
- 6.1.3.2. Butylated Hydroxytoluene (BHT)
- 6.1.3.3. Citric Acid
- 6.1.3.4. Ethoxyquin
- 6.1.3.5. Propyl Gallate
- 6.1.3.6. Tocopherols
- 6.1.3.7. Other Antioxidants
- 6.1.4. Binders
- 6.1.4.1. Natural Binders
- 6.1.4.2. Synthetic Binders
- 6.1.5. Enzymes
- 6.1.5.1. Carbohydrases
- 6.1.5.2. Phytases
- 6.1.5.3. Other Enzymes
- 6.1.6. Flavors & Sweeteners
- 6.1.7. Minerals
- 6.1.7.1. Macrominerals
- 6.1.7.2. Microminerals
- 6.1.8. Mycotoxin Detoxifiers
- 6.1.8.1. Biotransformers
- 6.1.9. Phytogenics
- 6.1.9.1. Essential Oil
- 6.1.9.2. Herbs & Spices
- 6.1.9.3. Other Phytogenics
- 6.1.10. Pigments
- 6.1.10.1. Carotenoids
- 6.1.10.2. Curcumin & Spirulina
- 6.1.11. Prebiotics
- 6.1.11.1. Fructo Oligosaccharides
- 6.1.11.2. Galacto Oligosaccharides
- 6.1.11.3. Inulin
- 6.1.11.4. Lactulose
- 6.1.11.5. Mannan Oligosaccharides
- 6.1.11.6. Xylo Oligosaccharides
- 6.1.11.7. Other Prebiotics
- 6.1.12. Probiotics
- 6.1.12.1. Bifidobacteria
- 6.1.12.2. Enterococcus
- 6.1.12.3. Lactobacilli
- 6.1.12.4. Pediococcus
- 6.1.12.5. Streptococcus
- 6.1.12.6. Other Probiotics
- 6.1.13. Vitamins
- 6.1.13.1. Vitamin A
- 6.1.13.2. Vitamin B
- 6.1.13.3. Vitamin C
- 6.1.13.4. Vitamin E
- 6.1.13.5. Other Vitamins
- 6.1.14. Yeast
- 6.1.14.1. Live Yeast
- 6.1.14.2. Selenium Yeast
- 6.1.14.3. Spent Yeast
- 6.1.14.4. Torula Dried Yeast
- 6.1.14.5. Whey Yeast
- 6.1.14.6. Yeast Derivatives
- 6.1.1. Acidifiers
- 6.2. Market Analysis, Insights and Forecast - by Animal
- 6.2.1. Aquaculture
- 6.2.1.1. By Sub Animal
- 6.2.1.1.1. Fish
- 6.2.1.1.2. Shrimp
- 6.2.1.1.3. Other Aquaculture Species
- 6.2.1.1. By Sub Animal
- 6.2.2. Poultry
- 6.2.2.1. Broiler
- 6.2.2.2. Layer
- 6.2.2.3. Other Poultry Birds
- 6.2.3. Ruminants
- 6.2.3.1. Beef Cattle
- 6.2.3.2. Dairy Cattle
- 6.2.3.3. Other Ruminants
- 6.2.4. Swine
- 6.2.5. Other Animals
- 6.2.1. Aquaculture
- 6.1. Market Analysis, Insights and Forecast - by Additive
- 7. South America USA Feed Additives Industry Analysis, Insights and Forecast, 2019-2031
- 7.1. Market Analysis, Insights and Forecast - by Additive
- 7.1.1. Acidifiers
- 7.1.1.1. By Sub Additive
- 7.1.1.1.1. Fumaric Acid
- 7.1.1.1.2. Lactic Acid
- 7.1.1.1.3. Propionic Acid
- 7.1.1.1.4. Other Acidifiers
- 7.1.1.1. By Sub Additive
- 7.1.2. Amino Acids
- 7.1.2.1. Lysine
- 7.1.2.2. Methionine
- 7.1.2.3. Threonine
- 7.1.2.4. Tryptophan
- 7.1.2.5. Other Amino Acids
- 7.1.3. Antioxidants
- 7.1.3.1. Butylated Hydroxyanisole (BHA)
- 7.1.3.2. Butylated Hydroxytoluene (BHT)
- 7.1.3.3. Citric Acid
- 7.1.3.4. Ethoxyquin
- 7.1.3.5. Propyl Gallate
- 7.1.3.6. Tocopherols
- 7.1.3.7. Other Antioxidants
- 7.1.4. Binders
- 7.1.4.1. Natural Binders
- 7.1.4.2. Synthetic Binders
- 7.1.5. Enzymes
- 7.1.5.1. Carbohydrases
- 7.1.5.2. Phytases
- 7.1.5.3. Other Enzymes
- 7.1.6. Flavors & Sweeteners
- 7.1.7. Minerals
- 7.1.7.1. Macrominerals
- 7.1.7.2. Microminerals
- 7.1.8. Mycotoxin Detoxifiers
- 7.1.8.1. Biotransformers
- 7.1.9. Phytogenics
- 7.1.9.1. Essential Oil
- 7.1.9.2. Herbs & Spices
- 7.1.9.3. Other Phytogenics
- 7.1.10. Pigments
- 7.1.10.1. Carotenoids
- 7.1.10.2. Curcumin & Spirulina
- 7.1.11. Prebiotics
- 7.1.11.1. Fructo Oligosaccharides
- 7.1.11.2. Galacto Oligosaccharides
- 7.1.11.3. Inulin
- 7.1.11.4. Lactulose
- 7.1.11.5. Mannan Oligosaccharides
- 7.1.11.6. Xylo Oligosaccharides
- 7.1.11.7. Other Prebiotics
- 7.1.12. Probiotics
- 7.1.12.1. Bifidobacteria
- 7.1.12.2. Enterococcus
- 7.1.12.3. Lactobacilli
- 7.1.12.4. Pediococcus
- 7.1.12.5. Streptococcus
- 7.1.12.6. Other Probiotics
- 7.1.13. Vitamins
- 7.1.13.1. Vitamin A
- 7.1.13.2. Vitamin B
- 7.1.13.3. Vitamin C
- 7.1.13.4. Vitamin E
- 7.1.13.5. Other Vitamins
- 7.1.14. Yeast
- 7.1.14.1. Live Yeast
- 7.1.14.2. Selenium Yeast
- 7.1.14.3. Spent Yeast
- 7.1.14.4. Torula Dried Yeast
- 7.1.14.5. Whey Yeast
- 7.1.14.6. Yeast Derivatives
- 7.1.1. Acidifiers
- 7.2. Market Analysis, Insights and Forecast - by Animal
- 7.2.1. Aquaculture
- 7.2.1.1. By Sub Animal
- 7.2.1.1.1. Fish
- 7.2.1.1.2. Shrimp
- 7.2.1.1.3. Other Aquaculture Species
- 7.2.1.1. By Sub Animal
- 7.2.2. Poultry
- 7.2.2.1. Broiler
- 7.2.2.2. Layer
- 7.2.2.3. Other Poultry Birds
- 7.2.3. Ruminants
- 7.2.3.1. Beef Cattle
- 7.2.3.2. Dairy Cattle
- 7.2.3.3. Other Ruminants
- 7.2.4. Swine
- 7.2.5. Other Animals
- 7.2.1. Aquaculture
- 7.1. Market Analysis, Insights and Forecast - by Additive
- 8. Europe USA Feed Additives Industry Analysis, Insights and Forecast, 2019-2031
- 8.1. Market Analysis, Insights and Forecast - by Additive
- 8.1.1. Acidifiers
- 8.1.1.1. By Sub Additive
- 8.1.1.1.1. Fumaric Acid
- 8.1.1.1.2. Lactic Acid
- 8.1.1.1.3. Propionic Acid
- 8.1.1.1.4. Other Acidifiers
- 8.1.1.1. By Sub Additive
- 8.1.2. Amino Acids
- 8.1.2.1. Lysine
- 8.1.2.2. Methionine
- 8.1.2.3. Threonine
- 8.1.2.4. Tryptophan
- 8.1.2.5. Other Amino Acids
- 8.1.3. Antioxidants
- 8.1.3.1. Butylated Hydroxyanisole (BHA)
- 8.1.3.2. Butylated Hydroxytoluene (BHT)
- 8.1.3.3. Citric Acid
- 8.1.3.4. Ethoxyquin
- 8.1.3.5. Propyl Gallate
- 8.1.3.6. Tocopherols
- 8.1.3.7. Other Antioxidants
- 8.1.4. Binders
- 8.1.4.1. Natural Binders
- 8.1.4.2. Synthetic Binders
- 8.1.5. Enzymes
- 8.1.5.1. Carbohydrases
- 8.1.5.2. Phytases
- 8.1.5.3. Other Enzymes
- 8.1.6. Flavors & Sweeteners
- 8.1.7. Minerals
- 8.1.7.1. Macrominerals
- 8.1.7.2. Microminerals
- 8.1.8. Mycotoxin Detoxifiers
- 8.1.8.1. Biotransformers
- 8.1.9. Phytogenics
- 8.1.9.1. Essential Oil
- 8.1.9.2. Herbs & Spices
- 8.1.9.3. Other Phytogenics
- 8.1.10. Pigments
- 8.1.10.1. Carotenoids
- 8.1.10.2. Curcumin & Spirulina
- 8.1.11. Prebiotics
- 8.1.11.1. Fructo Oligosaccharides
- 8.1.11.2. Galacto Oligosaccharides
- 8.1.11.3. Inulin
- 8.1.11.4. Lactulose
- 8.1.11.5. Mannan Oligosaccharides
- 8.1.11.6. Xylo Oligosaccharides
- 8.1.11.7. Other Prebiotics
- 8.1.12. Probiotics
- 8.1.12.1. Bifidobacteria
- 8.1.12.2. Enterococcus
- 8.1.12.3. Lactobacilli
- 8.1.12.4. Pediococcus
- 8.1.12.5. Streptococcus
- 8.1.12.6. Other Probiotics
- 8.1.13. Vitamins
- 8.1.13.1. Vitamin A
- 8.1.13.2. Vitamin B
- 8.1.13.3. Vitamin C
- 8.1.13.4. Vitamin E
- 8.1.13.5. Other Vitamins
- 8.1.14. Yeast
- 8.1.14.1. Live Yeast
- 8.1.14.2. Selenium Yeast
- 8.1.14.3. Spent Yeast
- 8.1.14.4. Torula Dried Yeast
- 8.1.14.5. Whey Yeast
- 8.1.14.6. Yeast Derivatives
- 8.1.1. Acidifiers
- 8.2. Market Analysis, Insights and Forecast - by Animal
- 8.2.1. Aquaculture
- 8.2.1.1. By Sub Animal
- 8.2.1.1.1. Fish
- 8.2.1.1.2. Shrimp
- 8.2.1.1.3. Other Aquaculture Species
- 8.2.1.1. By Sub Animal
- 8.2.2. Poultry
- 8.2.2.1. Broiler
- 8.2.2.2. Layer
- 8.2.2.3. Other Poultry Birds
- 8.2.3. Ruminants
- 8.2.3.1. Beef Cattle
- 8.2.3.2. Dairy Cattle
- 8.2.3.3. Other Ruminants
- 8.2.4. Swine
- 8.2.5. Other Animals
- 8.2.1. Aquaculture
- 8.1. Market Analysis, Insights and Forecast - by Additive
- 9. Middle East & Africa USA Feed Additives Industry Analysis, Insights and Forecast, 2019-2031
- 9.1. Market Analysis, Insights and Forecast - by Additive
- 9.1.1. Acidifiers
- 9.1.1.1. By Sub Additive
- 9.1.1.1.1. Fumaric Acid
- 9.1.1.1.2. Lactic Acid
- 9.1.1.1.3. Propionic Acid
- 9.1.1.1.4. Other Acidifiers
- 9.1.1.1. By Sub Additive
- 9.1.2. Amino Acids
- 9.1.2.1. Lysine
- 9.1.2.2. Methionine
- 9.1.2.3. Threonine
- 9.1.2.4. Tryptophan
- 9.1.2.5. Other Amino Acids
- 9.1.3. Antioxidants
- 9.1.3.1. Butylated Hydroxyanisole (BHA)
- 9.1.3.2. Butylated Hydroxytoluene (BHT)
- 9.1.3.3. Citric Acid
- 9.1.3.4. Ethoxyquin
- 9.1.3.5. Propyl Gallate
- 9.1.3.6. Tocopherols
- 9.1.3.7. Other Antioxidants
- 9.1.4. Binders
- 9.1.4.1. Natural Binders
- 9.1.4.2. Synthetic Binders
- 9.1.5. Enzymes
- 9.1.5.1. Carbohydrases
- 9.1.5.2. Phytases
- 9.1.5.3. Other Enzymes
- 9.1.6. Flavors & Sweeteners
- 9.1.7. Minerals
- 9.1.7.1. Macrominerals
- 9.1.7.2. Microminerals
- 9.1.8. Mycotoxin Detoxifiers
- 9.1.8.1. Biotransformers
- 9.1.9. Phytogenics
- 9.1.9.1. Essential Oil
- 9.1.9.2. Herbs & Spices
- 9.1.9.3. Other Phytogenics
- 9.1.10. Pigments
- 9.1.10.1. Carotenoids
- 9.1.10.2. Curcumin & Spirulina
- 9.1.11. Prebiotics
- 9.1.11.1. Fructo Oligosaccharides
- 9.1.11.2. Galacto Oligosaccharides
- 9.1.11.3. Inulin
- 9.1.11.4. Lactulose
- 9.1.11.5. Mannan Oligosaccharides
- 9.1.11.6. Xylo Oligosaccharides
- 9.1.11.7. Other Prebiotics
- 9.1.12. Probiotics
- 9.1.12.1. Bifidobacteria
- 9.1.12.2. Enterococcus
- 9.1.12.3. Lactobacilli
- 9.1.12.4. Pediococcus
- 9.1.12.5. Streptococcus
- 9.1.12.6. Other Probiotics
- 9.1.13. Vitamins
- 9.1.13.1. Vitamin A
- 9.1.13.2. Vitamin B
- 9.1.13.3. Vitamin C
- 9.1.13.4. Vitamin E
- 9.1.13.5. Other Vitamins
- 9.1.14. Yeast
- 9.1.14.1. Live Yeast
- 9.1.14.2. Selenium Yeast
- 9.1.14.3. Spent Yeast
- 9.1.14.4. Torula Dried Yeast
- 9.1.14.5. Whey Yeast
- 9.1.14.6. Yeast Derivatives
- 9.1.1. Acidifiers
- 9.2. Market Analysis, Insights and Forecast - by Animal
- 9.2.1. Aquaculture
- 9.2.1.1. By Sub Animal
- 9.2.1.1.1. Fish
- 9.2.1.1.2. Shrimp
- 9.2.1.1.3. Other Aquaculture Species
- 9.2.1.1. By Sub Animal
- 9.2.2. Poultry
- 9.2.2.1. Broiler
- 9.2.2.2. Layer
- 9.2.2.3. Other Poultry Birds
- 9.2.3. Ruminants
- 9.2.3.1. Beef Cattle
- 9.2.3.2. Dairy Cattle
- 9.2.3.3. Other Ruminants
- 9.2.4. Swine
- 9.2.5. Other Animals
- 9.2.1. Aquaculture
- 9.1. Market Analysis, Insights and Forecast - by Additive
- 10. Asia Pacific USA Feed Additives Industry Analysis, Insights and Forecast, 2019-2031
- 10.1. Market Analysis, Insights and Forecast - by Additive
- 10.1.1. Acidifiers
- 10.1.1.1. By Sub Additive
- 10.1.1.1.1. Fumaric Acid
- 10.1.1.1.2. Lactic Acid
- 10.1.1.1.3. Propionic Acid
- 10.1.1.1.4. Other Acidifiers
- 10.1.1.1. By Sub Additive
- 10.1.2. Amino Acids
- 10.1.2.1. Lysine
- 10.1.2.2. Methionine
- 10.1.2.3. Threonine
- 10.1.2.4. Tryptophan
- 10.1.2.5. Other Amino Acids
- 10.1.3. Antioxidants
- 10.1.3.1. Butylated Hydroxyanisole (BHA)
- 10.1.3.2. Butylated Hydroxytoluene (BHT)
- 10.1.3.3. Citric Acid
- 10.1.3.4. Ethoxyquin
- 10.1.3.5. Propyl Gallate
- 10.1.3.6. Tocopherols
- 10.1.3.7. Other Antioxidants
- 10.1.4. Binders
- 10.1.4.1. Natural Binders
- 10.1.4.2. Synthetic Binders
- 10.1.5. Enzymes
- 10.1.5.1. Carbohydrases
- 10.1.5.2. Phytases
- 10.1.5.3. Other Enzymes
- 10.1.6. Flavors & Sweeteners
- 10.1.7. Minerals
- 10.1.7.1. Macrominerals
- 10.1.7.2. Microminerals
- 10.1.8. Mycotoxin Detoxifiers
- 10.1.8.1. Biotransformers
- 10.1.9. Phytogenics
- 10.1.9.1. Essential Oil
- 10.1.9.2. Herbs & Spices
- 10.1.9.3. Other Phytogenics
- 10.1.10. Pigments
- 10.1.10.1. Carotenoids
- 10.1.10.2. Curcumin & Spirulina
- 10.1.11. Prebiotics
- 10.1.11.1. Fructo Oligosaccharides
- 10.1.11.2. Galacto Oligosaccharides
- 10.1.11.3. Inulin
- 10.1.11.4. Lactulose
- 10.1.11.5. Mannan Oligosaccharides
- 10.1.11.6. Xylo Oligosaccharides
- 10.1.11.7. Other Prebiotics
- 10.1.12. Probiotics
- 10.1.12.1. Bifidobacteria
- 10.1.12.2. Enterococcus
- 10.1.12.3. Lactobacilli
- 10.1.12.4. Pediococcus
- 10.1.12.5. Streptococcus
- 10.1.12.6. Other Probiotics
- 10.1.13. Vitamins
- 10.1.13.1. Vitamin A
- 10.1.13.2. Vitamin B
- 10.1.13.3. Vitamin C
- 10.1.13.4. Vitamin E
- 10.1.13.5. Other Vitamins
- 10.1.14. Yeast
- 10.1.14.1. Live Yeast
- 10.1.14.2. Selenium Yeast
- 10.1.14.3. Spent Yeast
- 10.1.14.4. Torula Dried Yeast
- 10.1.14.5. Whey Yeast
- 10.1.14.6. Yeast Derivatives
- 10.1.1. Acidifiers
- 10.2. Market Analysis, Insights and Forecast - by Animal
- 10.2.1. Aquaculture
- 10.2.1.1. By Sub Animal
- 10.2.1.1.1. Fish
- 10.2.1.1.2. Shrimp
- 10.2.1.1.3. Other Aquaculture Species
- 10.2.1.1. By Sub Animal
- 10.2.2. Poultry
- 10.2.2.1. Broiler
- 10.2.2.2. Layer
- 10.2.2.3. Other Poultry Birds
- 10.2.3. Ruminants
- 10.2.3.1. Beef Cattle
- 10.2.3.2. Dairy Cattle
- 10.2.3.3. Other Ruminants
- 10.2.4. Swine
- 10.2.5. Other Animals
- 10.2.1. Aquaculture
- 10.1. Market Analysis, Insights and Forecast - by Additive
- 11. Northeast USA Feed Additives Industry Analysis, Insights and Forecast, 2019-2031
- 12. Southeast USA Feed Additives Industry Analysis, Insights and Forecast, 2019-2031
- 13. Midwest USA Feed Additives Industry Analysis, Insights and Forecast, 2019-2031
- 14. Southwest USA Feed Additives Industry Analysis, Insights and Forecast, 2019-2031
- 15. West USA Feed Additives Industry Analysis, Insights and Forecast, 2019-2031
- 16. Competitive Analysis
- 16.1. Global Market Share Analysis 2024
- 16.2. Company Profiles
- 16.2.1 DSM Nutritional Products AG
- 16.2.1.1. Overview
- 16.2.1.2. Products
- 16.2.1.3. SWOT Analysis
- 16.2.1.4. Recent Developments
- 16.2.1.5. Financials (Based on Availability)
- 16.2.2 Elanco Animal Health Inc
- 16.2.2.1. Overview
- 16.2.2.2. Products
- 16.2.2.3. SWOT Analysis
- 16.2.2.4. Recent Developments
- 16.2.2.5. Financials (Based on Availability)
- 16.2.3 SHV (Nutreco NV
- 16.2.3.1. Overview
- 16.2.3.2. Products
- 16.2.3.3. SWOT Analysis
- 16.2.3.4. Recent Developments
- 16.2.3.5. Financials (Based on Availability)
- 16.2.4 Land O'Lakes
- 16.2.4.1. Overview
- 16.2.4.2. Products
- 16.2.4.3. SWOT Analysis
- 16.2.4.4. Recent Developments
- 16.2.4.5. Financials (Based on Availability)
- 16.2.5 Archer Daniel Midland Co
- 16.2.5.1. Overview
- 16.2.5.2. Products
- 16.2.5.3. SWOT Analysis
- 16.2.5.4. Recent Developments
- 16.2.5.5. Financials (Based on Availability)
- 16.2.6 BASF SE
- 16.2.6.1. Overview
- 16.2.6.2. Products
- 16.2.6.3. SWOT Analysis
- 16.2.6.4. Recent Developments
- 16.2.6.5. Financials (Based on Availability)
- 16.2.7 Alltech Inc
- 16.2.7.1. Overview
- 16.2.7.2. Products
- 16.2.7.3. SWOT Analysis
- 16.2.7.4. Recent Developments
- 16.2.7.5. Financials (Based on Availability)
- 16.2.8 Cargill Inc
- 16.2.8.1. Overview
- 16.2.8.2. Products
- 16.2.8.3. SWOT Analysis
- 16.2.8.4. Recent Developments
- 16.2.8.5. Financials (Based on Availability)
- 16.2.9 IFF(Danisco Animal Nutrition)
- 16.2.9.1. Overview
- 16.2.9.2. Products
- 16.2.9.3. SWOT Analysis
- 16.2.9.4. Recent Developments
- 16.2.9.5. Financials (Based on Availability)
- 16.2.10 Adisseo
- 16.2.10.1. Overview
- 16.2.10.2. Products
- 16.2.10.3. SWOT Analysis
- 16.2.10.4. Recent Developments
- 16.2.10.5. Financials (Based on Availability)
- 16.2.1 DSM Nutritional Products AG
List of Figures
- Figure 1: Global USA Feed Additives Industry Revenue Breakdown (Million, %) by Region 2024 & 2032
- Figure 2: United states USA Feed Additives Industry Revenue (Million), by Country 2024 & 2032
- Figure 3: United states USA Feed Additives Industry Revenue Share (%), by Country 2024 & 2032
- Figure 4: North America USA Feed Additives Industry Revenue (Million), by Additive 2024 & 2032
- Figure 5: North America USA Feed Additives Industry Revenue Share (%), by Additive 2024 & 2032
- Figure 6: North America USA Feed Additives Industry Revenue (Million), by Animal 2024 & 2032
- Figure 7: North America USA Feed Additives Industry Revenue Share (%), by Animal 2024 & 2032
- Figure 8: North America USA Feed Additives Industry Revenue (Million), by Country 2024 & 2032
- Figure 9: North America USA Feed Additives Industry Revenue Share (%), by Country 2024 & 2032
- Figure 10: South America USA Feed Additives Industry Revenue (Million), by Additive 2024 & 2032
- Figure 11: South America USA Feed Additives Industry Revenue Share (%), by Additive 2024 & 2032
- Figure 12: South America USA Feed Additives Industry Revenue (Million), by Animal 2024 & 2032
- Figure 13: South America USA Feed Additives Industry Revenue Share (%), by Animal 2024 & 2032
- Figure 14: South America USA Feed Additives Industry Revenue (Million), by Country 2024 & 2032
- Figure 15: South America USA Feed Additives Industry Revenue Share (%), by Country 2024 & 2032
- Figure 16: Europe USA Feed Additives Industry Revenue (Million), by Additive 2024 & 2032
- Figure 17: Europe USA Feed Additives Industry Revenue Share (%), by Additive 2024 & 2032
- Figure 18: Europe USA Feed Additives Industry Revenue (Million), by Animal 2024 & 2032
- Figure 19: Europe USA Feed Additives Industry Revenue Share (%), by Animal 2024 & 2032
- Figure 20: Europe USA Feed Additives Industry Revenue (Million), by Country 2024 & 2032
- Figure 21: Europe USA Feed Additives Industry Revenue Share (%), by Country 2024 & 2032
- Figure 22: Middle East & Africa USA Feed Additives Industry Revenue (Million), by Additive 2024 & 2032
- Figure 23: Middle East & Africa USA Feed Additives Industry Revenue Share (%), by Additive 2024 & 2032
- Figure 24: Middle East & Africa USA Feed Additives Industry Revenue (Million), by Animal 2024 & 2032
- Figure 25: Middle East & Africa USA Feed Additives Industry Revenue Share (%), by Animal 2024 & 2032
- Figure 26: Middle East & Africa USA Feed Additives Industry Revenue (Million), by Country 2024 & 2032
- Figure 27: Middle East & Africa USA Feed Additives Industry Revenue Share (%), by Country 2024 & 2032
- Figure 28: Asia Pacific USA Feed Additives Industry Revenue (Million), by Additive 2024 & 2032
- Figure 29: Asia Pacific USA Feed Additives Industry Revenue Share (%), by Additive 2024 & 2032
- Figure 30: Asia Pacific USA Feed Additives Industry Revenue (Million), by Animal 2024 & 2032
- Figure 31: Asia Pacific USA Feed Additives Industry Revenue Share (%), by Animal 2024 & 2032
- Figure 32: Asia Pacific USA Feed Additives Industry Revenue (Million), by Country 2024 & 2032
- Figure 33: Asia Pacific USA Feed Additives Industry Revenue Share (%), by Country 2024 & 2032
List of Tables
- Table 1: Global USA Feed Additives Industry Revenue Million Forecast, by Region 2019 & 2032
- Table 2: Global USA Feed Additives Industry Revenue Million Forecast, by Additive 2019 & 2032
- Table 3: Global USA Feed Additives Industry Revenue Million Forecast, by Animal 2019 & 2032
- Table 4: Global USA Feed Additives Industry Revenue Million Forecast, by Region 2019 & 2032
- Table 5: Global USA Feed Additives Industry Revenue Million Forecast, by Country 2019 & 2032
- Table 6: Northeast USA Feed Additives Industry Revenue (Million) Forecast, by Application 2019 & 2032
- Table 7: Southeast USA Feed Additives Industry Revenue (Million) Forecast, by Application 2019 & 2032
- Table 8: Midwest USA Feed Additives Industry Revenue (Million) Forecast, by Application 2019 & 2032
- Table 9: Southwest USA Feed Additives Industry Revenue (Million) Forecast, by Application 2019 & 2032
- Table 10: West USA Feed Additives Industry Revenue (Million) Forecast, by Application 2019 & 2032
- Table 11: Global USA Feed Additives Industry Revenue Million Forecast, by Additive 2019 & 2032
- Table 12: Global USA Feed Additives Industry Revenue Million Forecast, by Animal 2019 & 2032
- Table 13: Global USA Feed Additives Industry Revenue Million Forecast, by Country 2019 & 2032
- Table 14: United States USA Feed Additives Industry Revenue (Million) Forecast, by Application 2019 & 2032
- Table 15: Canada USA Feed Additives Industry Revenue (Million) Forecast, by Application 2019 & 2032
- Table 16: Mexico USA Feed Additives Industry Revenue (Million) Forecast, by Application 2019 & 2032
- Table 17: Global USA Feed Additives Industry Revenue Million Forecast, by Additive 2019 & 2032
- Table 18: Global USA Feed Additives Industry Revenue Million Forecast, by Animal 2019 & 2032
- Table 19: Global USA Feed Additives Industry Revenue Million Forecast, by Country 2019 & 2032
- Table 20: Brazil USA Feed Additives Industry Revenue (Million) Forecast, by Application 2019 & 2032
- Table 21: Argentina USA Feed Additives Industry Revenue (Million) Forecast, by Application 2019 & 2032
- Table 22: Rest of South America USA Feed Additives Industry Revenue (Million) Forecast, by Application 2019 & 2032
- Table 23: Global USA Feed Additives Industry Revenue Million Forecast, by Additive 2019 & 2032
- Table 24: Global USA Feed Additives Industry Revenue Million Forecast, by Animal 2019 & 2032
- Table 25: Global USA Feed Additives Industry Revenue Million Forecast, by Country 2019 & 2032
- Table 26: United Kingdom USA Feed Additives Industry Revenue (Million) Forecast, by Application 2019 & 2032
- Table 27: Germany USA Feed Additives Industry Revenue (Million) Forecast, by Application 2019 & 2032
- Table 28: France USA Feed Additives Industry Revenue (Million) Forecast, by Application 2019 & 2032
- Table 29: Italy USA Feed Additives Industry Revenue (Million) Forecast, by Application 2019 & 2032
- Table 30: Spain USA Feed Additives Industry Revenue (Million) Forecast, by Application 2019 & 2032
- Table 31: Russia USA Feed Additives Industry Revenue (Million) Forecast, by Application 2019 & 2032
- Table 32: Benelux USA Feed Additives Industry Revenue (Million) Forecast, by Application 2019 & 2032
- Table 33: Nordics USA Feed Additives Industry Revenue (Million) Forecast, by Application 2019 & 2032
- Table 34: Rest of Europe USA Feed Additives Industry Revenue (Million) Forecast, by Application 2019 & 2032
- Table 35: Global USA Feed Additives Industry Revenue Million Forecast, by Additive 2019 & 2032
- Table 36: Global USA Feed Additives Industry Revenue Million Forecast, by Animal 2019 & 2032
- Table 37: Global USA Feed Additives Industry Revenue Million Forecast, by Country 2019 & 2032
- Table 38: Turkey USA Feed Additives Industry Revenue (Million) Forecast, by Application 2019 & 2032
- Table 39: Israel USA Feed Additives Industry Revenue (Million) Forecast, by Application 2019 & 2032
- Table 40: GCC USA Feed Additives Industry Revenue (Million) Forecast, by Application 2019 & 2032
- Table 41: North Africa USA Feed Additives Industry Revenue (Million) Forecast, by Application 2019 & 2032
- Table 42: South Africa USA Feed Additives Industry Revenue (Million) Forecast, by Application 2019 & 2032
- Table 43: Rest of Middle East & Africa USA Feed Additives Industry Revenue (Million) Forecast, by Application 2019 & 2032
- Table 44: Global USA Feed Additives Industry Revenue Million Forecast, by Additive 2019 & 2032
- Table 45: Global USA Feed Additives Industry Revenue Million Forecast, by Animal 2019 & 2032
- Table 46: Global USA Feed Additives Industry Revenue Million Forecast, by Country 2019 & 2032
- Table 47: China USA Feed Additives Industry Revenue (Million) Forecast, by Application 2019 & 2032
- Table 48: India USA Feed Additives Industry Revenue (Million) Forecast, by Application 2019 & 2032
- Table 49: Japan USA Feed Additives Industry Revenue (Million) Forecast, by Application 2019 & 2032
- Table 50: South Korea USA Feed Additives Industry Revenue (Million) Forecast, by Application 2019 & 2032
- Table 51: ASEAN USA Feed Additives Industry Revenue (Million) Forecast, by Application 2019 & 2032
- Table 52: Oceania USA Feed Additives Industry Revenue (Million) Forecast, by Application 2019 & 2032
- Table 53: Rest of Asia Pacific USA Feed Additives Industry Revenue (Million) Forecast, by Application 2019 & 2032
Frequently Asked Questions
1. What is the projected Compound Annual Growth Rate (CAGR) of the USA Feed Additives Industry?
The projected CAGR is approximately 6.40%.
2. Which companies are prominent players in the USA Feed Additives Industry?
Key companies in the market include DSM Nutritional Products AG, Elanco Animal Health Inc, SHV (Nutreco NV, Land O'Lakes, Archer Daniel Midland Co, BASF SE, Alltech Inc, Cargill Inc, IFF(Danisco Animal Nutrition), Adisseo.
3. What are the main segments of the USA Feed Additives Industry?
The market segments include Additive, Animal.
4. Can you provide details about the market size?
The market size is estimated to be USD XX Million as of 2022.
5. What are some drivers contributing to market growth?
Growing Livestock Population; Area Under Forage Production is Increasing; Increasing Demand for Animal Products.
6. What are the notable trends driving market growth?
OTHER KEY INDUSTRY TRENDS COVERED IN THE REPORT.
7. Are there any restraints impacting market growth?
Competition Amongst Industries and High Input Prices; Growing Shift Toward Vegan-Based Diet.
8. Can you provide examples of recent developments in the market?
December 2022: Adisseo group had agreed to acquire Nor-Feed and its subsidiaries to develop and register botanical additives for use in animal feed.June 2022: Delacon and Cargill collaborated to establish a global plant-based phytogenic feed additives business for enhanced animal nutrition. The partnership has helped in extensive feed additives expertise as well as an increase in the global presence.April 2022: A strategic partnership has been made between Elanco and Royal DSM for Bovaer, an innovative, methane-reducing feed additive for cattle.
9. What pricing options are available for accessing the report?
Pricing options include single-user, multi-user, and enterprise licenses priced at USD 3800, USD 4500, and USD 5800 respectively.
10. Is the market size provided in terms of value or volume?
The market size is provided in terms of value, measured in Million.
11. Are there any specific market keywords associated with the report?
Yes, the market keyword associated with the report is "USA Feed Additives Industry," which aids in identifying and referencing the specific market segment covered.
12. How do I determine which pricing option suits my needs best?
The pricing options vary based on user requirements and access needs. Individual users may opt for single-user licenses, while businesses requiring broader access may choose multi-user or enterprise licenses for cost-effective access to the report.
13. Are there any additional resources or data provided in the USA Feed Additives Industry report?
While the report offers comprehensive insights, it's advisable to review the specific contents or supplementary materials provided to ascertain if additional resources or data are available.
14. How can I stay updated on further developments or reports in the USA Feed Additives Industry?
To stay informed about further developments, trends, and reports in the USA Feed Additives Industry, consider subscribing to industry newsletters, following relevant companies and organizations, or regularly checking reputable industry news sources and publications.
Methodology
Step 1 - Identification of Relevant Samples Size from Population Database


Step 2 - Approaches for Defining Global Market Size (Value, Volume* & Price*)

Note*: In applicable scenarios
Step 3 - Data Sources
Primary Research
- Web Analytics
- Survey Reports
- Research Institute
- Latest Research Reports
- Opinion Leaders
Secondary Research
- Annual Reports
- White Paper
- Latest Press Release
- Industry Association
- Paid Database
- Investor Presentations

Step 4 - Data Triangulation
Involves using different sources of information in order to increase the validity of a study
These sources are likely to be stakeholders in a program - participants, other researchers, program staff, other community members, and so on.
Then we put all data in single framework & apply various statistical tools to find out the dynamic on the market.
During the analysis stage, feedback from the stakeholder groups would be compared to determine areas of agreement as well as areas of divergence


