USA Blueberry Market Innovations Shaping Market Growth 2025-2033

USA Blueberry Market by Production Analysis, by Consumption Analysis, by Import Market Analysis (Value & Volume), by Export Market Analysis (Value & Volume), by Price Trend Analysis, by North America (United States, Canada, Mexico), by South America (Brazil, Argentina, Rest of South America), by Europe (United Kingdom, Germany, France, Italy, Spain, Russia, Benelux, Nordics, Rest of Europe), by Middle East & Africa (Turkey, Israel, GCC, North Africa, South Africa, Rest of Middle East & Africa), by Asia Pacific (China, India, Japan, South Korea, ASEAN, Oceania, Rest of Asia Pacific) Forecast 2025-2033

Jun 26 2025
Base Year: 2024

180 Pages
Main Logo

USA Blueberry Market Innovations Shaping Market Growth 2025-2033


Home
Industries
Agriculture
sponsor image

Tailored for you

  • In-depth Analysis Tailored to Specified Regions or Segments
  • Company Profiles Customized to User Preferences
  • Comprehensive Insights Focused on Specific Segments or Regions
  • Customized Evaluation of Competitive Landscape to Meet Your Needs
  • Tailored Customization to Address Other Specific Requirements
Ask for customization


Key Insights

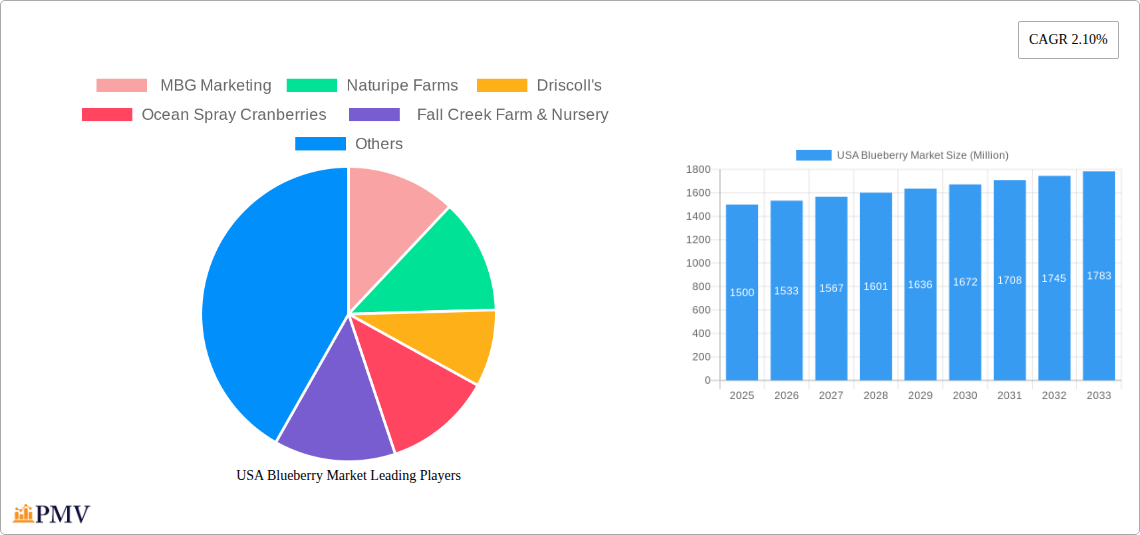
The US blueberry market, valued at approximately $1.5 billion in 2025, is projected to experience steady growth, driven primarily by increasing consumer demand for healthy and convenient snacks and the expanding applications of blueberries in the food and beverage, pharmaceutical, and cosmetic industries. The market's Compound Annual Growth Rate (CAGR) of 2.10% from 2025 to 2033 indicates a consistent, albeit moderate, expansion. This growth is fueled by rising health consciousness among consumers, leading to increased consumption of blueberries for their antioxidant properties and nutritional benefits. Furthermore, the innovation in blueberry-based products, such as functional foods and beverages, is contributing to market expansion. Frozen blueberries maintain a significant market share due to their extended shelf life and convenience, while fresh blueberries continue to be a popular choice for their superior taste and nutritional profile. The increasing adoption of blueberries in the pharmaceutical and cosmetic industries, leveraging their antioxidant and anti-inflammatory properties, presents a promising avenue for future growth.

However, the market faces certain challenges. Fluctuations in blueberry yields due to weather conditions and pest infestations can impact supply and price stability. Competition from other berries and fruits, as well as the cost of production and distribution, are potential restraints on market growth. The North American region, particularly the United States, holds the largest market share, driven by high consumption levels and established blueberry production infrastructure. Major players like Driscoll's, Naturipe Farms, and Ocean Spray Cranberries dominate the market, competing based on product quality, brand recognition, and distribution networks. Strategic partnerships and product diversification are key strategies employed by companies to enhance their market position. The increasing focus on sustainable farming practices and supply chain transparency is also shaping the market dynamics.

USA Blueberry Market Research Report - Market Size, Growth & Forecast

USA Blueberry Market: A Comprehensive Report (2019-2033)

This in-depth report provides a comprehensive analysis of the USA blueberry market, offering invaluable insights for businesses, investors, and stakeholders. Covering the period from 2019 to 2033, with a base year of 2025, this report meticulously examines market size, segmentation, competitive dynamics, and future growth potential. The report leverages extensive data analysis and expert insights to deliver actionable intelligence, crucial for navigating the complexities of this dynamic market. The total market value is projected to reach xx Million by 2033.

USA Blueberry Market Market Structure & Competitive Dynamics

The USA blueberry market exhibits a moderately concentrated structure, with key players such as Naturipe Farms, Driscoll's, Ocean Spray Cranberries, Fall Creek Farm & Nursery, and MBG Marketing holding significant market share. The competitive landscape is characterized by intense rivalry, driven by factors like product innovation, pricing strategies, and brand building. Market concentration is influenced by factors such as economies of scale, access to distribution networks, and brand recognition.

  • Market Share: Driscoll's and Naturipe Farms are estimated to hold the largest market share, collectively accounting for approximately xx% of the total market in 2024. Ocean Spray Cranberries holds a significant presence in the processed blueberry segment. MBG Marketing and Fall Creek Farm & Nursery operate with a more specialized focus.

  • M&A Activity: The market has witnessed a moderate level of M&A activity in recent years, primarily focused on consolidation among smaller players and expansion into new segments. Total M&A deal value in the last five years is estimated at xx Million.

  • Innovation Ecosystem: A robust innovation ecosystem is crucial for the growth of the US blueberry industry. This includes R&D investments in developing new varieties, improving cultivation techniques, and extending shelf life. Government support through research grants and subsidies plays a substantial role.

  • Regulatory Frameworks: Stringent food safety regulations and labeling requirements imposed by the FDA significantly influence the market. Organic and sustainable farming practices are gaining momentum, impacting the production and marketing of blueberries.

  • Product Substitutes: Other berries like raspberries, strawberries, and cranberries act as substitutes, influencing demand dynamics and creating competitive pressure.

USA Blueberry Market Industry Trends & Insights

The USA blueberry market is experiencing robust growth, driven by factors including increasing consumer demand for healthy and nutritious food, rising disposable incomes, and growing awareness of blueberries' health benefits. Technological advancements in cultivation techniques, such as precision agriculture and improved pest management, have also boosted production efficiency and quality. The market exhibits dynamic consumer preferences, leaning towards organic, sustainably sourced blueberries and innovative product formats.

  • CAGR: The market is projected to register a CAGR of xx% during the forecast period (2025-2033).

  • Market Penetration: The market penetration of frozen and dried blueberries is expected to increase significantly, driven by convenience and extended shelf life.

  • Consumer Preferences: Health-conscious consumers are driving demand for organic and sustainably produced blueberries. Convenience factors also play a significant role, with ready-to-eat options gaining popularity.

  • Competitive Dynamics: Intense competition among major players leads to continuous product innovation, aggressive marketing campaigns, and strategic partnerships to maintain market share.

USA Blueberry Market Growth

Dominant Markets & Segments in USA Blueberry Market

The fresh blueberry segment remains the largest and most dominant segment by product type, driven by strong consumer preference for fresh fruit. The Northwest region, particularly Washington State and Oregon, are leading blueberry-producing areas.

  • Key Drivers (Fresh Blueberries):
    • Favorable climatic conditions
    • Efficient irrigation systems
    • Government support for agricultural research
    • Well-established distribution networks

The food and beverage segment dominates the application space, utilizing blueberries extensively in jams, jellies, juices, and yogurt.

  • Key Drivers (Food & Beverage):

    • High demand for healthy and nutritious food products
    • Innovative product development
    • Growing demand for functional foods and beverages containing antioxidants
  • Dominance Analysis: The dominance of fresh blueberries in the product type segment and the food & beverage segment in the application segment is expected to continue during the forecast period, although the frozen and dried segments are expected to experience robust growth. This is due to advancements in freezing and drying technologies preserving the nutritional and organoleptic value of the blueberries.

USA Blueberry Market Product Innovations

Recent innovations in the USA blueberry market encompass the development of new high-yielding, disease-resistant varieties, improved packaging to enhance shelf life, and the exploration of new applications, particularly in functional foods and nutraceuticals. Technological advancements such as precision agriculture and automation are boosting overall productivity and efficiency. These innovations contribute to a better market fit by catering to diverse consumer demands and increasing product quality.

Report Segmentation & Scope

This report segments the USA blueberry market by product type (fresh, frozen, dried blueberries) and application (food and beverage, pharmaceuticals, cosmetics).

  • By Product Type: The fresh blueberry segment is anticipated to witness steady growth, while the frozen and dried segments are projected to exhibit higher growth rates driven by their convenience and extended shelf life.

  • By Application: The food and beverage segment is projected to remain the largest segment due to its extensive use in diverse food and beverage products. However, the pharmaceuticals and cosmetics segments are expected to show niche growth based on the health and beauty benefits of blueberries.

Key Drivers of USA Blueberry Market Growth

Key growth drivers include increasing consumer health awareness (demanding more nutritious foods), technological advancements in cultivation (higher yields & quality), favorable government policies promoting agriculture, and a rising disposable income in the target demographic. Additionally, the increasing use of blueberries in value-added products further stimulates market expansion.

Challenges in the USA Blueberry Market Sector

Significant challenges include susceptibility to weather conditions impacting yields and prices, labor shortages influencing production costs, and price volatility due to supply chain disruptions. Furthermore, intense competition from other berries, coupled with rising input costs like fertilizers and pesticides, can affect profitability.

Leading Players in the USA Blueberry Market Market

  • MBG Marketing
  • Naturipe Farms
  • Driscoll's
  • Ocean Spray Cranberries
  • Fall Creek Farm & Nursery

Key Developments in USA Blueberry Market Sector

  • June 2022: The USHBC forecast indicated a 10.4% increase in US blueberry production, reaching 328,940 metric tons, with 185,700 metric tons projected for fresh sales and 143,240 metric tons for processed products. This reflects a positive growth trajectory.

  • June 2021: The USHBC expanded its programming in India, promoting blueberries as a healthy snack and versatile ingredient. This strategic move signifies efforts to expand the global reach and demand for US blueberries.

Strategic USA Blueberry Market Market Outlook

The USA blueberry market holds significant growth potential, driven by evolving consumer preferences, increased health consciousness, and innovation in product development and processing. Strategic opportunities exist for companies focusing on sustainable farming practices, value-added product development, and expanding into new international markets. The increasing demand for functional foods and nutraceuticals will further fuel market expansion.

USA Blueberry Market Segmentation

  • 1. Production Analysis
  • 2. Consumption Analysis
  • 3. Import Market Analysis (Value & Volume)
  • 4. Export Market Analysis (Value & Volume)
  • 5. Price Trend Analysis

USA Blueberry Market Segmentation By Geography

  • 1. North America
    • 1.1. United States
    • 1.2. Canada
    • 1.3. Mexico
  • 2. South America
    • 2.1. Brazil
    • 2.2. Argentina
    • 2.3. Rest of South America
  • 3. Europe
    • 3.1. United Kingdom
    • 3.2. Germany
    • 3.3. France
    • 3.4. Italy
    • 3.5. Spain
    • 3.6. Russia
    • 3.7. Benelux
    • 3.8. Nordics
    • 3.9. Rest of Europe
  • 4. Middle East & Africa
    • 4.1. Turkey
    • 4.2. Israel
    • 4.3. GCC
    • 4.4. North Africa
    • 4.5. South Africa
    • 4.6. Rest of Middle East & Africa
  • 5. Asia Pacific
    • 5.1. China
    • 5.2. India
    • 5.3. Japan
    • 5.4. South Korea
    • 5.5. ASEAN
    • 5.6. Oceania
    • 5.7. Rest of Asia Pacific
USA Blueberry Market Regional Share


USA Blueberry Market REPORT HIGHLIGHTS

AspectsDetails
Study Period 2019-2033
Base Year 2024
Estimated Year 2025
Forecast Period2025-2033
Historical Period2019-2024
Growth RateCAGR of 2.10% from 2019-2033
Segmentation
    • By Production Analysis
    • By Consumption Analysis
    • By Import Market Analysis (Value & Volume)
    • By Export Market Analysis (Value & Volume)
    • By Price Trend Analysis
  • By Geography
    • North America
      • United States
      • Canada
      • Mexico
    • South America
      • Brazil
      • Argentina
      • Rest of South America
    • Europe
      • United Kingdom
      • Germany
      • France
      • Italy
      • Spain
      • Russia
      • Benelux
      • Nordics
      • Rest of Europe
    • Middle East & Africa
      • Turkey
      • Israel
      • GCC
      • North Africa
      • South Africa
      • Rest of Middle East & Africa
    • Asia Pacific
      • China
      • India
      • Japan
      • South Korea
      • ASEAN
      • Oceania
      • Rest of Asia Pacific


Table of Contents

  1. 1. Introduction
    • 1.1. Research Scope
    • 1.2. Market Segmentation
    • 1.3. Research Methodology
    • 1.4. Definitions and Assumptions
  2. 2. Executive Summary
    • 2.1. Introduction
  3. 3. Market Dynamics
    • 3.1. Introduction
      • 3.2. Market Drivers
        • 3.2.1. ; Awareness About Health Benefits Associated With Pecan Consumption; Wide Application of Pecan
      • 3.3. Market Restrains
        • 3.3.1. ; Volatility in the Prices; Adverse Weather Conditions Affecting Yield
      • 3.4. Market Trends
        • 3.4.1. Increasing Blueberry Production to create more Export Opportunities
  4. 4. Market Factor Analysis
    • 4.1. Porters Five Forces
    • 4.2. Supply/Value Chain
    • 4.3. PESTEL analysis
    • 4.4. Market Entropy
    • 4.5. Patent/Trademark Analysis
  5. 5. Global USA Blueberry Market Analysis, Insights and Forecast, 2019-2031
    • 5.1. Market Analysis, Insights and Forecast - by Production Analysis
      • 5.2. Market Analysis, Insights and Forecast - by Consumption Analysis
        • 5.3. Market Analysis, Insights and Forecast - by Import Market Analysis (Value & Volume)
          • 5.4. Market Analysis, Insights and Forecast - by Export Market Analysis (Value & Volume)
            • 5.5. Market Analysis, Insights and Forecast - by Price Trend Analysis
              • 5.6. Market Analysis, Insights and Forecast - by Region
                • 5.6.1. North America
                • 5.6.2. South America
                • 5.6.3. Europe
                • 5.6.4. Middle East & Africa
                • 5.6.5. Asia Pacific
            • 6. North America USA Blueberry Market Analysis, Insights and Forecast, 2019-2031
              • 6.1. Market Analysis, Insights and Forecast - by Production Analysis
                • 6.2. Market Analysis, Insights and Forecast - by Consumption Analysis
                  • 6.3. Market Analysis, Insights and Forecast - by Import Market Analysis (Value & Volume)
                    • 6.4. Market Analysis, Insights and Forecast - by Export Market Analysis (Value & Volume)
                      • 6.5. Market Analysis, Insights and Forecast - by Price Trend Analysis
                      • 7. South America USA Blueberry Market Analysis, Insights and Forecast, 2019-2031
                        • 7.1. Market Analysis, Insights and Forecast - by Production Analysis
                          • 7.2. Market Analysis, Insights and Forecast - by Consumption Analysis
                            • 7.3. Market Analysis, Insights and Forecast - by Import Market Analysis (Value & Volume)
                              • 7.4. Market Analysis, Insights and Forecast - by Export Market Analysis (Value & Volume)
                                • 7.5. Market Analysis, Insights and Forecast - by Price Trend Analysis
                                • 8. Europe USA Blueberry Market Analysis, Insights and Forecast, 2019-2031
                                  • 8.1. Market Analysis, Insights and Forecast - by Production Analysis
                                    • 8.2. Market Analysis, Insights and Forecast - by Consumption Analysis
                                      • 8.3. Market Analysis, Insights and Forecast - by Import Market Analysis (Value & Volume)
                                        • 8.4. Market Analysis, Insights and Forecast - by Export Market Analysis (Value & Volume)
                                          • 8.5. Market Analysis, Insights and Forecast - by Price Trend Analysis
                                          • 9. Middle East & Africa USA Blueberry Market Analysis, Insights and Forecast, 2019-2031
                                            • 9.1. Market Analysis, Insights and Forecast - by Production Analysis
                                              • 9.2. Market Analysis, Insights and Forecast - by Consumption Analysis
                                                • 9.3. Market Analysis, Insights and Forecast - by Import Market Analysis (Value & Volume)
                                                  • 9.4. Market Analysis, Insights and Forecast - by Export Market Analysis (Value & Volume)
                                                    • 9.5. Market Analysis, Insights and Forecast - by Price Trend Analysis
                                                    • 10. Asia Pacific USA Blueberry Market Analysis, Insights and Forecast, 2019-2031
                                                      • 10.1. Market Analysis, Insights and Forecast - by Production Analysis
                                                        • 10.2. Market Analysis, Insights and Forecast - by Consumption Analysis
                                                          • 10.3. Market Analysis, Insights and Forecast - by Import Market Analysis (Value & Volume)
                                                            • 10.4. Market Analysis, Insights and Forecast - by Export Market Analysis (Value & Volume)
                                                              • 10.5. Market Analysis, Insights and Forecast - by Price Trend Analysis
                                                              • 11. United States USA Blueberry Market Analysis, Insights and Forecast, 2019-2031
                                                                • 12. Canada USA Blueberry Market Analysis, Insights and Forecast, 2019-2031
                                                                  • 13. Mexico USA Blueberry Market Analysis, Insights and Forecast, 2019-2031
                                                                    • 14. Competitive Analysis
                                                                      • 14.1. Global Market Share Analysis 2024
                                                                        • 14.2. Company Profiles
                                                                          • 14.2.1 MBG Marketing
                                                                            • 14.2.1.1. Overview
                                                                            • 14.2.1.2. Products
                                                                            • 14.2.1.3. SWOT Analysis
                                                                            • 14.2.1.4. Recent Developments
                                                                            • 14.2.1.5. Financials (Based on Availability)
                                                                          • 14.2.2 Naturipe Farms
                                                                            • 14.2.2.1. Overview
                                                                            • 14.2.2.2. Products
                                                                            • 14.2.2.3. SWOT Analysis
                                                                            • 14.2.2.4. Recent Developments
                                                                            • 14.2.2.5. Financials (Based on Availability)
                                                                          • 14.2.3 Driscoll's
                                                                            • 14.2.3.1. Overview
                                                                            • 14.2.3.2. Products
                                                                            • 14.2.3.3. SWOT Analysis
                                                                            • 14.2.3.4. Recent Developments
                                                                            • 14.2.3.5. Financials (Based on Availability)
                                                                          • 14.2.4 Ocean Spray Cranberries
                                                                            • 14.2.4.1. Overview
                                                                            • 14.2.4.2. Products
                                                                            • 14.2.4.3. SWOT Analysis
                                                                            • 14.2.4.4. Recent Developments
                                                                            • 14.2.4.5. Financials (Based on Availability)
                                                                          • 14.2.5 Fall Creek Farm & Nursery
                                                                            • 14.2.5.1. Overview
                                                                            • 14.2.5.2. Products
                                                                            • 14.2.5.3. SWOT Analysis
                                                                            • 14.2.5.4. Recent Developments
                                                                            • 14.2.5.5. Financials (Based on Availability)

                                                                    List of Figures

                                                                    1. Figure 1: Global USA Blueberry Market Revenue Breakdown (Million, %) by Region 2024 & 2032
                                                                    2. Figure 2: Global USA Blueberry Market Volume Breakdown (Kiloton, %) by Region 2024 & 2032
                                                                    3. Figure 3: North America USA Blueberry Market Revenue (Million), by Country 2024 & 2032
                                                                    4. Figure 4: North America USA Blueberry Market Volume (Kiloton), by Country 2024 & 2032
                                                                    5. Figure 5: North America USA Blueberry Market Revenue Share (%), by Country 2024 & 2032
                                                                    6. Figure 6: North America USA Blueberry Market Volume Share (%), by Country 2024 & 2032
                                                                    7. Figure 7: North America USA Blueberry Market Revenue (Million), by Production Analysis 2024 & 2032
                                                                    8. Figure 8: North America USA Blueberry Market Volume (Kiloton), by Production Analysis 2024 & 2032
                                                                    9. Figure 9: North America USA Blueberry Market Revenue Share (%), by Production Analysis 2024 & 2032
                                                                    10. Figure 10: North America USA Blueberry Market Volume Share (%), by Production Analysis 2024 & 2032
                                                                    11. Figure 11: North America USA Blueberry Market Revenue (Million), by Consumption Analysis 2024 & 2032
                                                                    12. Figure 12: North America USA Blueberry Market Volume (Kiloton), by Consumption Analysis 2024 & 2032
                                                                    13. Figure 13: North America USA Blueberry Market Revenue Share (%), by Consumption Analysis 2024 & 2032
                                                                    14. Figure 14: North America USA Blueberry Market Volume Share (%), by Consumption Analysis 2024 & 2032
                                                                    15. Figure 15: North America USA Blueberry Market Revenue (Million), by Import Market Analysis (Value & Volume) 2024 & 2032
                                                                    16. Figure 16: North America USA Blueberry Market Volume (Kiloton), by Import Market Analysis (Value & Volume) 2024 & 2032
                                                                    17. Figure 17: North America USA Blueberry Market Revenue Share (%), by Import Market Analysis (Value & Volume) 2024 & 2032
                                                                    18. Figure 18: North America USA Blueberry Market Volume Share (%), by Import Market Analysis (Value & Volume) 2024 & 2032
                                                                    19. Figure 19: North America USA Blueberry Market Revenue (Million), by Export Market Analysis (Value & Volume) 2024 & 2032
                                                                    20. Figure 20: North America USA Blueberry Market Volume (Kiloton), by Export Market Analysis (Value & Volume) 2024 & 2032
                                                                    21. Figure 21: North America USA Blueberry Market Revenue Share (%), by Export Market Analysis (Value & Volume) 2024 & 2032
                                                                    22. Figure 22: North America USA Blueberry Market Volume Share (%), by Export Market Analysis (Value & Volume) 2024 & 2032
                                                                    23. Figure 23: North America USA Blueberry Market Revenue (Million), by Price Trend Analysis 2024 & 2032
                                                                    24. Figure 24: North America USA Blueberry Market Volume (Kiloton), by Price Trend Analysis 2024 & 2032
                                                                    25. Figure 25: North America USA Blueberry Market Revenue Share (%), by Price Trend Analysis 2024 & 2032
                                                                    26. Figure 26: North America USA Blueberry Market Volume Share (%), by Price Trend Analysis 2024 & 2032
                                                                    27. Figure 27: North America USA Blueberry Market Revenue (Million), by Country 2024 & 2032
                                                                    28. Figure 28: North America USA Blueberry Market Volume (Kiloton), by Country 2024 & 2032
                                                                    29. Figure 29: North America USA Blueberry Market Revenue Share (%), by Country 2024 & 2032
                                                                    30. Figure 30: North America USA Blueberry Market Volume Share (%), by Country 2024 & 2032
                                                                    31. Figure 31: South America USA Blueberry Market Revenue (Million), by Production Analysis 2024 & 2032
                                                                    32. Figure 32: South America USA Blueberry Market Volume (Kiloton), by Production Analysis 2024 & 2032
                                                                    33. Figure 33: South America USA Blueberry Market Revenue Share (%), by Production Analysis 2024 & 2032
                                                                    34. Figure 34: South America USA Blueberry Market Volume Share (%), by Production Analysis 2024 & 2032
                                                                    35. Figure 35: South America USA Blueberry Market Revenue (Million), by Consumption Analysis 2024 & 2032
                                                                    36. Figure 36: South America USA Blueberry Market Volume (Kiloton), by Consumption Analysis 2024 & 2032
                                                                    37. Figure 37: South America USA Blueberry Market Revenue Share (%), by Consumption Analysis 2024 & 2032
                                                                    38. Figure 38: South America USA Blueberry Market Volume Share (%), by Consumption Analysis 2024 & 2032
                                                                    39. Figure 39: South America USA Blueberry Market Revenue (Million), by Import Market Analysis (Value & Volume) 2024 & 2032
                                                                    40. Figure 40: South America USA Blueberry Market Volume (Kiloton), by Import Market Analysis (Value & Volume) 2024 & 2032
                                                                    41. Figure 41: South America USA Blueberry Market Revenue Share (%), by Import Market Analysis (Value & Volume) 2024 & 2032
                                                                    42. Figure 42: South America USA Blueberry Market Volume Share (%), by Import Market Analysis (Value & Volume) 2024 & 2032
                                                                    43. Figure 43: South America USA Blueberry Market Revenue (Million), by Export Market Analysis (Value & Volume) 2024 & 2032
                                                                    44. Figure 44: South America USA Blueberry Market Volume (Kiloton), by Export Market Analysis (Value & Volume) 2024 & 2032
                                                                    45. Figure 45: South America USA Blueberry Market Revenue Share (%), by Export Market Analysis (Value & Volume) 2024 & 2032
                                                                    46. Figure 46: South America USA Blueberry Market Volume Share (%), by Export Market Analysis (Value & Volume) 2024 & 2032
                                                                    47. Figure 47: South America USA Blueberry Market Revenue (Million), by Price Trend Analysis 2024 & 2032
                                                                    48. Figure 48: South America USA Blueberry Market Volume (Kiloton), by Price Trend Analysis 2024 & 2032
                                                                    49. Figure 49: South America USA Blueberry Market Revenue Share (%), by Price Trend Analysis 2024 & 2032
                                                                    50. Figure 50: South America USA Blueberry Market Volume Share (%), by Price Trend Analysis 2024 & 2032
                                                                    51. Figure 51: South America USA Blueberry Market Revenue (Million), by Country 2024 & 2032
                                                                    52. Figure 52: South America USA Blueberry Market Volume (Kiloton), by Country 2024 & 2032
                                                                    53. Figure 53: South America USA Blueberry Market Revenue Share (%), by Country 2024 & 2032
                                                                    54. Figure 54: South America USA Blueberry Market Volume Share (%), by Country 2024 & 2032
                                                                    55. Figure 55: Europe USA Blueberry Market Revenue (Million), by Production Analysis 2024 & 2032
                                                                    56. Figure 56: Europe USA Blueberry Market Volume (Kiloton), by Production Analysis 2024 & 2032
                                                                    57. Figure 57: Europe USA Blueberry Market Revenue Share (%), by Production Analysis 2024 & 2032
                                                                    58. Figure 58: Europe USA Blueberry Market Volume Share (%), by Production Analysis 2024 & 2032
                                                                    59. Figure 59: Europe USA Blueberry Market Revenue (Million), by Consumption Analysis 2024 & 2032
                                                                    60. Figure 60: Europe USA Blueberry Market Volume (Kiloton), by Consumption Analysis 2024 & 2032
                                                                    61. Figure 61: Europe USA Blueberry Market Revenue Share (%), by Consumption Analysis 2024 & 2032
                                                                    62. Figure 62: Europe USA Blueberry Market Volume Share (%), by Consumption Analysis 2024 & 2032
                                                                    63. Figure 63: Europe USA Blueberry Market Revenue (Million), by Import Market Analysis (Value & Volume) 2024 & 2032
                                                                    64. Figure 64: Europe USA Blueberry Market Volume (Kiloton), by Import Market Analysis (Value & Volume) 2024 & 2032
                                                                    65. Figure 65: Europe USA Blueberry Market Revenue Share (%), by Import Market Analysis (Value & Volume) 2024 & 2032
                                                                    66. Figure 66: Europe USA Blueberry Market Volume Share (%), by Import Market Analysis (Value & Volume) 2024 & 2032
                                                                    67. Figure 67: Europe USA Blueberry Market Revenue (Million), by Export Market Analysis (Value & Volume) 2024 & 2032
                                                                    68. Figure 68: Europe USA Blueberry Market Volume (Kiloton), by Export Market Analysis (Value & Volume) 2024 & 2032
                                                                    69. Figure 69: Europe USA Blueberry Market Revenue Share (%), by Export Market Analysis (Value & Volume) 2024 & 2032
                                                                    70. Figure 70: Europe USA Blueberry Market Volume Share (%), by Export Market Analysis (Value & Volume) 2024 & 2032
                                                                    71. Figure 71: Europe USA Blueberry Market Revenue (Million), by Price Trend Analysis 2024 & 2032
                                                                    72. Figure 72: Europe USA Blueberry Market Volume (Kiloton), by Price Trend Analysis 2024 & 2032
                                                                    73. Figure 73: Europe USA Blueberry Market Revenue Share (%), by Price Trend Analysis 2024 & 2032
                                                                    74. Figure 74: Europe USA Blueberry Market Volume Share (%), by Price Trend Analysis 2024 & 2032
                                                                    75. Figure 75: Europe USA Blueberry Market Revenue (Million), by Country 2024 & 2032
                                                                    76. Figure 76: Europe USA Blueberry Market Volume (Kiloton), by Country 2024 & 2032
                                                                    77. Figure 77: Europe USA Blueberry Market Revenue Share (%), by Country 2024 & 2032
                                                                    78. Figure 78: Europe USA Blueberry Market Volume Share (%), by Country 2024 & 2032
                                                                    79. Figure 79: Middle East & Africa USA Blueberry Market Revenue (Million), by Production Analysis 2024 & 2032
                                                                    80. Figure 80: Middle East & Africa USA Blueberry Market Volume (Kiloton), by Production Analysis 2024 & 2032
                                                                    81. Figure 81: Middle East & Africa USA Blueberry Market Revenue Share (%), by Production Analysis 2024 & 2032
                                                                    82. Figure 82: Middle East & Africa USA Blueberry Market Volume Share (%), by Production Analysis 2024 & 2032
                                                                    83. Figure 83: Middle East & Africa USA Blueberry Market Revenue (Million), by Consumption Analysis 2024 & 2032
                                                                    84. Figure 84: Middle East & Africa USA Blueberry Market Volume (Kiloton), by Consumption Analysis 2024 & 2032
                                                                    85. Figure 85: Middle East & Africa USA Blueberry Market Revenue Share (%), by Consumption Analysis 2024 & 2032
                                                                    86. Figure 86: Middle East & Africa USA Blueberry Market Volume Share (%), by Consumption Analysis 2024 & 2032
                                                                    87. Figure 87: Middle East & Africa USA Blueberry Market Revenue (Million), by Import Market Analysis (Value & Volume) 2024 & 2032
                                                                    88. Figure 88: Middle East & Africa USA Blueberry Market Volume (Kiloton), by Import Market Analysis (Value & Volume) 2024 & 2032
                                                                    89. Figure 89: Middle East & Africa USA Blueberry Market Revenue Share (%), by Import Market Analysis (Value & Volume) 2024 & 2032
                                                                    90. Figure 90: Middle East & Africa USA Blueberry Market Volume Share (%), by Import Market Analysis (Value & Volume) 2024 & 2032
                                                                    91. Figure 91: Middle East & Africa USA Blueberry Market Revenue (Million), by Export Market Analysis (Value & Volume) 2024 & 2032
                                                                    92. Figure 92: Middle East & Africa USA Blueberry Market Volume (Kiloton), by Export Market Analysis (Value & Volume) 2024 & 2032
                                                                    93. Figure 93: Middle East & Africa USA Blueberry Market Revenue Share (%), by Export Market Analysis (Value & Volume) 2024 & 2032
                                                                    94. Figure 94: Middle East & Africa USA Blueberry Market Volume Share (%), by Export Market Analysis (Value & Volume) 2024 & 2032
                                                                    95. Figure 95: Middle East & Africa USA Blueberry Market Revenue (Million), by Price Trend Analysis 2024 & 2032
                                                                    96. Figure 96: Middle East & Africa USA Blueberry Market Volume (Kiloton), by Price Trend Analysis 2024 & 2032
                                                                    97. Figure 97: Middle East & Africa USA Blueberry Market Revenue Share (%), by Price Trend Analysis 2024 & 2032
                                                                    98. Figure 98: Middle East & Africa USA Blueberry Market Volume Share (%), by Price Trend Analysis 2024 & 2032
                                                                    99. Figure 99: Middle East & Africa USA Blueberry Market Revenue (Million), by Country 2024 & 2032
                                                                    100. Figure 100: Middle East & Africa USA Blueberry Market Volume (Kiloton), by Country 2024 & 2032
                                                                    101. Figure 101: Middle East & Africa USA Blueberry Market Revenue Share (%), by Country 2024 & 2032
                                                                    102. Figure 102: Middle East & Africa USA Blueberry Market Volume Share (%), by Country 2024 & 2032
                                                                    103. Figure 103: Asia Pacific USA Blueberry Market Revenue (Million), by Production Analysis 2024 & 2032
                                                                    104. Figure 104: Asia Pacific USA Blueberry Market Volume (Kiloton), by Production Analysis 2024 & 2032
                                                                    105. Figure 105: Asia Pacific USA Blueberry Market Revenue Share (%), by Production Analysis 2024 & 2032
                                                                    106. Figure 106: Asia Pacific USA Blueberry Market Volume Share (%), by Production Analysis 2024 & 2032
                                                                    107. Figure 107: Asia Pacific USA Blueberry Market Revenue (Million), by Consumption Analysis 2024 & 2032
                                                                    108. Figure 108: Asia Pacific USA Blueberry Market Volume (Kiloton), by Consumption Analysis 2024 & 2032
                                                                    109. Figure 109: Asia Pacific USA Blueberry Market Revenue Share (%), by Consumption Analysis 2024 & 2032
                                                                    110. Figure 110: Asia Pacific USA Blueberry Market Volume Share (%), by Consumption Analysis 2024 & 2032
                                                                    111. Figure 111: Asia Pacific USA Blueberry Market Revenue (Million), by Import Market Analysis (Value & Volume) 2024 & 2032
                                                                    112. Figure 112: Asia Pacific USA Blueberry Market Volume (Kiloton), by Import Market Analysis (Value & Volume) 2024 & 2032
                                                                    113. Figure 113: Asia Pacific USA Blueberry Market Revenue Share (%), by Import Market Analysis (Value & Volume) 2024 & 2032
                                                                    114. Figure 114: Asia Pacific USA Blueberry Market Volume Share (%), by Import Market Analysis (Value & Volume) 2024 & 2032
                                                                    115. Figure 115: Asia Pacific USA Blueberry Market Revenue (Million), by Export Market Analysis (Value & Volume) 2024 & 2032
                                                                    116. Figure 116: Asia Pacific USA Blueberry Market Volume (Kiloton), by Export Market Analysis (Value & Volume) 2024 & 2032
                                                                    117. Figure 117: Asia Pacific USA Blueberry Market Revenue Share (%), by Export Market Analysis (Value & Volume) 2024 & 2032
                                                                    118. Figure 118: Asia Pacific USA Blueberry Market Volume Share (%), by Export Market Analysis (Value & Volume) 2024 & 2032
                                                                    119. Figure 119: Asia Pacific USA Blueberry Market Revenue (Million), by Price Trend Analysis 2024 & 2032
                                                                    120. Figure 120: Asia Pacific USA Blueberry Market Volume (Kiloton), by Price Trend Analysis 2024 & 2032
                                                                    121. Figure 121: Asia Pacific USA Blueberry Market Revenue Share (%), by Price Trend Analysis 2024 & 2032
                                                                    122. Figure 122: Asia Pacific USA Blueberry Market Volume Share (%), by Price Trend Analysis 2024 & 2032
                                                                    123. Figure 123: Asia Pacific USA Blueberry Market Revenue (Million), by Country 2024 & 2032
                                                                    124. Figure 124: Asia Pacific USA Blueberry Market Volume (Kiloton), by Country 2024 & 2032
                                                                    125. Figure 125: Asia Pacific USA Blueberry Market Revenue Share (%), by Country 2024 & 2032
                                                                    126. Figure 126: Asia Pacific USA Blueberry Market Volume Share (%), by Country 2024 & 2032

                                                                    List of Tables

                                                                    1. Table 1: Global USA Blueberry Market Revenue Million Forecast, by Region 2019 & 2032
                                                                    2. Table 2: Global USA Blueberry Market Volume Kiloton Forecast, by Region 2019 & 2032
                                                                    3. Table 3: Global USA Blueberry Market Revenue Million Forecast, by Production Analysis 2019 & 2032
                                                                    4. Table 4: Global USA Blueberry Market Volume Kiloton Forecast, by Production Analysis 2019 & 2032
                                                                    5. Table 5: Global USA Blueberry Market Revenue Million Forecast, by Consumption Analysis 2019 & 2032
                                                                    6. Table 6: Global USA Blueberry Market Volume Kiloton Forecast, by Consumption Analysis 2019 & 2032
                                                                    7. Table 7: Global USA Blueberry Market Revenue Million Forecast, by Import Market Analysis (Value & Volume) 2019 & 2032
                                                                    8. Table 8: Global USA Blueberry Market Volume Kiloton Forecast, by Import Market Analysis (Value & Volume) 2019 & 2032
                                                                    9. Table 9: Global USA Blueberry Market Revenue Million Forecast, by Export Market Analysis (Value & Volume) 2019 & 2032
                                                                    10. Table 10: Global USA Blueberry Market Volume Kiloton Forecast, by Export Market Analysis (Value & Volume) 2019 & 2032
                                                                    11. Table 11: Global USA Blueberry Market Revenue Million Forecast, by Price Trend Analysis 2019 & 2032
                                                                    12. Table 12: Global USA Blueberry Market Volume Kiloton Forecast, by Price Trend Analysis 2019 & 2032
                                                                    13. Table 13: Global USA Blueberry Market Revenue Million Forecast, by Region 2019 & 2032
                                                                    14. Table 14: Global USA Blueberry Market Volume Kiloton Forecast, by Region 2019 & 2032
                                                                    15. Table 15: Global USA Blueberry Market Revenue Million Forecast, by Country 2019 & 2032
                                                                    16. Table 16: Global USA Blueberry Market Volume Kiloton Forecast, by Country 2019 & 2032
                                                                    17. Table 17: United States USA Blueberry Market Revenue (Million) Forecast, by Application 2019 & 2032
                                                                    18. Table 18: United States USA Blueberry Market Volume (Kiloton) Forecast, by Application 2019 & 2032
                                                                    19. Table 19: Canada USA Blueberry Market Revenue (Million) Forecast, by Application 2019 & 2032
                                                                    20. Table 20: Canada USA Blueberry Market Volume (Kiloton) Forecast, by Application 2019 & 2032
                                                                    21. Table 21: Mexico USA Blueberry Market Revenue (Million) Forecast, by Application 2019 & 2032
                                                                    22. Table 22: Mexico USA Blueberry Market Volume (Kiloton) Forecast, by Application 2019 & 2032
                                                                    23. Table 23: Global USA Blueberry Market Revenue Million Forecast, by Production Analysis 2019 & 2032
                                                                    24. Table 24: Global USA Blueberry Market Volume Kiloton Forecast, by Production Analysis 2019 & 2032
                                                                    25. Table 25: Global USA Blueberry Market Revenue Million Forecast, by Consumption Analysis 2019 & 2032
                                                                    26. Table 26: Global USA Blueberry Market Volume Kiloton Forecast, by Consumption Analysis 2019 & 2032
                                                                    27. Table 27: Global USA Blueberry Market Revenue Million Forecast, by Import Market Analysis (Value & Volume) 2019 & 2032
                                                                    28. Table 28: Global USA Blueberry Market Volume Kiloton Forecast, by Import Market Analysis (Value & Volume) 2019 & 2032
                                                                    29. Table 29: Global USA Blueberry Market Revenue Million Forecast, by Export Market Analysis (Value & Volume) 2019 & 2032
                                                                    30. Table 30: Global USA Blueberry Market Volume Kiloton Forecast, by Export Market Analysis (Value & Volume) 2019 & 2032
                                                                    31. Table 31: Global USA Blueberry Market Revenue Million Forecast, by Price Trend Analysis 2019 & 2032
                                                                    32. Table 32: Global USA Blueberry Market Volume Kiloton Forecast, by Price Trend Analysis 2019 & 2032
                                                                    33. Table 33: Global USA Blueberry Market Revenue Million Forecast, by Country 2019 & 2032
                                                                    34. Table 34: Global USA Blueberry Market Volume Kiloton Forecast, by Country 2019 & 2032
                                                                    35. Table 35: United States USA Blueberry Market Revenue (Million) Forecast, by Application 2019 & 2032
                                                                    36. Table 36: United States USA Blueberry Market Volume (Kiloton) Forecast, by Application 2019 & 2032
                                                                    37. Table 37: Canada USA Blueberry Market Revenue (Million) Forecast, by Application 2019 & 2032
                                                                    38. Table 38: Canada USA Blueberry Market Volume (Kiloton) Forecast, by Application 2019 & 2032
                                                                    39. Table 39: Mexico USA Blueberry Market Revenue (Million) Forecast, by Application 2019 & 2032
                                                                    40. Table 40: Mexico USA Blueberry Market Volume (Kiloton) Forecast, by Application 2019 & 2032
                                                                    41. Table 41: Global USA Blueberry Market Revenue Million Forecast, by Production Analysis 2019 & 2032
                                                                    42. Table 42: Global USA Blueberry Market Volume Kiloton Forecast, by Production Analysis 2019 & 2032
                                                                    43. Table 43: Global USA Blueberry Market Revenue Million Forecast, by Consumption Analysis 2019 & 2032
                                                                    44. Table 44: Global USA Blueberry Market Volume Kiloton Forecast, by Consumption Analysis 2019 & 2032
                                                                    45. Table 45: Global USA Blueberry Market Revenue Million Forecast, by Import Market Analysis (Value & Volume) 2019 & 2032
                                                                    46. Table 46: Global USA Blueberry Market Volume Kiloton Forecast, by Import Market Analysis (Value & Volume) 2019 & 2032
                                                                    47. Table 47: Global USA Blueberry Market Revenue Million Forecast, by Export Market Analysis (Value & Volume) 2019 & 2032
                                                                    48. Table 48: Global USA Blueberry Market Volume Kiloton Forecast, by Export Market Analysis (Value & Volume) 2019 & 2032
                                                                    49. Table 49: Global USA Blueberry Market Revenue Million Forecast, by Price Trend Analysis 2019 & 2032
                                                                    50. Table 50: Global USA Blueberry Market Volume Kiloton Forecast, by Price Trend Analysis 2019 & 2032
                                                                    51. Table 51: Global USA Blueberry Market Revenue Million Forecast, by Country 2019 & 2032
                                                                    52. Table 52: Global USA Blueberry Market Volume Kiloton Forecast, by Country 2019 & 2032
                                                                    53. Table 53: Brazil USA Blueberry Market Revenue (Million) Forecast, by Application 2019 & 2032
                                                                    54. Table 54: Brazil USA Blueberry Market Volume (Kiloton) Forecast, by Application 2019 & 2032
                                                                    55. Table 55: Argentina USA Blueberry Market Revenue (Million) Forecast, by Application 2019 & 2032
                                                                    56. Table 56: Argentina USA Blueberry Market Volume (Kiloton) Forecast, by Application 2019 & 2032
                                                                    57. Table 57: Rest of South America USA Blueberry Market Revenue (Million) Forecast, by Application 2019 & 2032
                                                                    58. Table 58: Rest of South America USA Blueberry Market Volume (Kiloton) Forecast, by Application 2019 & 2032
                                                                    59. Table 59: Global USA Blueberry Market Revenue Million Forecast, by Production Analysis 2019 & 2032
                                                                    60. Table 60: Global USA Blueberry Market Volume Kiloton Forecast, by Production Analysis 2019 & 2032
                                                                    61. Table 61: Global USA Blueberry Market Revenue Million Forecast, by Consumption Analysis 2019 & 2032
                                                                    62. Table 62: Global USA Blueberry Market Volume Kiloton Forecast, by Consumption Analysis 2019 & 2032
                                                                    63. Table 63: Global USA Blueberry Market Revenue Million Forecast, by Import Market Analysis (Value & Volume) 2019 & 2032
                                                                    64. Table 64: Global USA Blueberry Market Volume Kiloton Forecast, by Import Market Analysis (Value & Volume) 2019 & 2032
                                                                    65. Table 65: Global USA Blueberry Market Revenue Million Forecast, by Export Market Analysis (Value & Volume) 2019 & 2032
                                                                    66. Table 66: Global USA Blueberry Market Volume Kiloton Forecast, by Export Market Analysis (Value & Volume) 2019 & 2032
                                                                    67. Table 67: Global USA Blueberry Market Revenue Million Forecast, by Price Trend Analysis 2019 & 2032
                                                                    68. Table 68: Global USA Blueberry Market Volume Kiloton Forecast, by Price Trend Analysis 2019 & 2032
                                                                    69. Table 69: Global USA Blueberry Market Revenue Million Forecast, by Country 2019 & 2032
                                                                    70. Table 70: Global USA Blueberry Market Volume Kiloton Forecast, by Country 2019 & 2032
                                                                    71. Table 71: United Kingdom USA Blueberry Market Revenue (Million) Forecast, by Application 2019 & 2032
                                                                    72. Table 72: United Kingdom USA Blueberry Market Volume (Kiloton) Forecast, by Application 2019 & 2032
                                                                    73. Table 73: Germany USA Blueberry Market Revenue (Million) Forecast, by Application 2019 & 2032
                                                                    74. Table 74: Germany USA Blueberry Market Volume (Kiloton) Forecast, by Application 2019 & 2032
                                                                    75. Table 75: France USA Blueberry Market Revenue (Million) Forecast, by Application 2019 & 2032
                                                                    76. Table 76: France USA Blueberry Market Volume (Kiloton) Forecast, by Application 2019 & 2032
                                                                    77. Table 77: Italy USA Blueberry Market Revenue (Million) Forecast, by Application 2019 & 2032
                                                                    78. Table 78: Italy USA Blueberry Market Volume (Kiloton) Forecast, by Application 2019 & 2032
                                                                    79. Table 79: Spain USA Blueberry Market Revenue (Million) Forecast, by Application 2019 & 2032
                                                                    80. Table 80: Spain USA Blueberry Market Volume (Kiloton) Forecast, by Application 2019 & 2032
                                                                    81. Table 81: Russia USA Blueberry Market Revenue (Million) Forecast, by Application 2019 & 2032
                                                                    82. Table 82: Russia USA Blueberry Market Volume (Kiloton) Forecast, by Application 2019 & 2032
                                                                    83. Table 83: Benelux USA Blueberry Market Revenue (Million) Forecast, by Application 2019 & 2032
                                                                    84. Table 84: Benelux USA Blueberry Market Volume (Kiloton) Forecast, by Application 2019 & 2032
                                                                    85. Table 85: Nordics USA Blueberry Market Revenue (Million) Forecast, by Application 2019 & 2032
                                                                    86. Table 86: Nordics USA Blueberry Market Volume (Kiloton) Forecast, by Application 2019 & 2032
                                                                    87. Table 87: Rest of Europe USA Blueberry Market Revenue (Million) Forecast, by Application 2019 & 2032
                                                                    88. Table 88: Rest of Europe USA Blueberry Market Volume (Kiloton) Forecast, by Application 2019 & 2032
                                                                    89. Table 89: Global USA Blueberry Market Revenue Million Forecast, by Production Analysis 2019 & 2032
                                                                    90. Table 90: Global USA Blueberry Market Volume Kiloton Forecast, by Production Analysis 2019 & 2032
                                                                    91. Table 91: Global USA Blueberry Market Revenue Million Forecast, by Consumption Analysis 2019 & 2032
                                                                    92. Table 92: Global USA Blueberry Market Volume Kiloton Forecast, by Consumption Analysis 2019 & 2032
                                                                    93. Table 93: Global USA Blueberry Market Revenue Million Forecast, by Import Market Analysis (Value & Volume) 2019 & 2032
                                                                    94. Table 94: Global USA Blueberry Market Volume Kiloton Forecast, by Import Market Analysis (Value & Volume) 2019 & 2032
                                                                    95. Table 95: Global USA Blueberry Market Revenue Million Forecast, by Export Market Analysis (Value & Volume) 2019 & 2032
                                                                    96. Table 96: Global USA Blueberry Market Volume Kiloton Forecast, by Export Market Analysis (Value & Volume) 2019 & 2032
                                                                    97. Table 97: Global USA Blueberry Market Revenue Million Forecast, by Price Trend Analysis 2019 & 2032
                                                                    98. Table 98: Global USA Blueberry Market Volume Kiloton Forecast, by Price Trend Analysis 2019 & 2032
                                                                    99. Table 99: Global USA Blueberry Market Revenue Million Forecast, by Country 2019 & 2032
                                                                    100. Table 100: Global USA Blueberry Market Volume Kiloton Forecast, by Country 2019 & 2032
                                                                    101. Table 101: Turkey USA Blueberry Market Revenue (Million) Forecast, by Application 2019 & 2032
                                                                    102. Table 102: Turkey USA Blueberry Market Volume (Kiloton) Forecast, by Application 2019 & 2032
                                                                    103. Table 103: Israel USA Blueberry Market Revenue (Million) Forecast, by Application 2019 & 2032
                                                                    104. Table 104: Israel USA Blueberry Market Volume (Kiloton) Forecast, by Application 2019 & 2032
                                                                    105. Table 105: GCC USA Blueberry Market Revenue (Million) Forecast, by Application 2019 & 2032
                                                                    106. Table 106: GCC USA Blueberry Market Volume (Kiloton) Forecast, by Application 2019 & 2032
                                                                    107. Table 107: North Africa USA Blueberry Market Revenue (Million) Forecast, by Application 2019 & 2032
                                                                    108. Table 108: North Africa USA Blueberry Market Volume (Kiloton) Forecast, by Application 2019 & 2032
                                                                    109. Table 109: South Africa USA Blueberry Market Revenue (Million) Forecast, by Application 2019 & 2032
                                                                    110. Table 110: South Africa USA Blueberry Market Volume (Kiloton) Forecast, by Application 2019 & 2032
                                                                    111. Table 111: Rest of Middle East & Africa USA Blueberry Market Revenue (Million) Forecast, by Application 2019 & 2032
                                                                    112. Table 112: Rest of Middle East & Africa USA Blueberry Market Volume (Kiloton) Forecast, by Application 2019 & 2032
                                                                    113. Table 113: Global USA Blueberry Market Revenue Million Forecast, by Production Analysis 2019 & 2032
                                                                    114. Table 114: Global USA Blueberry Market Volume Kiloton Forecast, by Production Analysis 2019 & 2032
                                                                    115. Table 115: Global USA Blueberry Market Revenue Million Forecast, by Consumption Analysis 2019 & 2032
                                                                    116. Table 116: Global USA Blueberry Market Volume Kiloton Forecast, by Consumption Analysis 2019 & 2032
                                                                    117. Table 117: Global USA Blueberry Market Revenue Million Forecast, by Import Market Analysis (Value & Volume) 2019 & 2032
                                                                    118. Table 118: Global USA Blueberry Market Volume Kiloton Forecast, by Import Market Analysis (Value & Volume) 2019 & 2032
                                                                    119. Table 119: Global USA Blueberry Market Revenue Million Forecast, by Export Market Analysis (Value & Volume) 2019 & 2032
                                                                    120. Table 120: Global USA Blueberry Market Volume Kiloton Forecast, by Export Market Analysis (Value & Volume) 2019 & 2032
                                                                    121. Table 121: Global USA Blueberry Market Revenue Million Forecast, by Price Trend Analysis 2019 & 2032
                                                                    122. Table 122: Global USA Blueberry Market Volume Kiloton Forecast, by Price Trend Analysis 2019 & 2032
                                                                    123. Table 123: Global USA Blueberry Market Revenue Million Forecast, by Country 2019 & 2032
                                                                    124. Table 124: Global USA Blueberry Market Volume Kiloton Forecast, by Country 2019 & 2032
                                                                    125. Table 125: China USA Blueberry Market Revenue (Million) Forecast, by Application 2019 & 2032
                                                                    126. Table 126: China USA Blueberry Market Volume (Kiloton) Forecast, by Application 2019 & 2032
                                                                    127. Table 127: India USA Blueberry Market Revenue (Million) Forecast, by Application 2019 & 2032
                                                                    128. Table 128: India USA Blueberry Market Volume (Kiloton) Forecast, by Application 2019 & 2032
                                                                    129. Table 129: Japan USA Blueberry Market Revenue (Million) Forecast, by Application 2019 & 2032
                                                                    130. Table 130: Japan USA Blueberry Market Volume (Kiloton) Forecast, by Application 2019 & 2032
                                                                    131. Table 131: South Korea USA Blueberry Market Revenue (Million) Forecast, by Application 2019 & 2032
                                                                    132. Table 132: South Korea USA Blueberry Market Volume (Kiloton) Forecast, by Application 2019 & 2032
                                                                    133. Table 133: ASEAN USA Blueberry Market Revenue (Million) Forecast, by Application 2019 & 2032
                                                                    134. Table 134: ASEAN USA Blueberry Market Volume (Kiloton) Forecast, by Application 2019 & 2032
                                                                    135. Table 135: Oceania USA Blueberry Market Revenue (Million) Forecast, by Application 2019 & 2032
                                                                    136. Table 136: Oceania USA Blueberry Market Volume (Kiloton) Forecast, by Application 2019 & 2032
                                                                    137. Table 137: Rest of Asia Pacific USA Blueberry Market Revenue (Million) Forecast, by Application 2019 & 2032
                                                                    138. Table 138: Rest of Asia Pacific USA Blueberry Market Volume (Kiloton) Forecast, by Application 2019 & 2032


                                                                    Frequently Asked Questions

                                                                    1. What is the projected Compound Annual Growth Rate (CAGR) of the USA Blueberry Market?

                                                                    The projected CAGR is approximately 2.10%.

                                                                    2. Which companies are prominent players in the USA Blueberry Market?

                                                                    Key companies in the market include MBG Marketing, Naturipe Farms , Driscoll's, Ocean Spray Cranberries , Fall Creek Farm & Nursery .

                                                                    3. What are the main segments of the USA Blueberry Market?

                                                                    The market segments include Production Analysis, Consumption Analysis, Import Market Analysis (Value & Volume), Export Market Analysis (Value & Volume), Price Trend Analysis.

                                                                    4. Can you provide details about the market size?

                                                                    The market size is estimated to be USD XXX Million as of 2022.

                                                                    5. What are some drivers contributing to market growth?

                                                                    ; Awareness About Health Benefits Associated With Pecan Consumption; Wide Application of Pecan.

                                                                    6. What are the notable trends driving market growth?

                                                                    Increasing Blueberry Production to create more Export Opportunities.

                                                                    7. Are there any restraints impacting market growth?

                                                                    ; Volatility in the Prices; Adverse Weather Conditions Affecting Yield.

                                                                    8. Can you provide examples of recent developments in the market?

                                                                    June 2022: According to the USHBC (US Highbush Blueberry Council) forecast, blueberry production in the United States is expected to reach 328,940 metric ton in 2022, an increase of 10.4% from the 297,830 metric ton produced in 2021. Of this volume, 185,700 metric ton are expected to be sold as fresh blueberries and 143,240 metric ton as processed products such as frozen and dried blueberries.

                                                                    9. What pricing options are available for accessing the report?

                                                                    Pricing options include single-user, multi-user, and enterprise licenses priced at USD 3800, USD 4500, and USD 5800 respectively.

                                                                    10. Is the market size provided in terms of value or volume?

                                                                    The market size is provided in terms of value, measured in Million and volume, measured in Kiloton.

                                                                    11. Are there any specific market keywords associated with the report?

                                                                    Yes, the market keyword associated with the report is "USA Blueberry Market," which aids in identifying and referencing the specific market segment covered.

                                                                    12. How do I determine which pricing option suits my needs best?

                                                                    The pricing options vary based on user requirements and access needs. Individual users may opt for single-user licenses, while businesses requiring broader access may choose multi-user or enterprise licenses for cost-effective access to the report.

                                                                    13. Are there any additional resources or data provided in the USA Blueberry Market report?

                                                                    While the report offers comprehensive insights, it's advisable to review the specific contents or supplementary materials provided to ascertain if additional resources or data are available.

                                                                    14. How can I stay updated on further developments or reports in the USA Blueberry Market?

                                                                    To stay informed about further developments, trends, and reports in the USA Blueberry Market, consider subscribing to industry newsletters, following relevant companies and organizations, or regularly checking reputable industry news sources and publications.


                                                                    Methodology

                                                                    Step 1 - Identification of Relevant Samples Size from Population Database

                                                                    Step Chart
                                                                    Bar Chart
                                                                    Method Chart

                                                                    Step 2 - Approaches for Defining Global Market Size (Value, Volume* & Price*)

                                                                    Approach Chart
                                                                    Top-down and bottom-up approaches are used to validate the global market size and estimate the market size for manufactures, regional segments, product, and application.

                                                                    Note*: In applicable scenarios

                                                                    Step 3 - Data Sources

                                                                    Primary Research

                                                                    • Web Analytics
                                                                    • Survey Reports
                                                                    • Research Institute
                                                                    • Latest Research Reports
                                                                    • Opinion Leaders

                                                                    Secondary Research

                                                                    • Annual Reports
                                                                    • White Paper
                                                                    • Latest Press Release
                                                                    • Industry Association
                                                                    • Paid Database
                                                                    • Investor Presentations
                                                                    Analyst Chart

                                                                    Step 4 - Data Triangulation

                                                                    Involves using different sources of information in order to increase the validity of a study

                                                                    These sources are likely to be stakeholders in a program - participants, other researchers, program staff, other community members, and so on.

                                                                    Then we put all data in single framework & apply various statistical tools to find out the dynamic on the market.

                                                                    During the analysis stage, feedback from the stakeholder groups would be compared to determine areas of agreement as well as areas of divergence

                                                                    Additionally, after gathering mixed and scattered data from a wide range of sources, data is triangulated and correlated to come up with estimated figures which are further validated through primary mediums or industry experts, opinion leaders.

                                                                    About Precision Market View

                                                                    Precision Market View offers precise market research, industry intelligence, and data analysis for healthcare, manufacturing, technology, and energy. Our reports provide the clarity you need to make informed decisions and drive growth.

                                                                    Our team combines primary research, advanced analytics, and industry expertise to deliver actionable intelligence. We offer syndicated reports, custom research, and consulting services tailored to your business needs.

                                                                    At Precision Market View, we are committed to quality, transparency, and client satisfaction. Every report is rigorously validated to ensure accuracy and relevance. Our global perspective and local expertise help you understand both the big picture and the finer details of your market.

                                                                    Stay informed with Precision Market View. Subscribe to our newsletter for the latest updates and research highlights, and follow us on social media for real-time insights.

                                                                    Precision Market View – Clarity for Your Strategic Decisions.

                                                                    artwork spiralartwork spiralRelated Reports
                                                                    artwork underline

                                                                    India Maize Seed Market Market Strategies for the Next Decade: 2025-2033

                                                                    Discover the booming Indian maize seed market! This comprehensive analysis reveals a CAGR of 10.20% (2025-2033), driven by hybrid seed adoption and rising demand. Explore key players, regional trends, and growth projections for this lucrative sector.

                                                                    July 2025
                                                                    Base Year: 2024
                                                                    No Of Pages: 197
                                                                    Price: $3800

                                                                    Future Forecasts for India Combine Harvester Market Industry Growth

                                                                    The India Combine Harvester Market is booming, projected to reach ₹[estimated 2033 value] million by 2033 with a 5.70% CAGR. Discover key trends, drivers, and restraints shaping this dynamic sector, including leading players like Kubota and Mahindra. Explore regional market analysis and growth forecasts for self-propelled, track, and tractor-powered harvesters.

                                                                    July 2025
                                                                    Base Year: 2024
                                                                    No Of Pages: 197
                                                                    Price: $3800

                                                                    Canada Crop Protection Chemicals Industry Unlocking Growth Potential: 2025-2033 Analysis and Forecasts

                                                                    Discover the growth trajectory of Canada's crop protection chemicals market (2025-2033). This in-depth analysis reveals market size, CAGR, key segments (insecticides, fungicides, herbicides), leading companies, and regional trends. Learn about market drivers, restraints, and future opportunities in the Canadian agricultural sector.

                                                                    July 2025
                                                                    Base Year: 2024
                                                                    No Of Pages: 150
                                                                    Price: $3800

                                                                    Turf & Ornamental Chemical Input Industry Market Report: Trends and Growth

                                                                    The Turf & Ornamental Chemical Input market is booming, projected to reach $9.875 billion by 2033 with a 4.34% CAGR. Discover key trends, leading companies (FMC, Bayer, Syngenta), and regional insights in this comprehensive market analysis. Explore the impact of pesticides, fertilizers, and growth regulators on landscaping and gardening.

                                                                    July 2025
                                                                    Base Year: 2024
                                                                    No Of Pages: 234
                                                                    Price: $4750

                                                                    Brazil Maize Market: Growth Opportunities and Competitive Landscape Overview 2025-2033

                                                                    Discover the booming Brazil maize market forecast (2025-2033)! This in-depth analysis reveals key trends, drivers, and challenges impacting hybrid maize, conventional maize, and applications across animal feed, human consumption, and biofuels. Learn about major players like Syngenta and Corteva and the projected market size and CAGR.

                                                                    July 2025
                                                                    Base Year: 2024
                                                                    No Of Pages: 180
                                                                    Price: $3800

                                                                    Opportunities in North America Crop Protection Chemicals Industry Market 2025-2033

                                                                    The North American crop protection chemicals market is booming, projected to reach [estimated 2033 market size in millions] by 2033 with a 4.34% CAGR. Discover key trends, driving forces, and major players shaping this dynamic industry, including insecticides, herbicides, fungicides, and more. Learn about regional variations and market segmentation across various crop types and application methods.

                                                                    July 2025
                                                                    Base Year: 2024
                                                                    No Of Pages: 180
                                                                    Price: $3800

                                                                    Apple Industry to Grow at XX CAGR: Market Size Analysis and Forecasts 2025-2033

                                                                    Discover the latest trends in the global apple industry. This in-depth market analysis reveals a steady growth trajectory, driven by consumer demand, diverse product applications, and expanding online retail. Learn about key players, regional insights, and future projections for the apple market from 2025-2033.

                                                                    July 2025
                                                                    Base Year: 2024
                                                                    No Of Pages: 234
                                                                    Price: $4750

                                                                    Digital Agriculture Market 2025-2033: Preparing for Growth and Change

                                                                    The booming digital agriculture market is projected to reach \$44.14 billion by 2033, fueled by precision farming, AI, and drone technology. Explore market trends, key players (AGCO, Microsoft, Deere), and regional growth in this comprehensive analysis.

                                                                    July 2025
                                                                    Base Year: 2024
                                                                    No Of Pages: 150
                                                                    Price: $4750

                                                                    North America Maize Industry Charting Growth Trajectories 2025-2033: Strategic Insights and Forecasts

                                                                    Discover the booming North American maize market! This comprehensive analysis reveals key trends, drivers, and restraints, including insights into hybrid seeds, field corn, sweet corn, popcorn, and major players like Bayer & Syngenta. Project your business strategy with our forecast to 2033.

                                                                    July 2025
                                                                    Base Year: 2024
                                                                    No Of Pages: 180
                                                                    Price: $3800

                                                                    North America Agricultural Tractors Machinery Market 2025-2033 Overview: Trends, Competitor Dynamics, and Opportunities

                                                                    Discover the booming North American agricultural tractors market! This comprehensive analysis reveals key trends, drivers, and restraints impacting the $16.39 billion industry through 2033, focusing on key players like Deere & Company and Mahindra & Mahindra. Explore market segmentation by HP and drive type, plus regional breakdowns.

                                                                    July 2025
                                                                    Base Year: 2024
                                                                    No Of Pages: 234
                                                                    Price: $4750

                                                                    APAC Biofertilizers Market Growth Opportunities: Market Size Forecast to 2033

                                                                    Discover the booming APAC biofertilizers market! This comprehensive analysis reveals a CAGR of 10.80%, driven by sustainable agriculture and growing demand for organic food. Explore market size projections, key segments (Rhizobium, Azospirillum, etc.), and leading companies shaping this dynamic industry.

                                                                    July 2025
                                                                    Base Year: 2024
                                                                    No Of Pages: 180
                                                                    Price: $4750

                                                                    Turkey Agricultural Tractor Market Dynamics and Forecasts: 2025-2033 Strategic Insights

                                                                    Discover the booming Turkish agricultural tractor market! This comprehensive analysis reveals a 6.10% CAGR, driven by government support and technological advancements. Explore market trends, segmentation by horsepower (50HP, 75HP, 100HP, 200HP+), key players, and growth projections to 2033. Invest wisely in this expanding sector!

                                                                    July 2025
                                                                    Base Year: 2024
                                                                    No Of Pages: 197
                                                                    Price: $3800

                                                                    North America Herbicide Market Insightful Analysis: Trends, Competitor Dynamics, and Opportunities 2025-2033

                                                                    Discover the surging North American herbicide market, projected to reach $XX million by 2033 with a 4.34% CAGR. This in-depth analysis explores key drivers, trends, restraints, and competitive landscapes, covering chemigation, foliar application, crop types, and leading companies like FMC and Bayer. Gain insights into regional market shares and future growth projections.

                                                                    July 2025
                                                                    Base Year: 2024
                                                                    No Of Pages: 180
                                                                    Price: $3800

                                                                    Vietnam Agro Machinery Market Insights: Growth at XX CAGR Through 2033

                                                                    Discover the booming Vietnam agro-machinery market, projected to reach [estimated value] by 2033 with a CAGR of 11.50%. This in-depth analysis explores market drivers, trends, restraints, key players (Yanmar, Kubota, VEAM), and segment insights (tractors, rice transplanters, harvesting machinery). Learn about investment opportunities and future growth potential.

                                                                    July 2025
                                                                    Base Year: 2024
                                                                    No Of Pages: 150
                                                                    Price: $3800

                                                                    Exploring Key Dynamics of Honey Industry Industry

                                                                    Discover the booming honey market! This comprehensive analysis reveals a $11.08B industry with a 5.20% CAGR, exploring key drivers, trends, regional insights (North America, Europe, Asia-Pacific), and leading brands like Dabur Honey and Patanjali Ayurved. Learn about raw honey, organic honey, Manuka honey, and more. Get your free market research now!

                                                                    July 2025
                                                                    Base Year: 2024
                                                                    No Of Pages: 234
                                                                    Price: $4750

                                                                    Emerging Market Insights in Cotton Trade Analysis Market: 2025-2033 Overview

                                                                    Discover the latest insights into the booming global cotton trade market. This comprehensive analysis reveals a $60B market (2025) projected to grow at a 4.5% CAGR through 2033, driven by textile industry growth and sustainable cotton demand. Explore key trends, restraints, and regional market shares.

                                                                    July 2025
                                                                    Base Year: 2024
                                                                    No Of Pages: 150
                                                                    Price: $4750

                                                                    Asia-pacific Tomato Seed Market Projected to Grow at XX CAGR: Insights and Forecasts 2025-2033

                                                                    The Asia-Pacific tomato seed market is booming, driven by rising demand and advancements in breeding technology. Discover key market trends, growth projections (2025-2033), major players, and regional insights in this comprehensive market analysis.

                                                                    July 2025
                                                                    Base Year: 2024
                                                                    No Of Pages: 180
                                                                    Price: $3800

                                                                    Uganda Agriculture Industry Market Strategies for the Next Decade: 2025-2033

                                                                    Discover the booming Ugandan agriculture industry! Explore market size ($4.07B in 2025), 4.20% CAGR growth projections to 2033, key players, and regional trends in cereals, oilseeds, fruits, and vegetables. Invest in Uganda's agricultural future.

                                                                    July 2025
                                                                    Base Year: 2024
                                                                    No Of Pages: 150
                                                                    Price: $3800

                                                                    Artichokes Industry: Harnessing Emerging Innovations for Growth 2025-2033

                                                                    Discover the booming artichoke market! Explore key trends, regional analysis, and leading companies driving growth in this $XX million industry projected to reach [estimated 2033 value] by 2033. Learn about the rising demand for fresh, canned, frozen, and marinated artichokes in the food service, household, and industrial sectors.

                                                                    July 2025
                                                                    Base Year: 2024
                                                                    No Of Pages: 197
                                                                    Price: $3800

                                                                    Agricultural Inoculants Market Growth Opportunities and Market Forecast 2025-2033: A Strategic Analysis

                                                                    Discover the booming agricultural inoculants market! Our comprehensive analysis reveals a CAGR of 10.50%, driven by sustainable farming trends and rising food demands. Explore market size, segmentation, key players (Bioceres, Novozymes, BASF), and regional insights for 2025-2033. Learn how bio-based solutions are revolutionizing agriculture.

                                                                    July 2025
                                                                    Base Year: 2024
                                                                    No Of Pages: 150
                                                                    Price: $4750
                                                                    • Home
                                                                    • About Us
                                                                    • Industries
                                                                      • Aerospace & Defense
                                                                      • Agriculture
                                                                      • Animal Nutrition & Wellness
                                                                      • Automotive
                                                                      • Chemicals & Materials
                                                                      • Consumer Goods and Services
                                                                      • Energy & Power
                                                                      • Financial Services and Investment Intelligence
                                                                      • Food & Beverage
                                                                      • Home and Property Improvement
                                                                      • Hospitality and Tourism
                                                                      • Logistics
                                                                      • Manufacturing Products and Services
                                                                      • Packaging
                                                                      • Professional and Commercial Services
                                                                      • Real Estate and Construction
                                                                      • Retail
                                                                      • Technology, Media and Telecom
                                                                      • Healthcare
                                                                    • Services
                                                                    • Contact
                                                                    Main Logo
                                                                    • Home
                                                                    • About Us
                                                                    • Industries
                                                                      • Aerospace & Defense
                                                                      • Agriculture
                                                                      • Animal Nutrition & Wellness
                                                                      • Automotive
                                                                      • Chemicals & Materials
                                                                      • Consumer Goods and Services
                                                                      • Energy & Power
                                                                      • Financial Services and Investment Intelligence
                                                                      • Food & Beverage
                                                                      • Home and Property Improvement
                                                                      • Hospitality and Tourism
                                                                      • Logistics
                                                                      • Manufacturing Products and Services
                                                                      • Packaging
                                                                      • Professional and Commercial Services
                                                                      • Real Estate and Construction
                                                                      • Retail
                                                                      • Technology, Media and Telecom
                                                                      • Healthcare
                                                                    • Services
                                                                    • Contact
                                                                    +17162654855
                                                                    [email protected]

                                                                    +17162654855

                                                                    [email protected]

                                                                    Business Address

                                                                    Head Office

                                                                    Office no. A 5010, fifth floor, Solitaire Business Hub, Near Phoenix mall, Pune, Maharashtra 411014

                                                                    Contact Information

                                                                    Craig Francis

                                                                    Business Development Head

                                                                    +17162654855

                                                                    [email protected]

                                                                    Connect With Us

                                                                    Secure Payment Partners

                                                                    payment image
                                                                    RetailLogisticsPackagingAutomotiveHealthcareAgricultureEnergy & PowerFood & BeverageAerospace & DefenseChemicals & MaterialsHospitality and TourismAnimal Nutrition & WellnessConsumer Goods and ServicesReal Estate and ConstructionHome and Property ImprovementTechnology, Media and TelecomManufacturing Products and ServicesFinancial Services and Investment Intelligence

                                                                    © 2025 All rights reserved


                                                                    Privacy Policy
                                                                    Terms and Conditions
                                                                    FAQ