US Bio fungicides Industry Market’s Technological Evolution: Trends and Analysis 2025-2033

US Bio fungicides Industry by Production Analysis, by Consumption Analysis, by Import Market Analysis (Value & Volume), by Export Market Analysis (Value & Volume), by Price Trend Analysis, by North America (United States, Canada, Mexico), by South America (Brazil, Argentina, Rest of South America), by Europe (United Kingdom, Germany, France, Italy, Spain, Russia, Benelux, Nordics, Rest of Europe), by Middle East & Africa (Turkey, Israel, GCC, North Africa, South Africa, Rest of Middle East & Africa), by Asia Pacific (China, India, Japan, South Korea, ASEAN, Oceania, Rest of Asia Pacific) Forecast 2025-2033

Jun 29 2025
Base Year: 2024

197 Pages
Main Logo

US Bio fungicides Industry Market’s Technological Evolution: Trends and Analysis 2025-2033


Home
Industries
Agriculture
sponsor image

Tailored for you

  • In-depth Analysis Tailored to Specified Regions or Segments
  • Company Profiles Customized to User Preferences
  • Comprehensive Insights Focused on Specific Segments or Regions
  • Customized Evaluation of Competitive Landscape to Meet Your Needs
  • Tailored Customization to Address Other Specific Requirements
Ask for customization


Key Insights

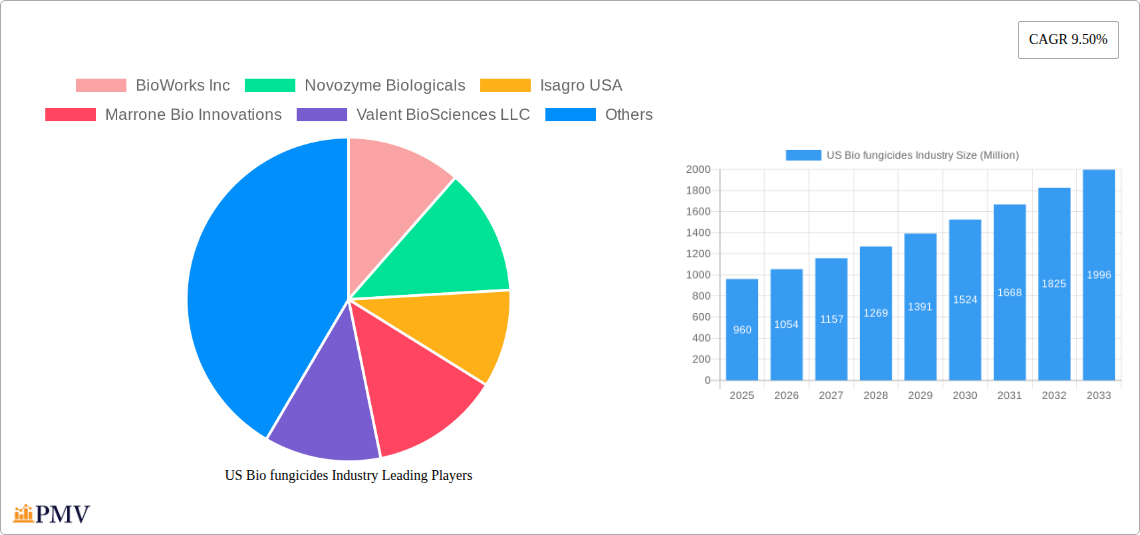
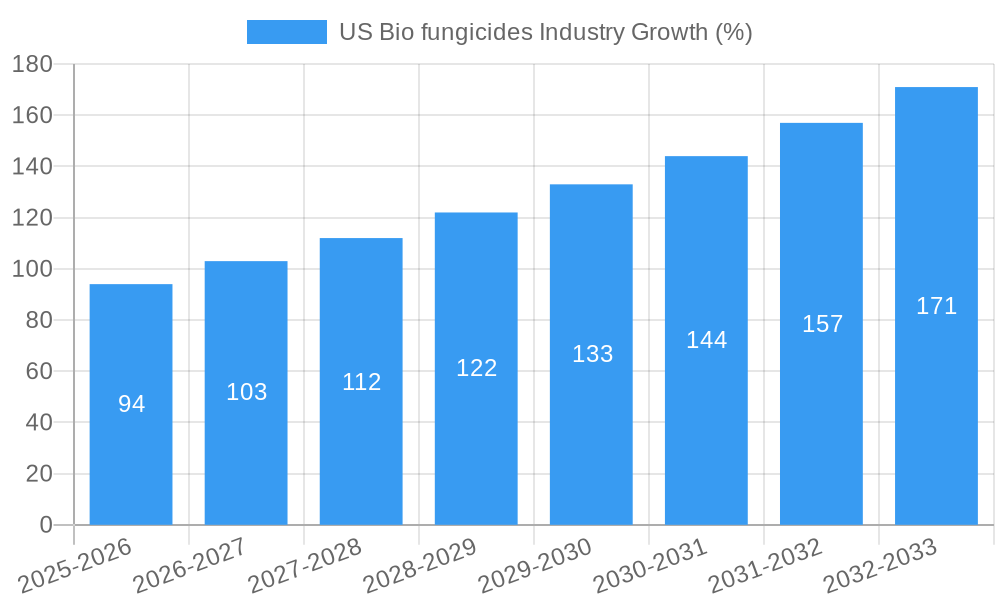
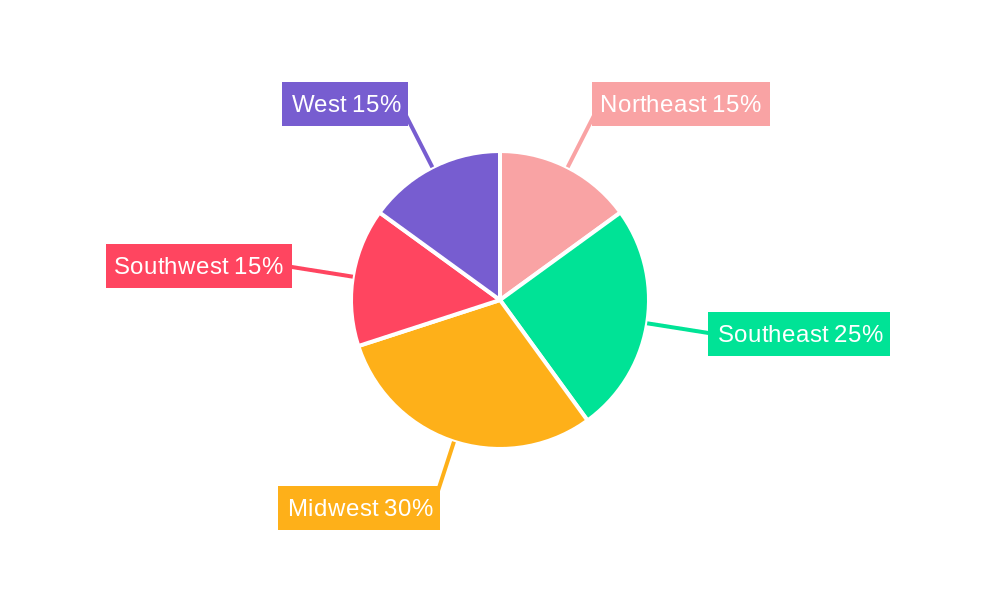
The US biofungicides market, valued at $960 million in 2025, is projected to experience robust growth, driven by increasing concerns over chemical fungicide resistance, stringent regulations on synthetic pesticides, and a rising consumer preference for organically produced food. The market's Compound Annual Growth Rate (CAGR) of 9.5% from 2025 to 2033 indicates a significant expansion, reaching an estimated value exceeding $2.3 billion by 2033. Key growth drivers include the expanding acreage dedicated to high-value crops like fruits and vegetables, necessitating effective disease management solutions. Furthermore, advancements in biofungicide formulations, including enhanced efficacy and broader applications, are fueling market expansion. The Grains and Cereals segment currently dominates the market, given its large acreage and susceptibility to fungal diseases, but the Fruits and Vegetables segment is anticipated to witness the fastest growth due to higher profit margins and consumer demand for organically grown produce. Geographic variations exist, with the Midwest and Southeast regions leading in biofungicide adoption, mirroring the concentration of major agricultural production. However, increasing awareness and regulatory support in other regions are expected to balance regional growth in the coming years.

Competition is intense, with established players like Syngenta AG and Valent BioSciences LLC competing with emerging biopesticide companies such as BioWorks Inc. and Marrone Bio Innovations. These companies are focusing on research and development to introduce novel biofungicide products with improved efficacy and broader crop applications. The market faces some restraints, including the higher cost of biofungicides compared to their chemical counterparts, along with inconsistent efficacy in certain environmental conditions. However, ongoing technological advancements are addressing these limitations, improving the cost-effectiveness and performance of biofungicides. This makes the US biofungicides market an attractive investment opportunity, particularly for companies focused on sustainable and environmentally friendly agricultural solutions.

US Bio fungicides Industry Research Report - Market Size, Growth & Forecast

US Biofungicides Industry Market Report: 2019-2033

This comprehensive report provides an in-depth analysis of the US biofungicides market, offering valuable insights for industry stakeholders, investors, and researchers. Covering the period 2019-2033, with a base year of 2025 and a forecast period of 2025-2033, this report delivers a granular understanding of market dynamics, competitive landscapes, and future growth potential. The US biofungicides market is projected to reach xx Million by 2033, exhibiting a CAGR of xx% during the forecast period.

US Biofungicides Industry Market Structure & Competitive Dynamics

The US biofungicides market exhibits a moderately concentrated structure, with key players holding significant market share. The market is characterized by a dynamic interplay of established chemical giants and emerging biopesticide companies. Innovation is driven by both internal R&D and strategic collaborations, with a focus on developing novel biofungicide formulations and application technologies. Regulatory frameworks, including the EPA's registration process, significantly influence market access and product development timelines. The presence of chemical fungicides acts as a substitute, posing competitive pressure on biofungicide adoption. However, growing consumer demand for sustainable and environmentally friendly agricultural practices is fueling the market's expansion. Mergers and acquisitions (M&A) activity is a significant aspect of the industry’s competitive dynamics, with larger players acquiring smaller companies to expand their product portfolios and market reach. Deal values for recent M&A activities in this sector have ranged from xx Million to xx Million.

  • Market Concentration: The top five players account for approximately xx% of the market share in 2025.
  • Innovation Ecosystem: Strong R&D investments and strategic partnerships are driving innovation.
  • Regulatory Landscape: EPA regulations influence market entry and product approvals.
  • M&A Activity: Recent M&A deals reflect industry consolidation and expansion strategies.

US Biofungicides Industry Industry Trends & Insights

The US biofungicides market is experiencing robust growth, primarily driven by the increasing demand for sustainable agriculture practices, stringent regulations on chemical pesticides, and rising consumer awareness of environmental concerns. Technological advancements in biopesticide formulation and application technologies are further accelerating market growth. The shift towards precision agriculture and integrated pest management (IPM) strategies is creating significant opportunities for biofungicides. Consumer preference for pesticide-free and organically produced food products is also driving the demand for biofungicides across various crop types. However, the relatively higher cost compared to conventional chemical fungicides and inconsistent efficacy in certain applications remain challenges. The market penetration of biofungicides is estimated at xx% in 2025, and it is projected to reach xx% by 2033.

US Bio fungicides Industry Growth

Dominant Markets & Segments in US Biofungicides Industry

The Fruits and Vegetables segment is currently the dominant market segment within the US biofungicides industry, driven by the high value of these crops and stringent regulations related to pesticide residues. This segment is expected to maintain its leading position throughout the forecast period. The Grains and Cereals segment also presents a significant market opportunity, with growing adoption of biofungicides driven by increasing concerns over fungicide resistance in traditional chemical products.

  • Fruits and Vegetables:
    • Key Drivers: High crop value, stringent regulations on pesticide residues, consumer preference for organic produce.
  • Grains and Cereals:
    • Key Drivers: Growing concerns about fungicide resistance, increasing demand for sustainable agriculture practices.
  • Oilseeds:
    • Key Drivers: Demand for high-quality oilseeds, increasing awareness of environmental impact of conventional fungicides.
  • Commercial Crops:
    • Key Drivers: Growing adoption of integrated pest management (IPM) strategies, demand for high yields.
  • Turf and Ornamentals:
    • Key Drivers: Increased consumer preference for environmentally friendly lawn and garden care products.

US Biofungicides Industry Product Innovations

Recent product innovations in the US biofungicides market focus on enhancing efficacy, improving shelf life, and developing targeted formulations for specific crop types and disease pathogens. Advances in formulation technologies are leading to the development of more effective and user-friendly products. The integration of biopesticides with other crop protection strategies, such as biofertilizers and biostimulants, is also gaining traction, offering synergistic benefits to farmers. These innovative products are gaining market acceptance due to their environmental benefits and improved compatibility with integrated pest management strategies.

Report Segmentation & Scope

This report segments the US biofungicides market by crop type: Grains and Cereals, Oilseeds, Commercial Crops, Fruits and Vegetables, and Turf and Ornamentals. Each segment is analyzed in terms of market size, growth projections, and competitive dynamics. The report provides detailed insights into the market drivers, challenges, and opportunities specific to each segment. Growth projections for each segment are detailed within the full report.

Key Drivers of US Biofungicides Industry Growth

The growth of the US biofungicides market is driven by several factors, including the increasing demand for sustainable and environmentally friendly agriculture, stringent government regulations on chemical pesticides, and growing consumer awareness of the health and environmental risks associated with synthetic fungicides. Further growth drivers include technological advancements in biopesticide development, the adoption of integrated pest management strategies, and the rising demand for organic and pesticide-free food products.

Challenges in the US Biofungicides Industry Sector

The US biofungicides industry faces several challenges, including the relatively higher cost of biofungicides compared to conventional chemical fungicides, inconsistent efficacy against certain diseases, and the longer time required for regulatory approvals. The complex regulatory landscape and potential supply chain disruptions further hinder market growth. These factors can affect the profitability of biofungicide producers and limit the adoption of these products by farmers. The inconsistent efficacy leads to a xx% reduction in adoption rates in certain segments.

Leading Players in the US Biofungicides Industry Market

  • BioWorks Inc
  • Novozyme Biologicals
  • Isagro USA
  • Marrone Bio Innovations
  • Valent BioSciences LLC
  • Syngenta AG
  • De Sangosse Lt
  • Certis USA LLC

Key Developments in US Biofungicides Industry Sector

  • January 2023: BioWorks Inc. launched a new biofungicide targeting late blight in tomatoes.
  • March 2022: Syngenta AG acquired a smaller biofungicide company, expanding its product portfolio.
  • June 2021: New EPA regulations impacted the registration process for several biofungicides. (Further details on specific developments and dates are included in the full report.)

Strategic US Biofungicides Industry Market Outlook

The US biofungicides market presents significant growth opportunities over the next decade. Continued innovation in product development, increasing consumer demand for sustainable agriculture, and supportive government policies will drive market expansion. Strategic partnerships and collaborations between companies will further enhance market growth, particularly in developing effective and affordable biofungicide solutions for a wider range of crops and diseases. The market is poised for robust growth, driven by factors such as increased awareness of environmental concerns and advancements in biopesticide technology.

US Bio fungicides Industry Segmentation

  • 1. Production Analysis
  • 2. Consumption Analysis
  • 3. Import Market Analysis (Value & Volume)
  • 4. Export Market Analysis (Value & Volume)
  • 5. Price Trend Analysis

US Bio fungicides Industry Segmentation By Geography

  • 1. North America
    • 1.1. United States
    • 1.2. Canada
    • 1.3. Mexico
  • 2. South America
    • 2.1. Brazil
    • 2.2. Argentina
    • 2.3. Rest of South America
  • 3. Europe
    • 3.1. United Kingdom
    • 3.2. Germany
    • 3.3. France
    • 3.4. Italy
    • 3.5. Spain
    • 3.6. Russia
    • 3.7. Benelux
    • 3.8. Nordics
    • 3.9. Rest of Europe
  • 4. Middle East & Africa
    • 4.1. Turkey
    • 4.2. Israel
    • 4.3. GCC
    • 4.4. North Africa
    • 4.5. South Africa
    • 4.6. Rest of Middle East & Africa
  • 5. Asia Pacific
    • 5.1. China
    • 5.2. India
    • 5.3. Japan
    • 5.4. South Korea
    • 5.5. ASEAN
    • 5.6. Oceania
    • 5.7. Rest of Asia Pacific
US Bio fungicides Industry Regional Share


US Bio fungicides Industry REPORT HIGHLIGHTS

AspectsDetails
Study Period 2019-2033
Base Year 2024
Estimated Year 2025
Forecast Period2025-2033
Historical Period2019-2024
Growth RateCAGR of 9.50% from 2019-2033
Segmentation
    • By Production Analysis
    • By Consumption Analysis
    • By Import Market Analysis (Value & Volume)
    • By Export Market Analysis (Value & Volume)
    • By Price Trend Analysis
  • By Geography
    • North America
      • United States
      • Canada
      • Mexico
    • South America
      • Brazil
      • Argentina
      • Rest of South America
    • Europe
      • United Kingdom
      • Germany
      • France
      • Italy
      • Spain
      • Russia
      • Benelux
      • Nordics
      • Rest of Europe
    • Middle East & Africa
      • Turkey
      • Israel
      • GCC
      • North Africa
      • South Africa
      • Rest of Middle East & Africa
    • Asia Pacific
      • China
      • India
      • Japan
      • South Korea
      • ASEAN
      • Oceania
      • Rest of Asia Pacific


Table of Contents

  1. 1. Introduction
    • 1.1. Research Scope
    • 1.2. Market Segmentation
    • 1.3. Research Methodology
    • 1.4. Definitions and Assumptions
  2. 2. Executive Summary
    • 2.1. Introduction
  3. 3. Market Dynamics
    • 3.1. Introduction
      • 3.2. Market Drivers
        • 3.2.1. Adoption of Organic and Eco-friendly Farming Practices; Declining Area of Arable Land and Rising Food Security Concerns
      • 3.3. Market Restrains
        • 3.3.1. High Demand for Conventional and Synthetic Products; Lack of Awareness and Other Factors Limiting the Adoption of Agricultural Inoculants
      • 3.4. Market Trends
        • 3.4.1. Fruits and Vegetables Fastest Market Growing Segment
  4. 4. Market Factor Analysis
    • 4.1. Porters Five Forces
    • 4.2. Supply/Value Chain
    • 4.3. PESTEL analysis
    • 4.4. Market Entropy
    • 4.5. Patent/Trademark Analysis
  5. 5. Global US Bio fungicides Industry Analysis, Insights and Forecast, 2019-2031
    • 5.1. Market Analysis, Insights and Forecast - by Production Analysis
      • 5.2. Market Analysis, Insights and Forecast - by Consumption Analysis
        • 5.3. Market Analysis, Insights and Forecast - by Import Market Analysis (Value & Volume)
          • 5.4. Market Analysis, Insights and Forecast - by Export Market Analysis (Value & Volume)
            • 5.5. Market Analysis, Insights and Forecast - by Price Trend Analysis
              • 5.6. Market Analysis, Insights and Forecast - by Region
                • 5.6.1. North America
                • 5.6.2. South America
                • 5.6.3. Europe
                • 5.6.4. Middle East & Africa
                • 5.6.5. Asia Pacific
            • 6. North America US Bio fungicides Industry Analysis, Insights and Forecast, 2019-2031
              • 6.1. Market Analysis, Insights and Forecast - by Production Analysis
                • 6.2. Market Analysis, Insights and Forecast - by Consumption Analysis
                  • 6.3. Market Analysis, Insights and Forecast - by Import Market Analysis (Value & Volume)
                    • 6.4. Market Analysis, Insights and Forecast - by Export Market Analysis (Value & Volume)
                      • 6.5. Market Analysis, Insights and Forecast - by Price Trend Analysis
                      • 7. South America US Bio fungicides Industry Analysis, Insights and Forecast, 2019-2031
                        • 7.1. Market Analysis, Insights and Forecast - by Production Analysis
                          • 7.2. Market Analysis, Insights and Forecast - by Consumption Analysis
                            • 7.3. Market Analysis, Insights and Forecast - by Import Market Analysis (Value & Volume)
                              • 7.4. Market Analysis, Insights and Forecast - by Export Market Analysis (Value & Volume)
                                • 7.5. Market Analysis, Insights and Forecast - by Price Trend Analysis
                                • 8. Europe US Bio fungicides Industry Analysis, Insights and Forecast, 2019-2031
                                  • 8.1. Market Analysis, Insights and Forecast - by Production Analysis
                                    • 8.2. Market Analysis, Insights and Forecast - by Consumption Analysis
                                      • 8.3. Market Analysis, Insights and Forecast - by Import Market Analysis (Value & Volume)
                                        • 8.4. Market Analysis, Insights and Forecast - by Export Market Analysis (Value & Volume)
                                          • 8.5. Market Analysis, Insights and Forecast - by Price Trend Analysis
                                          • 9. Middle East & Africa US Bio fungicides Industry Analysis, Insights and Forecast, 2019-2031
                                            • 9.1. Market Analysis, Insights and Forecast - by Production Analysis
                                              • 9.2. Market Analysis, Insights and Forecast - by Consumption Analysis
                                                • 9.3. Market Analysis, Insights and Forecast - by Import Market Analysis (Value & Volume)
                                                  • 9.4. Market Analysis, Insights and Forecast - by Export Market Analysis (Value & Volume)
                                                    • 9.5. Market Analysis, Insights and Forecast - by Price Trend Analysis
                                                    • 10. Asia Pacific US Bio fungicides Industry Analysis, Insights and Forecast, 2019-2031
                                                      • 10.1. Market Analysis, Insights and Forecast - by Production Analysis
                                                        • 10.2. Market Analysis, Insights and Forecast - by Consumption Analysis
                                                          • 10.3. Market Analysis, Insights and Forecast - by Import Market Analysis (Value & Volume)
                                                            • 10.4. Market Analysis, Insights and Forecast - by Export Market Analysis (Value & Volume)
                                                              • 10.5. Market Analysis, Insights and Forecast - by Price Trend Analysis
                                                              • 11. Northeast US Bio fungicides Industry Analysis, Insights and Forecast, 2019-2031
                                                                • 12. Southeast US Bio fungicides Industry Analysis, Insights and Forecast, 2019-2031
                                                                  • 13. Midwest US Bio fungicides Industry Analysis, Insights and Forecast, 2019-2031
                                                                    • 14. Southwest US Bio fungicides Industry Analysis, Insights and Forecast, 2019-2031
                                                                      • 15. West US Bio fungicides Industry Analysis, Insights and Forecast, 2019-2031
                                                                        • 16. Competitive Analysis
                                                                          • 16.1. Global Market Share Analysis 2024
                                                                            • 16.2. Company Profiles
                                                                              • 16.2.1 BioWorks Inc
                                                                                • 16.2.1.1. Overview
                                                                                • 16.2.1.2. Products
                                                                                • 16.2.1.3. SWOT Analysis
                                                                                • 16.2.1.4. Recent Developments
                                                                                • 16.2.1.5. Financials (Based on Availability)
                                                                              • 16.2.2 Novozyme Biologicals
                                                                                • 16.2.2.1. Overview
                                                                                • 16.2.2.2. Products
                                                                                • 16.2.2.3. SWOT Analysis
                                                                                • 16.2.2.4. Recent Developments
                                                                                • 16.2.2.5. Financials (Based on Availability)
                                                                              • 16.2.3 Isagro USA
                                                                                • 16.2.3.1. Overview
                                                                                • 16.2.3.2. Products
                                                                                • 16.2.3.3. SWOT Analysis
                                                                                • 16.2.3.4. Recent Developments
                                                                                • 16.2.3.5. Financials (Based on Availability)
                                                                              • 16.2.4 Marrone Bio Innovations
                                                                                • 16.2.4.1. Overview
                                                                                • 16.2.4.2. Products
                                                                                • 16.2.4.3. SWOT Analysis
                                                                                • 16.2.4.4. Recent Developments
                                                                                • 16.2.4.5. Financials (Based on Availability)
                                                                              • 16.2.5 Valent BioSciences LLC
                                                                                • 16.2.5.1. Overview
                                                                                • 16.2.5.2. Products
                                                                                • 16.2.5.3. SWOT Analysis
                                                                                • 16.2.5.4. Recent Developments
                                                                                • 16.2.5.5. Financials (Based on Availability)
                                                                              • 16.2.6 Syngenta AG
                                                                                • 16.2.6.1. Overview
                                                                                • 16.2.6.2. Products
                                                                                • 16.2.6.3. SWOT Analysis
                                                                                • 16.2.6.4. Recent Developments
                                                                                • 16.2.6.5. Financials (Based on Availability)
                                                                              • 16.2.7 De Sangosse Lt
                                                                                • 16.2.7.1. Overview
                                                                                • 16.2.7.2. Products
                                                                                • 16.2.7.3. SWOT Analysis
                                                                                • 16.2.7.4. Recent Developments
                                                                                • 16.2.7.5. Financials (Based on Availability)
                                                                              • 16.2.8 Certis USA LLC
                                                                                • 16.2.8.1. Overview
                                                                                • 16.2.8.2. Products
                                                                                • 16.2.8.3. SWOT Analysis
                                                                                • 16.2.8.4. Recent Developments
                                                                                • 16.2.8.5. Financials (Based on Availability)

                                                                        List of Figures

                                                                        1. Figure 1: Global US Bio fungicides Industry Revenue Breakdown (Million, %) by Region 2024 & 2032
                                                                        2. Figure 2: United states US Bio fungicides Industry Revenue (Million), by Country 2024 & 2032
                                                                        3. Figure 3: United states US Bio fungicides Industry Revenue Share (%), by Country 2024 & 2032
                                                                        4. Figure 4: North America US Bio fungicides Industry Revenue (Million), by Production Analysis 2024 & 2032
                                                                        5. Figure 5: North America US Bio fungicides Industry Revenue Share (%), by Production Analysis 2024 & 2032
                                                                        6. Figure 6: North America US Bio fungicides Industry Revenue (Million), by Consumption Analysis 2024 & 2032
                                                                        7. Figure 7: North America US Bio fungicides Industry Revenue Share (%), by Consumption Analysis 2024 & 2032
                                                                        8. Figure 8: North America US Bio fungicides Industry Revenue (Million), by Import Market Analysis (Value & Volume) 2024 & 2032
                                                                        9. Figure 9: North America US Bio fungicides Industry Revenue Share (%), by Import Market Analysis (Value & Volume) 2024 & 2032
                                                                        10. Figure 10: North America US Bio fungicides Industry Revenue (Million), by Export Market Analysis (Value & Volume) 2024 & 2032
                                                                        11. Figure 11: North America US Bio fungicides Industry Revenue Share (%), by Export Market Analysis (Value & Volume) 2024 & 2032
                                                                        12. Figure 12: North America US Bio fungicides Industry Revenue (Million), by Price Trend Analysis 2024 & 2032
                                                                        13. Figure 13: North America US Bio fungicides Industry Revenue Share (%), by Price Trend Analysis 2024 & 2032
                                                                        14. Figure 14: North America US Bio fungicides Industry Revenue (Million), by Country 2024 & 2032
                                                                        15. Figure 15: North America US Bio fungicides Industry Revenue Share (%), by Country 2024 & 2032
                                                                        16. Figure 16: South America US Bio fungicides Industry Revenue (Million), by Production Analysis 2024 & 2032
                                                                        17. Figure 17: South America US Bio fungicides Industry Revenue Share (%), by Production Analysis 2024 & 2032
                                                                        18. Figure 18: South America US Bio fungicides Industry Revenue (Million), by Consumption Analysis 2024 & 2032
                                                                        19. Figure 19: South America US Bio fungicides Industry Revenue Share (%), by Consumption Analysis 2024 & 2032
                                                                        20. Figure 20: South America US Bio fungicides Industry Revenue (Million), by Import Market Analysis (Value & Volume) 2024 & 2032
                                                                        21. Figure 21: South America US Bio fungicides Industry Revenue Share (%), by Import Market Analysis (Value & Volume) 2024 & 2032
                                                                        22. Figure 22: South America US Bio fungicides Industry Revenue (Million), by Export Market Analysis (Value & Volume) 2024 & 2032
                                                                        23. Figure 23: South America US Bio fungicides Industry Revenue Share (%), by Export Market Analysis (Value & Volume) 2024 & 2032
                                                                        24. Figure 24: South America US Bio fungicides Industry Revenue (Million), by Price Trend Analysis 2024 & 2032
                                                                        25. Figure 25: South America US Bio fungicides Industry Revenue Share (%), by Price Trend Analysis 2024 & 2032
                                                                        26. Figure 26: South America US Bio fungicides Industry Revenue (Million), by Country 2024 & 2032
                                                                        27. Figure 27: South America US Bio fungicides Industry Revenue Share (%), by Country 2024 & 2032
                                                                        28. Figure 28: Europe US Bio fungicides Industry Revenue (Million), by Production Analysis 2024 & 2032
                                                                        29. Figure 29: Europe US Bio fungicides Industry Revenue Share (%), by Production Analysis 2024 & 2032
                                                                        30. Figure 30: Europe US Bio fungicides Industry Revenue (Million), by Consumption Analysis 2024 & 2032
                                                                        31. Figure 31: Europe US Bio fungicides Industry Revenue Share (%), by Consumption Analysis 2024 & 2032
                                                                        32. Figure 32: Europe US Bio fungicides Industry Revenue (Million), by Import Market Analysis (Value & Volume) 2024 & 2032
                                                                        33. Figure 33: Europe US Bio fungicides Industry Revenue Share (%), by Import Market Analysis (Value & Volume) 2024 & 2032
                                                                        34. Figure 34: Europe US Bio fungicides Industry Revenue (Million), by Export Market Analysis (Value & Volume) 2024 & 2032
                                                                        35. Figure 35: Europe US Bio fungicides Industry Revenue Share (%), by Export Market Analysis (Value & Volume) 2024 & 2032
                                                                        36. Figure 36: Europe US Bio fungicides Industry Revenue (Million), by Price Trend Analysis 2024 & 2032
                                                                        37. Figure 37: Europe US Bio fungicides Industry Revenue Share (%), by Price Trend Analysis 2024 & 2032
                                                                        38. Figure 38: Europe US Bio fungicides Industry Revenue (Million), by Country 2024 & 2032
                                                                        39. Figure 39: Europe US Bio fungicides Industry Revenue Share (%), by Country 2024 & 2032
                                                                        40. Figure 40: Middle East & Africa US Bio fungicides Industry Revenue (Million), by Production Analysis 2024 & 2032
                                                                        41. Figure 41: Middle East & Africa US Bio fungicides Industry Revenue Share (%), by Production Analysis 2024 & 2032
                                                                        42. Figure 42: Middle East & Africa US Bio fungicides Industry Revenue (Million), by Consumption Analysis 2024 & 2032
                                                                        43. Figure 43: Middle East & Africa US Bio fungicides Industry Revenue Share (%), by Consumption Analysis 2024 & 2032
                                                                        44. Figure 44: Middle East & Africa US Bio fungicides Industry Revenue (Million), by Import Market Analysis (Value & Volume) 2024 & 2032
                                                                        45. Figure 45: Middle East & Africa US Bio fungicides Industry Revenue Share (%), by Import Market Analysis (Value & Volume) 2024 & 2032
                                                                        46. Figure 46: Middle East & Africa US Bio fungicides Industry Revenue (Million), by Export Market Analysis (Value & Volume) 2024 & 2032
                                                                        47. Figure 47: Middle East & Africa US Bio fungicides Industry Revenue Share (%), by Export Market Analysis (Value & Volume) 2024 & 2032
                                                                        48. Figure 48: Middle East & Africa US Bio fungicides Industry Revenue (Million), by Price Trend Analysis 2024 & 2032
                                                                        49. Figure 49: Middle East & Africa US Bio fungicides Industry Revenue Share (%), by Price Trend Analysis 2024 & 2032
                                                                        50. Figure 50: Middle East & Africa US Bio fungicides Industry Revenue (Million), by Country 2024 & 2032
                                                                        51. Figure 51: Middle East & Africa US Bio fungicides Industry Revenue Share (%), by Country 2024 & 2032
                                                                        52. Figure 52: Asia Pacific US Bio fungicides Industry Revenue (Million), by Production Analysis 2024 & 2032
                                                                        53. Figure 53: Asia Pacific US Bio fungicides Industry Revenue Share (%), by Production Analysis 2024 & 2032
                                                                        54. Figure 54: Asia Pacific US Bio fungicides Industry Revenue (Million), by Consumption Analysis 2024 & 2032
                                                                        55. Figure 55: Asia Pacific US Bio fungicides Industry Revenue Share (%), by Consumption Analysis 2024 & 2032
                                                                        56. Figure 56: Asia Pacific US Bio fungicides Industry Revenue (Million), by Import Market Analysis (Value & Volume) 2024 & 2032
                                                                        57. Figure 57: Asia Pacific US Bio fungicides Industry Revenue Share (%), by Import Market Analysis (Value & Volume) 2024 & 2032
                                                                        58. Figure 58: Asia Pacific US Bio fungicides Industry Revenue (Million), by Export Market Analysis (Value & Volume) 2024 & 2032
                                                                        59. Figure 59: Asia Pacific US Bio fungicides Industry Revenue Share (%), by Export Market Analysis (Value & Volume) 2024 & 2032
                                                                        60. Figure 60: Asia Pacific US Bio fungicides Industry Revenue (Million), by Price Trend Analysis 2024 & 2032
                                                                        61. Figure 61: Asia Pacific US Bio fungicides Industry Revenue Share (%), by Price Trend Analysis 2024 & 2032
                                                                        62. Figure 62: Asia Pacific US Bio fungicides Industry Revenue (Million), by Country 2024 & 2032
                                                                        63. Figure 63: Asia Pacific US Bio fungicides Industry Revenue Share (%), by Country 2024 & 2032

                                                                        List of Tables

                                                                        1. Table 1: Global US Bio fungicides Industry Revenue Million Forecast, by Region 2019 & 2032
                                                                        2. Table 2: Global US Bio fungicides Industry Revenue Million Forecast, by Production Analysis 2019 & 2032
                                                                        3. Table 3: Global US Bio fungicides Industry Revenue Million Forecast, by Consumption Analysis 2019 & 2032
                                                                        4. Table 4: Global US Bio fungicides Industry Revenue Million Forecast, by Import Market Analysis (Value & Volume) 2019 & 2032
                                                                        5. Table 5: Global US Bio fungicides Industry Revenue Million Forecast, by Export Market Analysis (Value & Volume) 2019 & 2032
                                                                        6. Table 6: Global US Bio fungicides Industry Revenue Million Forecast, by Price Trend Analysis 2019 & 2032
                                                                        7. Table 7: Global US Bio fungicides Industry Revenue Million Forecast, by Region 2019 & 2032
                                                                        8. Table 8: Global US Bio fungicides Industry Revenue Million Forecast, by Country 2019 & 2032
                                                                        9. Table 9: Northeast US Bio fungicides Industry Revenue (Million) Forecast, by Application 2019 & 2032
                                                                        10. Table 10: Southeast US Bio fungicides Industry Revenue (Million) Forecast, by Application 2019 & 2032
                                                                        11. Table 11: Midwest US Bio fungicides Industry Revenue (Million) Forecast, by Application 2019 & 2032
                                                                        12. Table 12: Southwest US Bio fungicides Industry Revenue (Million) Forecast, by Application 2019 & 2032
                                                                        13. Table 13: West US Bio fungicides Industry Revenue (Million) Forecast, by Application 2019 & 2032
                                                                        14. Table 14: Global US Bio fungicides Industry Revenue Million Forecast, by Production Analysis 2019 & 2032
                                                                        15. Table 15: Global US Bio fungicides Industry Revenue Million Forecast, by Consumption Analysis 2019 & 2032
                                                                        16. Table 16: Global US Bio fungicides Industry Revenue Million Forecast, by Import Market Analysis (Value & Volume) 2019 & 2032
                                                                        17. Table 17: Global US Bio fungicides Industry Revenue Million Forecast, by Export Market Analysis (Value & Volume) 2019 & 2032
                                                                        18. Table 18: Global US Bio fungicides Industry Revenue Million Forecast, by Price Trend Analysis 2019 & 2032
                                                                        19. Table 19: Global US Bio fungicides Industry Revenue Million Forecast, by Country 2019 & 2032
                                                                        20. Table 20: United States US Bio fungicides Industry Revenue (Million) Forecast, by Application 2019 & 2032
                                                                        21. Table 21: Canada US Bio fungicides Industry Revenue (Million) Forecast, by Application 2019 & 2032
                                                                        22. Table 22: Mexico US Bio fungicides Industry Revenue (Million) Forecast, by Application 2019 & 2032
                                                                        23. Table 23: Global US Bio fungicides Industry Revenue Million Forecast, by Production Analysis 2019 & 2032
                                                                        24. Table 24: Global US Bio fungicides Industry Revenue Million Forecast, by Consumption Analysis 2019 & 2032
                                                                        25. Table 25: Global US Bio fungicides Industry Revenue Million Forecast, by Import Market Analysis (Value & Volume) 2019 & 2032
                                                                        26. Table 26: Global US Bio fungicides Industry Revenue Million Forecast, by Export Market Analysis (Value & Volume) 2019 & 2032
                                                                        27. Table 27: Global US Bio fungicides Industry Revenue Million Forecast, by Price Trend Analysis 2019 & 2032
                                                                        28. Table 28: Global US Bio fungicides Industry Revenue Million Forecast, by Country 2019 & 2032
                                                                        29. Table 29: Brazil US Bio fungicides Industry Revenue (Million) Forecast, by Application 2019 & 2032
                                                                        30. Table 30: Argentina US Bio fungicides Industry Revenue (Million) Forecast, by Application 2019 & 2032
                                                                        31. Table 31: Rest of South America US Bio fungicides Industry Revenue (Million) Forecast, by Application 2019 & 2032
                                                                        32. Table 32: Global US Bio fungicides Industry Revenue Million Forecast, by Production Analysis 2019 & 2032
                                                                        33. Table 33: Global US Bio fungicides Industry Revenue Million Forecast, by Consumption Analysis 2019 & 2032
                                                                        34. Table 34: Global US Bio fungicides Industry Revenue Million Forecast, by Import Market Analysis (Value & Volume) 2019 & 2032
                                                                        35. Table 35: Global US Bio fungicides Industry Revenue Million Forecast, by Export Market Analysis (Value & Volume) 2019 & 2032
                                                                        36. Table 36: Global US Bio fungicides Industry Revenue Million Forecast, by Price Trend Analysis 2019 & 2032
                                                                        37. Table 37: Global US Bio fungicides Industry Revenue Million Forecast, by Country 2019 & 2032
                                                                        38. Table 38: United Kingdom US Bio fungicides Industry Revenue (Million) Forecast, by Application 2019 & 2032
                                                                        39. Table 39: Germany US Bio fungicides Industry Revenue (Million) Forecast, by Application 2019 & 2032
                                                                        40. Table 40: France US Bio fungicides Industry Revenue (Million) Forecast, by Application 2019 & 2032
                                                                        41. Table 41: Italy US Bio fungicides Industry Revenue (Million) Forecast, by Application 2019 & 2032
                                                                        42. Table 42: Spain US Bio fungicides Industry Revenue (Million) Forecast, by Application 2019 & 2032
                                                                        43. Table 43: Russia US Bio fungicides Industry Revenue (Million) Forecast, by Application 2019 & 2032
                                                                        44. Table 44: Benelux US Bio fungicides Industry Revenue (Million) Forecast, by Application 2019 & 2032
                                                                        45. Table 45: Nordics US Bio fungicides Industry Revenue (Million) Forecast, by Application 2019 & 2032
                                                                        46. Table 46: Rest of Europe US Bio fungicides Industry Revenue (Million) Forecast, by Application 2019 & 2032
                                                                        47. Table 47: Global US Bio fungicides Industry Revenue Million Forecast, by Production Analysis 2019 & 2032
                                                                        48. Table 48: Global US Bio fungicides Industry Revenue Million Forecast, by Consumption Analysis 2019 & 2032
                                                                        49. Table 49: Global US Bio fungicides Industry Revenue Million Forecast, by Import Market Analysis (Value & Volume) 2019 & 2032
                                                                        50. Table 50: Global US Bio fungicides Industry Revenue Million Forecast, by Export Market Analysis (Value & Volume) 2019 & 2032
                                                                        51. Table 51: Global US Bio fungicides Industry Revenue Million Forecast, by Price Trend Analysis 2019 & 2032
                                                                        52. Table 52: Global US Bio fungicides Industry Revenue Million Forecast, by Country 2019 & 2032
                                                                        53. Table 53: Turkey US Bio fungicides Industry Revenue (Million) Forecast, by Application 2019 & 2032
                                                                        54. Table 54: Israel US Bio fungicides Industry Revenue (Million) Forecast, by Application 2019 & 2032
                                                                        55. Table 55: GCC US Bio fungicides Industry Revenue (Million) Forecast, by Application 2019 & 2032
                                                                        56. Table 56: North Africa US Bio fungicides Industry Revenue (Million) Forecast, by Application 2019 & 2032
                                                                        57. Table 57: South Africa US Bio fungicides Industry Revenue (Million) Forecast, by Application 2019 & 2032
                                                                        58. Table 58: Rest of Middle East & Africa US Bio fungicides Industry Revenue (Million) Forecast, by Application 2019 & 2032
                                                                        59. Table 59: Global US Bio fungicides Industry Revenue Million Forecast, by Production Analysis 2019 & 2032
                                                                        60. Table 60: Global US Bio fungicides Industry Revenue Million Forecast, by Consumption Analysis 2019 & 2032
                                                                        61. Table 61: Global US Bio fungicides Industry Revenue Million Forecast, by Import Market Analysis (Value & Volume) 2019 & 2032
                                                                        62. Table 62: Global US Bio fungicides Industry Revenue Million Forecast, by Export Market Analysis (Value & Volume) 2019 & 2032
                                                                        63. Table 63: Global US Bio fungicides Industry Revenue Million Forecast, by Price Trend Analysis 2019 & 2032
                                                                        64. Table 64: Global US Bio fungicides Industry Revenue Million Forecast, by Country 2019 & 2032
                                                                        65. Table 65: China US Bio fungicides Industry Revenue (Million) Forecast, by Application 2019 & 2032
                                                                        66. Table 66: India US Bio fungicides Industry Revenue (Million) Forecast, by Application 2019 & 2032
                                                                        67. Table 67: Japan US Bio fungicides Industry Revenue (Million) Forecast, by Application 2019 & 2032
                                                                        68. Table 68: South Korea US Bio fungicides Industry Revenue (Million) Forecast, by Application 2019 & 2032
                                                                        69. Table 69: ASEAN US Bio fungicides Industry Revenue (Million) Forecast, by Application 2019 & 2032
                                                                        70. Table 70: Oceania US Bio fungicides Industry Revenue (Million) Forecast, by Application 2019 & 2032
                                                                        71. Table 71: Rest of Asia Pacific US Bio fungicides Industry Revenue (Million) Forecast, by Application 2019 & 2032


                                                                        Frequently Asked Questions

                                                                        1. What is the projected Compound Annual Growth Rate (CAGR) of the US Bio fungicides Industry?

                                                                        The projected CAGR is approximately 9.50%.

                                                                        2. Which companies are prominent players in the US Bio fungicides Industry?

                                                                        Key companies in the market include BioWorks Inc, Novozyme Biologicals, Isagro USA, Marrone Bio Innovations, Valent BioSciences LLC, Syngenta AG, De Sangosse Lt, Certis USA LLC.

                                                                        3. What are the main segments of the US Bio fungicides Industry?

                                                                        The market segments include Production Analysis, Consumption Analysis, Import Market Analysis (Value & Volume), Export Market Analysis (Value & Volume), Price Trend Analysis.

                                                                        4. Can you provide details about the market size?

                                                                        The market size is estimated to be USD 0.96 Million as of 2022.

                                                                        5. What are some drivers contributing to market growth?

                                                                        Adoption of Organic and Eco-friendly Farming Practices; Declining Area of Arable Land and Rising Food Security Concerns.

                                                                        6. What are the notable trends driving market growth?

                                                                        Fruits and Vegetables Fastest Market Growing Segment.

                                                                        7. Are there any restraints impacting market growth?

                                                                        High Demand for Conventional and Synthetic Products; Lack of Awareness and Other Factors Limiting the Adoption of Agricultural Inoculants.

                                                                        8. Can you provide examples of recent developments in the market?

                                                                        N/A

                                                                        9. What pricing options are available for accessing the report?

                                                                        Pricing options include single-user, multi-user, and enterprise licenses priced at USD 3800, USD 4500, and USD 5800 respectively.

                                                                        10. Is the market size provided in terms of value or volume?

                                                                        The market size is provided in terms of value, measured in Million.

                                                                        11. Are there any specific market keywords associated with the report?

                                                                        Yes, the market keyword associated with the report is "US Bio fungicides Industry," which aids in identifying and referencing the specific market segment covered.

                                                                        12. How do I determine which pricing option suits my needs best?

                                                                        The pricing options vary based on user requirements and access needs. Individual users may opt for single-user licenses, while businesses requiring broader access may choose multi-user or enterprise licenses for cost-effective access to the report.

                                                                        13. Are there any additional resources or data provided in the US Bio fungicides Industry report?

                                                                        While the report offers comprehensive insights, it's advisable to review the specific contents or supplementary materials provided to ascertain if additional resources or data are available.

                                                                        14. How can I stay updated on further developments or reports in the US Bio fungicides Industry?

                                                                        To stay informed about further developments, trends, and reports in the US Bio fungicides Industry, consider subscribing to industry newsletters, following relevant companies and organizations, or regularly checking reputable industry news sources and publications.


                                                                        Methodology

                                                                        Step 1 - Identification of Relevant Samples Size from Population Database

                                                                        Step Chart
                                                                        Bar Chart
                                                                        Method Chart

                                                                        Step 2 - Approaches for Defining Global Market Size (Value, Volume* & Price*)

                                                                        Approach Chart
                                                                        Top-down and bottom-up approaches are used to validate the global market size and estimate the market size for manufactures, regional segments, product, and application.

                                                                        Note*: In applicable scenarios

                                                                        Step 3 - Data Sources

                                                                        Primary Research

                                                                        • Web Analytics
                                                                        • Survey Reports
                                                                        • Research Institute
                                                                        • Latest Research Reports
                                                                        • Opinion Leaders

                                                                        Secondary Research

                                                                        • Annual Reports
                                                                        • White Paper
                                                                        • Latest Press Release
                                                                        • Industry Association
                                                                        • Paid Database
                                                                        • Investor Presentations
                                                                        Analyst Chart

                                                                        Step 4 - Data Triangulation

                                                                        Involves using different sources of information in order to increase the validity of a study

                                                                        These sources are likely to be stakeholders in a program - participants, other researchers, program staff, other community members, and so on.

                                                                        Then we put all data in single framework & apply various statistical tools to find out the dynamic on the market.

                                                                        During the analysis stage, feedback from the stakeholder groups would be compared to determine areas of agreement as well as areas of divergence

                                                                        Additionally, after gathering mixed and scattered data from a wide range of sources, data is triangulated and correlated to come up with estimated figures which are further validated through primary mediums or industry experts, opinion leaders.

                                                                        About Precision Market View

                                                                        Precision Market View offers precise market research, industry intelligence, and data analysis for healthcare, manufacturing, technology, and energy. Our reports provide the clarity you need to make informed decisions and drive growth.

                                                                        Our team combines primary research, advanced analytics, and industry expertise to deliver actionable intelligence. We offer syndicated reports, custom research, and consulting services tailored to your business needs.

                                                                        At Precision Market View, we are committed to quality, transparency, and client satisfaction. Every report is rigorously validated to ensure accuracy and relevance. Our global perspective and local expertise help you understand both the big picture and the finer details of your market.

                                                                        Stay informed with Precision Market View. Subscribe to our newsletter for the latest updates and research highlights, and follow us on social media for real-time insights.

                                                                        Precision Market View – Clarity for Your Strategic Decisions.

                                                                        artwork spiralartwork spiralRelated Reports
                                                                        artwork underline

                                                                        Opportunities in North America Crop Protection Chemicals Industry Market 2025-2033

                                                                        The North American crop protection chemicals market is booming, projected to reach [estimated 2033 market size in millions] by 2033 with a 4.34% CAGR. Discover key trends, driving forces, and major players shaping this dynamic industry, including insecticides, herbicides, fungicides, and more. Learn about regional variations and market segmentation across various crop types and application methods.

                                                                        July 2025
                                                                        Base Year: 2024
                                                                        No Of Pages: 180
                                                                        Price: $3800

                                                                        Apple Industry to Grow at XX CAGR: Market Size Analysis and Forecasts 2025-2033

                                                                        Discover the latest trends in the global apple industry. This in-depth market analysis reveals a steady growth trajectory, driven by consumer demand, diverse product applications, and expanding online retail. Learn about key players, regional insights, and future projections for the apple market from 2025-2033.

                                                                        July 2025
                                                                        Base Year: 2024
                                                                        No Of Pages: 234
                                                                        Price: $4750

                                                                        Digital Agriculture Market 2025-2033: Preparing for Growth and Change

                                                                        The booming digital agriculture market is projected to reach \$44.14 billion by 2033, fueled by precision farming, AI, and drone technology. Explore market trends, key players (AGCO, Microsoft, Deere), and regional growth in this comprehensive analysis.

                                                                        July 2025
                                                                        Base Year: 2024
                                                                        No Of Pages: 150
                                                                        Price: $4750

                                                                        North America Maize Industry Charting Growth Trajectories 2025-2033: Strategic Insights and Forecasts

                                                                        Discover the booming North American maize market! This comprehensive analysis reveals key trends, drivers, and restraints, including insights into hybrid seeds, field corn, sweet corn, popcorn, and major players like Bayer & Syngenta. Project your business strategy with our forecast to 2033.

                                                                        July 2025
                                                                        Base Year: 2024
                                                                        No Of Pages: 180
                                                                        Price: $3800

                                                                        North America Agricultural Tractors Machinery Market 2025-2033 Overview: Trends, Competitor Dynamics, and Opportunities

                                                                        Discover the booming North American agricultural tractors market! This comprehensive analysis reveals key trends, drivers, and restraints impacting the $16.39 billion industry through 2033, focusing on key players like Deere & Company and Mahindra & Mahindra. Explore market segmentation by HP and drive type, plus regional breakdowns.

                                                                        July 2025
                                                                        Base Year: 2024
                                                                        No Of Pages: 234
                                                                        Price: $4750

                                                                        APAC Biofertilizers Market Growth Opportunities: Market Size Forecast to 2033

                                                                        Discover the booming APAC biofertilizers market! This comprehensive analysis reveals a CAGR of 10.80%, driven by sustainable agriculture and growing demand for organic food. Explore market size projections, key segments (Rhizobium, Azospirillum, etc.), and leading companies shaping this dynamic industry.

                                                                        July 2025
                                                                        Base Year: 2024
                                                                        No Of Pages: 180
                                                                        Price: $4750

                                                                        Turkey Agricultural Tractor Market Dynamics and Forecasts: 2025-2033 Strategic Insights

                                                                        Discover the booming Turkish agricultural tractor market! This comprehensive analysis reveals a 6.10% CAGR, driven by government support and technological advancements. Explore market trends, segmentation by horsepower (50HP, 75HP, 100HP, 200HP+), key players, and growth projections to 2033. Invest wisely in this expanding sector!

                                                                        July 2025
                                                                        Base Year: 2024
                                                                        No Of Pages: 197
                                                                        Price: $3800

                                                                        North America Herbicide Market Insightful Analysis: Trends, Competitor Dynamics, and Opportunities 2025-2033

                                                                        Discover the surging North American herbicide market, projected to reach $XX million by 2033 with a 4.34% CAGR. This in-depth analysis explores key drivers, trends, restraints, and competitive landscapes, covering chemigation, foliar application, crop types, and leading companies like FMC and Bayer. Gain insights into regional market shares and future growth projections.

                                                                        July 2025
                                                                        Base Year: 2024
                                                                        No Of Pages: 180
                                                                        Price: $3800

                                                                        Vietnam Agro Machinery Market Insights: Growth at XX CAGR Through 2033

                                                                        Discover the booming Vietnam agro-machinery market, projected to reach [estimated value] by 2033 with a CAGR of 11.50%. This in-depth analysis explores market drivers, trends, restraints, key players (Yanmar, Kubota, VEAM), and segment insights (tractors, rice transplanters, harvesting machinery). Learn about investment opportunities and future growth potential.

                                                                        July 2025
                                                                        Base Year: 2024
                                                                        No Of Pages: 150
                                                                        Price: $3800

                                                                        Exploring Key Dynamics of Honey Industry Industry

                                                                        Discover the booming honey market! This comprehensive analysis reveals a $11.08B industry with a 5.20% CAGR, exploring key drivers, trends, regional insights (North America, Europe, Asia-Pacific), and leading brands like Dabur Honey and Patanjali Ayurved. Learn about raw honey, organic honey, Manuka honey, and more. Get your free market research now!

                                                                        July 2025
                                                                        Base Year: 2024
                                                                        No Of Pages: 234
                                                                        Price: $4750

                                                                        Emerging Market Insights in Cotton Trade Analysis Market: 2025-2033 Overview

                                                                        Discover the latest insights into the booming global cotton trade market. This comprehensive analysis reveals a $60B market (2025) projected to grow at a 4.5% CAGR through 2033, driven by textile industry growth and sustainable cotton demand. Explore key trends, restraints, and regional market shares.

                                                                        July 2025
                                                                        Base Year: 2024
                                                                        No Of Pages: 150
                                                                        Price: $4750

                                                                        Asia-pacific Tomato Seed Market Projected to Grow at XX CAGR: Insights and Forecasts 2025-2033

                                                                        The Asia-Pacific tomato seed market is booming, driven by rising demand and advancements in breeding technology. Discover key market trends, growth projections (2025-2033), major players, and regional insights in this comprehensive market analysis.

                                                                        July 2025
                                                                        Base Year: 2024
                                                                        No Of Pages: 180
                                                                        Price: $3800

                                                                        Uganda Agriculture Industry Market Strategies for the Next Decade: 2025-2033

                                                                        Discover the booming Ugandan agriculture industry! Explore market size ($4.07B in 2025), 4.20% CAGR growth projections to 2033, key players, and regional trends in cereals, oilseeds, fruits, and vegetables. Invest in Uganda's agricultural future.

                                                                        July 2025
                                                                        Base Year: 2024
                                                                        No Of Pages: 150
                                                                        Price: $3800

                                                                        Artichokes Industry: Harnessing Emerging Innovations for Growth 2025-2033

                                                                        Discover the booming artichoke market! Explore key trends, regional analysis, and leading companies driving growth in this $XX million industry projected to reach [estimated 2033 value] by 2033. Learn about the rising demand for fresh, canned, frozen, and marinated artichokes in the food service, household, and industrial sectors.

                                                                        July 2025
                                                                        Base Year: 2024
                                                                        No Of Pages: 197
                                                                        Price: $3800

                                                                        Agricultural Inoculants Market Growth Opportunities and Market Forecast 2025-2033: A Strategic Analysis

                                                                        Discover the booming agricultural inoculants market! Our comprehensive analysis reveals a CAGR of 10.50%, driven by sustainable farming trends and rising food demands. Explore market size, segmentation, key players (Bioceres, Novozymes, BASF), and regional insights for 2025-2033. Learn how bio-based solutions are revolutionizing agriculture.

                                                                        July 2025
                                                                        Base Year: 2024
                                                                        No Of Pages: 150
                                                                        Price: $4750

                                                                        US Farm Equipment Industry Market’s Role in Emerging Tech: Insights and Projections 2025-2033

                                                                        The US farm equipment market is booming, projected to reach [estimated 2033 value] by 2033, driven by precision agriculture, government initiatives, and rising demand. Explore market trends, key players (John Deere, Kubota, AGCO), and regional insights in this comprehensive analysis.

                                                                        July 2025
                                                                        Base Year: 2024
                                                                        No Of Pages: 150
                                                                        Price: $3800

                                                                        Tanzania Fruits and Vegetables Industry Market Demand and Consumption Trends: Outlook 2025-2033

                                                                        Discover the booming Tanzanian fruits and vegetables market! This comprehensive report reveals a $2.17B market in 2025, projected to grow at a 6.5% CAGR until 2033. Explore key trends, challenges, and opportunities in production, consumption, import/export, and regional analysis. Invest wisely with our detailed insights.

                                                                        July 2025
                                                                        Base Year: 2024
                                                                        No Of Pages: 197
                                                                        Price: $3800

                                                                        Technological Advances in Hybrid Soybean Seeds Market Market: Trends and Opportunities 2025-2033

                                                                        The booming hybrid soybean seeds market, projected to reach $X Billion by 2025 and growing at a CAGR of 10.20%, is analyzed in this comprehensive report. Discover key drivers, trends, and restraints shaping this dynamic sector, along with leading companies and regional market shares. Explore the potential of hybrid soybean seeds for increased yields and disease resistance.

                                                                        July 2025
                                                                        Base Year: 2024
                                                                        No Of Pages: 197
                                                                        Price: $3800

                                                                        Farming Robots and Mechatronics Industry Market Disruption Trends and Insights

                                                                        The farming robots and mechatronics market is booming, with a 20.40% CAGR. Discover key trends, market segments (autonomous tractors, UAVs, milking robots), leading companies, and regional growth projections for this rapidly expanding sector. Learn how automation is transforming agriculture and optimizing efficiency for sustainable farming practices.

                                                                        July 2025
                                                                        Base Year: 2024
                                                                        No Of Pages: 197
                                                                        Price: $3800

                                                                        Europe Quinoa Seed Market Industry’s Growth Dynamics and Insights

                                                                        Discover the booming European quinoa seed market! Explore key growth drivers, market trends, and competitive landscape analysis. Learn about leading companies and regional market shares in this comprehensive report covering the period 2019-2033. Projected CAGR of 5.20% indicates significant investment potential.

                                                                        July 2025
                                                                        Base Year: 2024
                                                                        No Of Pages: 180
                                                                        Price: $4750
                                                                        • Home
                                                                        • About Us
                                                                        • Industries
                                                                          • Aerospace & Defense
                                                                          • Agriculture
                                                                          • Animal Nutrition & Wellness
                                                                          • Automotive
                                                                          • Chemicals & Materials
                                                                          • Consumer Goods and Services
                                                                          • Energy & Power
                                                                          • Financial Services and Investment Intelligence
                                                                          • Food & Beverage
                                                                          • Home and Property Improvement
                                                                          • Hospitality and Tourism
                                                                          • Logistics
                                                                          • Manufacturing Products and Services
                                                                          • Packaging
                                                                          • Professional and Commercial Services
                                                                          • Real Estate and Construction
                                                                          • Retail
                                                                          • Technology, Media and Telecom
                                                                          • Healthcare
                                                                        • Services
                                                                        • Contact
                                                                        Main Logo
                                                                        • Home
                                                                        • About Us
                                                                        • Industries
                                                                          • Aerospace & Defense
                                                                          • Agriculture
                                                                          • Animal Nutrition & Wellness
                                                                          • Automotive
                                                                          • Chemicals & Materials
                                                                          • Consumer Goods and Services
                                                                          • Energy & Power
                                                                          • Financial Services and Investment Intelligence
                                                                          • Food & Beverage
                                                                          • Home and Property Improvement
                                                                          • Hospitality and Tourism
                                                                          • Logistics
                                                                          • Manufacturing Products and Services
                                                                          • Packaging
                                                                          • Professional and Commercial Services
                                                                          • Real Estate and Construction
                                                                          • Retail
                                                                          • Technology, Media and Telecom
                                                                          • Healthcare
                                                                        • Services
                                                                        • Contact
                                                                        +17162654855
                                                                        [email protected]

                                                                        +17162654855

                                                                        [email protected]

                                                                        Business Address

                                                                        Head Office

                                                                        Office no. A 5010, fifth floor, Solitaire Business Hub, Near Phoenix mall, Pune, Maharashtra 411014

                                                                        Contact Information

                                                                        Craig Francis

                                                                        Business Development Head

                                                                        +17162654855

                                                                        [email protected]

                                                                        Connect With Us

                                                                        Secure Payment Partners

                                                                        payment image
                                                                        RetailLogisticsPackagingAutomotiveHealthcareAgricultureEnergy & PowerFood & BeverageAerospace & DefenseChemicals & MaterialsHospitality and TourismAnimal Nutrition & WellnessConsumer Goods and ServicesReal Estate and ConstructionHome and Property ImprovementTechnology, Media and TelecomManufacturing Products and ServicesFinancial Services and Investment Intelligence

                                                                        © 2025 All rights reserved


                                                                        Privacy Policy
                                                                        Terms and Conditions
                                                                        FAQ