
Key Insights
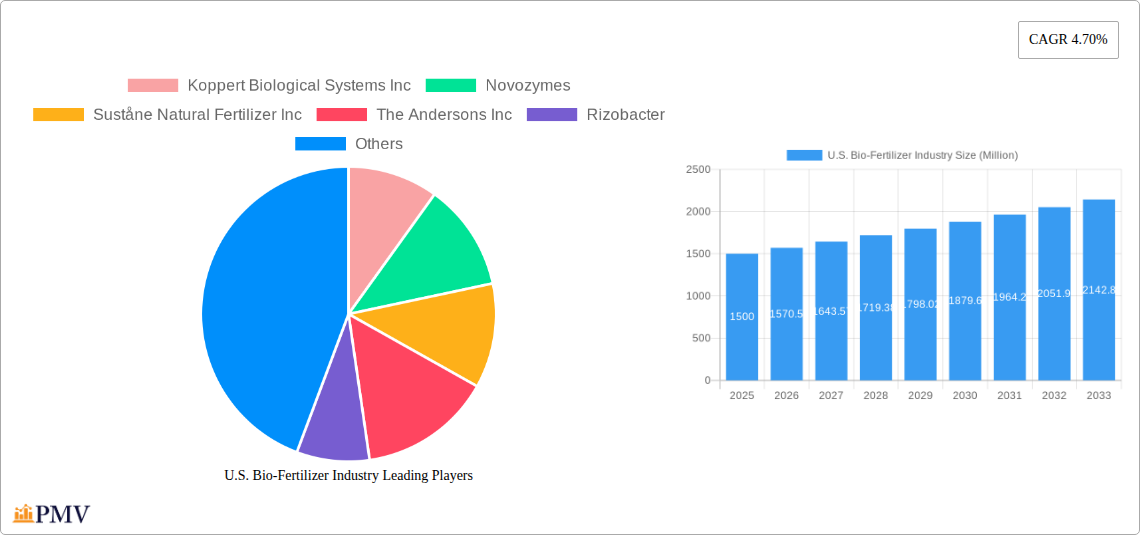
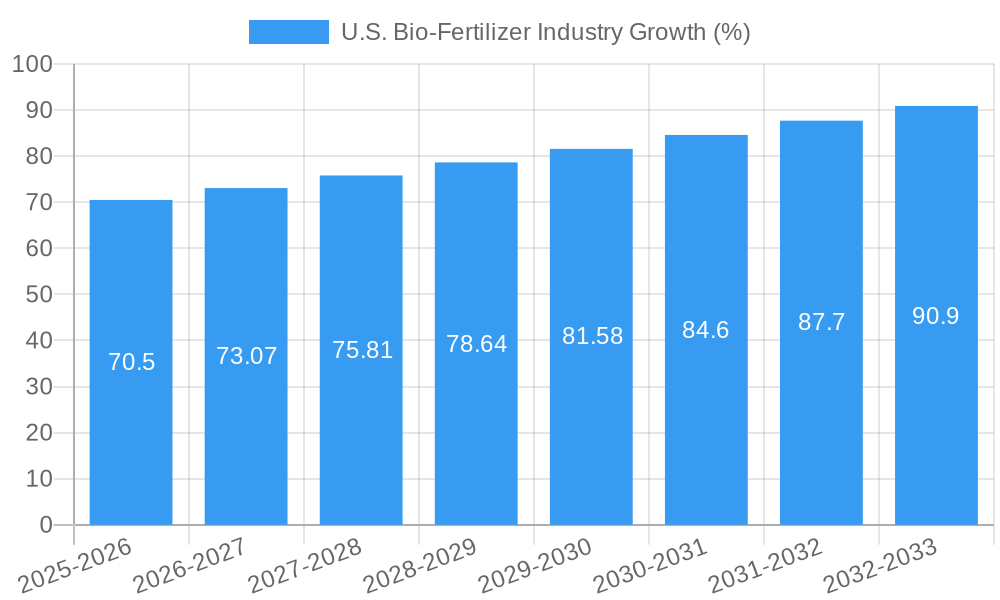
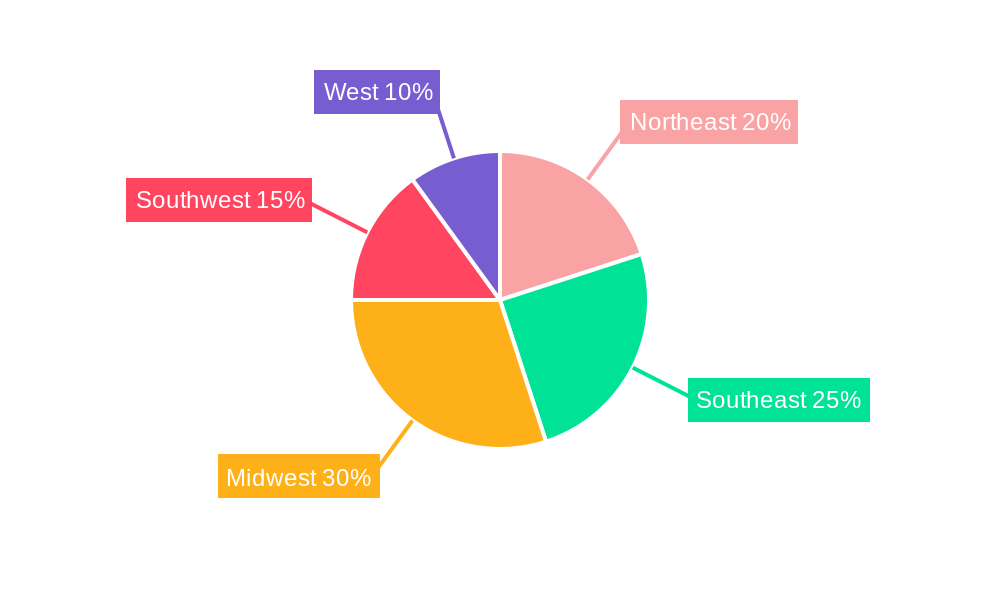
The U.S. biofertilizer market, valued at approximately $1.5 billion in 2025, is projected to experience robust growth, exhibiting a compound annual growth rate (CAGR) of 4.70% from 2025 to 2033. This expansion is driven by increasing awareness of sustainable agricultural practices, stringent regulations on chemical fertilizers, and the growing demand for organically produced food. Farmers are increasingly adopting biofertilizers to enhance soil health, improve crop yields, and reduce reliance on synthetic inputs, contributing significantly to market growth. The market is segmented by form (Azospirillum, Azotobacter, Mycorrhiza, Phosphate Solubilizing Bacteria, Rhizobium, and Other Biofertilizers) and crop type (cash crops, horticultural crops, and row crops). While all segments contribute significantly, the demand for biofertilizers in row crops is likely to be the largest due to the extensive acreage under cultivation. Specific forms, such as mycorrhiza and phosphate-solubilizing bacteria, are expected to witness higher growth due to their efficacy in enhancing nutrient uptake in plants. The Northeast, Southeast, Midwest, and Southwest regions of the United States all contribute significantly to overall market demand, reflecting the diverse agricultural landscapes across the country. However, factors such as the high initial investment required for biofertilizer production and application, and a lack of awareness among some farmers, could potentially restrain market growth to some extent.
Major players in the U.S. biofertilizer market, including Koppert Biological Systems Inc, Novozymes, Suståne Natural Fertilizer Inc, The Andersons Inc, and others, are investing heavily in research and development to improve product efficacy and expand their product portfolios. This competitive landscape is fostering innovation and driving the development of specialized biofertilizers tailored to specific crops and soil conditions. The industry is also witnessing a growing trend towards partnerships and collaborations between biofertilizer companies and agricultural input suppliers, aiming to enhance product distribution and market penetration. Future growth will likely be influenced by government initiatives promoting sustainable agriculture, increased consumer preference for organically grown food, and technological advancements in biofertilizer production and application. The market's continued trajectory suggests considerable potential for expansion over the forecast period.
U.S. Bio-Fertilizer Industry Market Report: 2019-2033
This comprehensive report provides an in-depth analysis of the U.S. bio-fertilizer industry, encompassing market size, growth drivers, competitive landscape, and future outlook. The study period covers 2019-2033, with a base year of 2025 and a forecast period of 2025-2033. Key industry players such as Koppert Biological Systems Inc, Novozymes, Suståne Natural Fertilizer Inc, The Andersons Inc, Rizobacter, AgroLiquid, Symborg Inc, Indogulf BioAg LLC, Kula Bio Inc, and Lallemand Inc are analyzed, alongside key segments like Azospirillum, Azotobacter, Mycorrhiza, Phosphate Solubilizing Bacteria, Rhizobium, and Other Biofertilizers, across various crop types (Cash Crops, Horticultural Crops, Row Crops). The report offers actionable insights for investors, industry professionals, and stakeholders seeking to navigate this dynamic market.
U.S. Bio-Fertilizer Industry Market Structure & Competitive Dynamics
The U.S. bio-fertilizer market is characterized by a moderately concentrated structure, with several key players holding significant market share. While precise market share data for each company is proprietary, major players like Novozymes and Koppert Biological Systems Inc. command substantial portions. The industry exhibits a dynamic innovation ecosystem, driven by continuous research and development in microbial formulations and application technologies. Regulatory frameworks, primarily overseen by the EPA, influence product registration and labeling. Competition exists from chemical fertilizers, but increasing consumer demand for sustainable agriculture fuels bio-fertilizer adoption. Mergers and acquisitions (M&A) activity, exemplified by Corteva Agriscience's acquisition of Symborg Inc. in September 2022 (estimated deal value: xx Million), is reshaping the competitive landscape, driving consolidation and expanding distribution networks. These M&A activities are primarily driven by a desire to access new technologies, expand market reach, and enhance product portfolios. The total value of M&A deals in the period 2019-2024 is estimated at xx Million.
- Market Concentration: Moderately concentrated, with several dominant players.
- Innovation: High level of R&D in microbial strains and application methods.
- Regulatory Framework: EPA regulations govern product registration and labeling.
- Substitutes: Chemical fertilizers present a key competitive challenge.
- End-User Trends: Growing preference for sustainable and environmentally friendly farming practices.
- M&A Activity: Significant consolidation through acquisitions, driving market share shifts.
U.S. Bio-Fertilizer Industry Industry Trends & Insights
The U.S. bio-fertilizer market is experiencing robust growth, driven by several factors. The rising awareness of environmental concerns and the increasing demand for sustainable agricultural practices are key growth catalysts. Government initiatives promoting sustainable agriculture and reducing reliance on chemical fertilizers further boost market expansion. Technological advancements in bio-fertilizer formulations, enhancing efficacy and application methods, also contribute to growth. The market exhibits a strong preference for bio-fertilizers offering improved crop yields, enhanced nutrient uptake, and reduced environmental impact. The compound annual growth rate (CAGR) from 2019 to 2024 is estimated at xx%, with a projected market penetration rate of xx% by 2033. The market is also witnessing the emergence of innovative products like the LALFIX® START SPHERICAL Granule, launched in July 2022, highlighting the ongoing technological disruptions within the sector. The partnership between Novozymes and AgroFresh in January 2022 demonstrates a strategic shift towards integrating bio-fertilizers into broader sustainable agricultural solutions. This trend toward collaborations and vertical integration within the agricultural value chain is projected to accelerate in the coming years. Competitive dynamics continue to shape market strategies, leading to price adjustments and product differentiation based on efficacy and application.
Dominant Markets & Segments in U.S. Bio-Fertilizer Industry
The U.S. bio-fertilizer market shows strong regional variations in adoption rates based on agricultural practices and environmental conditions. While a specific leading region is difficult to pinpoint without precise sales data, states with significant agricultural production and a focus on sustainable farming are likely to dominate. Within the segment breakdown:
- Form: Phosphate Solubilizing Bacteria and Rhizobium are currently dominant forms due to their established efficacy and wide applicability across various crops.
- Crop Type: Row crops, particularly corn and soybeans, account for a significant portion of the market due to large-scale cultivation and the potential for yield improvements.
Key Drivers:
- Economic Policies: Government subsidies and incentives for sustainable agriculture.
- Infrastructure: Efficient distribution networks and access to technology.
- Consumer Preferences: Growing demand for organically produced food and environmentally responsible farming.
U.S. Bio-Fertilizer Industry Product Innovations
The U.S. bio-fertilizer industry is witnessing continuous innovation in product formulations and application technologies. Recent advancements include the development of granular inoculants like the LALFIX® START SPHERICAL Granule, which combine multiple beneficial microbes for enhanced efficacy. These innovations aim to improve nutrient uptake, enhance plant growth, and ultimately increase crop yields. The focus is shifting towards tailored solutions designed to address specific crop needs and environmental conditions, leading to a more targeted and sustainable approach to fertilization. Competition is intensifying around the development of bio-fertilizers with improved shelf life, ease of application, and superior performance under various environmental conditions.
Report Segmentation & Scope
This report segments the U.S. bio-fertilizer market based on form (Azospirillum, Azotobacter, Mycorrhiza, Phosphate Solubilizing Bacteria, Rhizobium, Other Biofertilizer) and crop type (Cash Crops, Horticultural Crops, Row Crops). Each segment's growth projection, market size (in millions), and competitive dynamics are analyzed. The forecast period extends to 2033, offering insights into future market trends and potential opportunities. While precise market size data for each segment requires proprietary information, we anticipate significant growth for Phosphate Solubilizing Bacteria and Rhizobium across various crops due to their wide applicability and effectiveness.
Key Drivers of U.S. Bio-Fertilizer Industry Growth
The growth of the U.S. bio-fertilizer industry is primarily driven by the increasing global demand for sustainable agricultural practices, coupled with environmental concerns regarding chemical fertilizers. Government regulations promoting sustainable agriculture and the rising consumer preference for organic produce are significant contributing factors. Technological advancements, leading to more effective and convenient bio-fertilizer formulations, also stimulate market expansion.
Challenges in the U.S. Bio-Fertilizer Industry Sector
The U.S. bio-fertilizer industry faces several challenges, including the high cost of research and development, stringent regulatory approvals, and the need for consistent quality control. Competition from established chemical fertilizer manufacturers, coupled with fluctuating raw material prices and supply chain disruptions, adds further complexity. These factors can impact profitability and market penetration. The relatively high initial investment required for farmers to adopt bio-fertilizers can also act as a barrier.
Leading Players in the U.S. Bio-Fertilizer Industry Market
- Koppert Biological Systems Inc
- Novozymes
- Suståne Natural Fertilizer Inc
- The Andersons Inc
- Rizobacter
- AgroLiquid
- Symborg Inc
- Indogulf BioAg LLC (Biotech Division of Indogulf Company)
- Kula Bio Inc
- Lallemand Inc
Key Developments in U.S. Bio-Fertilizer Industry Sector
- September 2022: Corteva Agriscience acquired Symborg Inc., significantly enhancing Symborg's market reach and distribution capabilities.
- July 2022: Lallemand Inc. launched LALFIX® START SPHERICAL Granule, a novel granular inoculant combining beneficial microbes for improved phosphorus solubilization and root mass.
- January 2022: Novozymes and AgroFresh partnered to leverage biotechnology for enhancing post-harvest quality and reducing food waste, indirectly supporting the bio-fertilizer market by improving the overall sustainability of the food supply chain.
Strategic U.S. Bio-Fertilizer Industry Market Outlook
The U.S. bio-fertilizer market exhibits strong growth potential, driven by increasing environmental awareness, government support for sustainable agriculture, and technological advancements. Strategic opportunities exist in developing innovative bio-fertilizer formulations tailored to specific crop needs and expanding market penetration through collaborations and strategic partnerships. The focus on improving product efficacy, enhancing application methods, and lowering production costs will be crucial for future success. The continued consolidation of the industry through M&A activity is expected, leading to greater efficiencies and larger market shares for key players.
U.S. Bio-Fertilizer Industry Segmentation
- 1. Production Analysis
- 2. Consumption Analysis
- 3. Import Market Analysis (Value & Volume)
- 4. Export Market Analysis (Value & Volume)
- 5. Price Trend Analysis
U.S. Bio-Fertilizer Industry Segmentation By Geography
- 1. U.S.
U.S. Bio-Fertilizer Industry REPORT HIGHLIGHTS
| Aspects | Details |
|---|---|
| Study Period | 2019-2033 |
| Base Year | 2024 |
| Estimated Year | 2025 |
| Forecast Period | 2025-2033 |
| Historical Period | 2019-2024 |
| Growth Rate | CAGR of 4.70% from 2019-2033 |
| Segmentation |
|
Table of Contents
- 1. Introduction
- 1.1. Research Scope
- 1.2. Market Segmentation
- 1.3. Research Methodology
- 1.4. Definitions and Assumptions
- 2. Executive Summary
- 2.1. Introduction
- 3. Market Dynamics
- 3.1. Introduction
- 3.2. Market Drivers
- 3.2.1. Seed Treatment As A Solution To Enhance Yield; Growing Awareness For Seed Treatment Among The Farmers; Rising Trend Of Organic Farming
- 3.3. Market Restrains
- 3.3.1. Limitations Across Farm-Level Seed Treatment; Rising Environmental Concerns
- 3.4. Market Trends
- 3.4.1. OTHER KEY INDUSTRY TRENDS COVERED IN THE REPORT
- 4. Market Factor Analysis
- 4.1. Porters Five Forces
- 4.2. Supply/Value Chain
- 4.3. PESTEL analysis
- 4.4. Market Entropy
- 4.5. Patent/Trademark Analysis
- 5. U.S. Bio-Fertilizer Industry Analysis, Insights and Forecast, 2019-2031
- 5.1. Market Analysis, Insights and Forecast - by Production Analysis
- 5.2. Market Analysis, Insights and Forecast - by Consumption Analysis
- 5.3. Market Analysis, Insights and Forecast - by Import Market Analysis (Value & Volume)
- 5.4. Market Analysis, Insights and Forecast - by Export Market Analysis (Value & Volume)
- 5.5. Market Analysis, Insights and Forecast - by Price Trend Analysis
- 5.6. Market Analysis, Insights and Forecast - by Region
- 5.6.1. U.S.
- 5.1. Market Analysis, Insights and Forecast - by Production Analysis
- 6. Northeast U.S. Bio-Fertilizer Industry Analysis, Insights and Forecast, 2019-2031
- 7. Southeast U.S. Bio-Fertilizer Industry Analysis, Insights and Forecast, 2019-2031
- 8. Midwest U.S. Bio-Fertilizer Industry Analysis, Insights and Forecast, 2019-2031
- 9. Southwest U.S. Bio-Fertilizer Industry Analysis, Insights and Forecast, 2019-2031
- 10. West U.S. Bio-Fertilizer Industry Analysis, Insights and Forecast, 2019-2031
- 11. Competitive Analysis
- 11.1. Market Share Analysis 2024
- 11.2. Company Profiles
- 11.2.1 Koppert Biological Systems Inc
- 11.2.1.1. Overview
- 11.2.1.2. Products
- 11.2.1.3. SWOT Analysis
- 11.2.1.4. Recent Developments
- 11.2.1.5. Financials (Based on Availability)
- 11.2.2 Novozymes
- 11.2.2.1. Overview
- 11.2.2.2. Products
- 11.2.2.3. SWOT Analysis
- 11.2.2.4. Recent Developments
- 11.2.2.5. Financials (Based on Availability)
- 11.2.3 Suståne Natural Fertilizer Inc
- 11.2.3.1. Overview
- 11.2.3.2. Products
- 11.2.3.3. SWOT Analysis
- 11.2.3.4. Recent Developments
- 11.2.3.5. Financials (Based on Availability)
- 11.2.4 The Andersons Inc
- 11.2.4.1. Overview
- 11.2.4.2. Products
- 11.2.4.3. SWOT Analysis
- 11.2.4.4. Recent Developments
- 11.2.4.5. Financials (Based on Availability)
- 11.2.5 Rizobacter
- 11.2.5.1. Overview
- 11.2.5.2. Products
- 11.2.5.3. SWOT Analysis
- 11.2.5.4. Recent Developments
- 11.2.5.5. Financials (Based on Availability)
- 11.2.6 AgroLiquid
- 11.2.6.1. Overview
- 11.2.6.2. Products
- 11.2.6.3. SWOT Analysis
- 11.2.6.4. Recent Developments
- 11.2.6.5. Financials (Based on Availability)
- 11.2.7 Symborg Inc
- 11.2.7.1. Overview
- 11.2.7.2. Products
- 11.2.7.3. SWOT Analysis
- 11.2.7.4. Recent Developments
- 11.2.7.5. Financials (Based on Availability)
- 11.2.8 Indogulf BioAg LLC (Biotech Division of Indogulf Company)
- 11.2.8.1. Overview
- 11.2.8.2. Products
- 11.2.8.3. SWOT Analysis
- 11.2.8.4. Recent Developments
- 11.2.8.5. Financials (Based on Availability)
- 11.2.9 Kula Bio Inc
- 11.2.9.1. Overview
- 11.2.9.2. Products
- 11.2.9.3. SWOT Analysis
- 11.2.9.4. Recent Developments
- 11.2.9.5. Financials (Based on Availability)
- 11.2.10 Lallemand Inc
- 11.2.10.1. Overview
- 11.2.10.2. Products
- 11.2.10.3. SWOT Analysis
- 11.2.10.4. Recent Developments
- 11.2.10.5. Financials (Based on Availability)
- 11.2.1 Koppert Biological Systems Inc
List of Figures
- Figure 1: U.S. Bio-Fertilizer Industry Revenue Breakdown (Million, %) by Product 2024 & 2032
- Figure 2: U.S. Bio-Fertilizer Industry Share (%) by Company 2024
List of Tables
- Table 1: U.S. Bio-Fertilizer Industry Revenue Million Forecast, by Region 2019 & 2032
- Table 2: U.S. Bio-Fertilizer Industry Revenue Million Forecast, by Production Analysis 2019 & 2032
- Table 3: U.S. Bio-Fertilizer Industry Revenue Million Forecast, by Consumption Analysis 2019 & 2032
- Table 4: U.S. Bio-Fertilizer Industry Revenue Million Forecast, by Import Market Analysis (Value & Volume) 2019 & 2032
- Table 5: U.S. Bio-Fertilizer Industry Revenue Million Forecast, by Export Market Analysis (Value & Volume) 2019 & 2032
- Table 6: U.S. Bio-Fertilizer Industry Revenue Million Forecast, by Price Trend Analysis 2019 & 2032
- Table 7: U.S. Bio-Fertilizer Industry Revenue Million Forecast, by Region 2019 & 2032
- Table 8: U.S. Bio-Fertilizer Industry Revenue Million Forecast, by Country 2019 & 2032
- Table 9: Northeast U.S. Bio-Fertilizer Industry Revenue (Million) Forecast, by Application 2019 & 2032
- Table 10: Southeast U.S. Bio-Fertilizer Industry Revenue (Million) Forecast, by Application 2019 & 2032
- Table 11: Midwest U.S. Bio-Fertilizer Industry Revenue (Million) Forecast, by Application 2019 & 2032
- Table 12: Southwest U.S. Bio-Fertilizer Industry Revenue (Million) Forecast, by Application 2019 & 2032
- Table 13: West U.S. Bio-Fertilizer Industry Revenue (Million) Forecast, by Application 2019 & 2032
- Table 14: U.S. Bio-Fertilizer Industry Revenue Million Forecast, by Production Analysis 2019 & 2032
- Table 15: U.S. Bio-Fertilizer Industry Revenue Million Forecast, by Consumption Analysis 2019 & 2032
- Table 16: U.S. Bio-Fertilizer Industry Revenue Million Forecast, by Import Market Analysis (Value & Volume) 2019 & 2032
- Table 17: U.S. Bio-Fertilizer Industry Revenue Million Forecast, by Export Market Analysis (Value & Volume) 2019 & 2032
- Table 18: U.S. Bio-Fertilizer Industry Revenue Million Forecast, by Price Trend Analysis 2019 & 2032
- Table 19: U.S. Bio-Fertilizer Industry Revenue Million Forecast, by Country 2019 & 2032
Frequently Asked Questions
1. What is the projected Compound Annual Growth Rate (CAGR) of the U.S. Bio-Fertilizer Industry?
The projected CAGR is approximately 4.70%.
2. Which companies are prominent players in the U.S. Bio-Fertilizer Industry?
Key companies in the market include Koppert Biological Systems Inc, Novozymes, Suståne Natural Fertilizer Inc, The Andersons Inc, Rizobacter, AgroLiquid, Symborg Inc, Indogulf BioAg LLC (Biotech Division of Indogulf Company), Kula Bio Inc, Lallemand Inc.
3. What are the main segments of the U.S. Bio-Fertilizer Industry?
The market segments include Production Analysis, Consumption Analysis, Import Market Analysis (Value & Volume), Export Market Analysis (Value & Volume), Price Trend Analysis.
4. Can you provide details about the market size?
The market size is estimated to be USD XX Million as of 2022.
5. What are some drivers contributing to market growth?
Seed Treatment As A Solution To Enhance Yield; Growing Awareness For Seed Treatment Among The Farmers; Rising Trend Of Organic Farming.
6. What are the notable trends driving market growth?
OTHER KEY INDUSTRY TRENDS COVERED IN THE REPORT.
7. Are there any restraints impacting market growth?
Limitations Across Farm-Level Seed Treatment; Rising Environmental Concerns.
8. Can you provide examples of recent developments in the market?
September 2022: Corteva Agriscience agreed to acquire Symborg Inc., which will strengthen Symborg's global presence with a strong distribution network of Corteva Agriscience.July 2022: A new granular inoculant called LALFIX® START SPHERICAL Granule was launched, which combines Bacillus velezensis, a plant growth-promoting microbe, with two distinct rhizobium strains. This powerful and well-tested PGPM boosts phosphorus solubilization and improves root mass.January 2022: Novozymes and AgroFresh formed a partnership to utilize the potential of biotechnology to continue improving post-harvest quality and reduce food waste. The company's intention was to satisfy increasing consumer demand for fruits and vegetables with less food waste and less impact on the environment.
9. What pricing options are available for accessing the report?
Pricing options include single-user, multi-user, and enterprise licenses priced at USD 3800, USD 4500, and USD 5800 respectively.
10. Is the market size provided in terms of value or volume?
The market size is provided in terms of value, measured in Million.
11. Are there any specific market keywords associated with the report?
Yes, the market keyword associated with the report is "U.S. Bio-Fertilizer Industry," which aids in identifying and referencing the specific market segment covered.
12. How do I determine which pricing option suits my needs best?
The pricing options vary based on user requirements and access needs. Individual users may opt for single-user licenses, while businesses requiring broader access may choose multi-user or enterprise licenses for cost-effective access to the report.
13. Are there any additional resources or data provided in the U.S. Bio-Fertilizer Industry report?
While the report offers comprehensive insights, it's advisable to review the specific contents or supplementary materials provided to ascertain if additional resources or data are available.
14. How can I stay updated on further developments or reports in the U.S. Bio-Fertilizer Industry?
To stay informed about further developments, trends, and reports in the U.S. Bio-Fertilizer Industry, consider subscribing to industry newsletters, following relevant companies and organizations, or regularly checking reputable industry news sources and publications.
Methodology
Step 1 - Identification of Relevant Samples Size from Population Database


Step 2 - Approaches for Defining Global Market Size (Value, Volume* & Price*)

Note*: In applicable scenarios
Step 3 - Data Sources
Primary Research
- Web Analytics
- Survey Reports
- Research Institute
- Latest Research Reports
- Opinion Leaders
Secondary Research
- Annual Reports
- White Paper
- Latest Press Release
- Industry Association
- Paid Database
- Investor Presentations

Step 4 - Data Triangulation
Involves using different sources of information in order to increase the validity of a study
These sources are likely to be stakeholders in a program - participants, other researchers, program staff, other community members, and so on.
Then we put all data in single framework & apply various statistical tools to find out the dynamic on the market.
During the analysis stage, feedback from the stakeholder groups would be compared to determine areas of agreement as well as areas of divergence


