
Key Insights
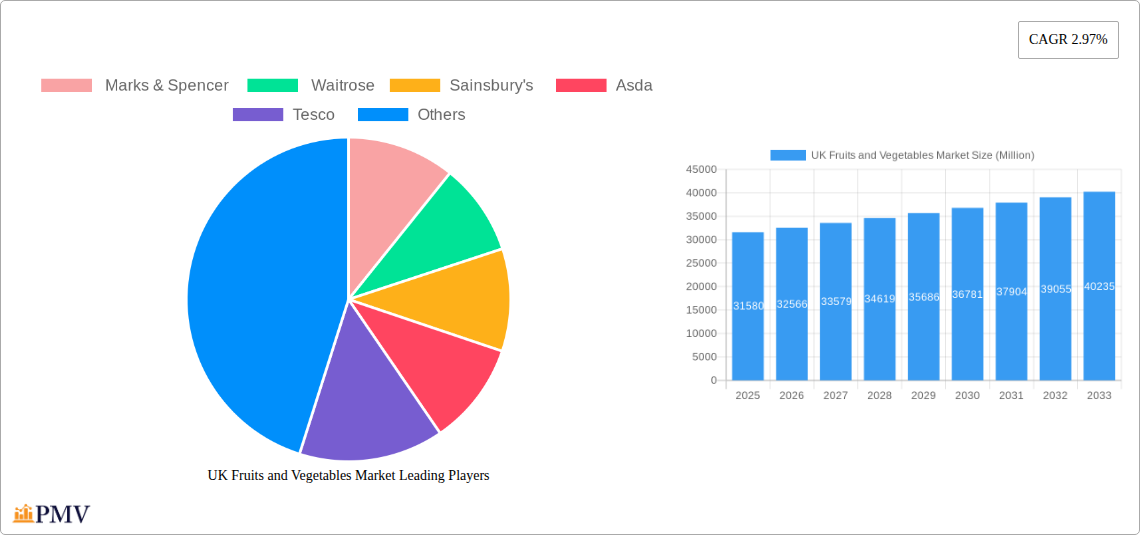
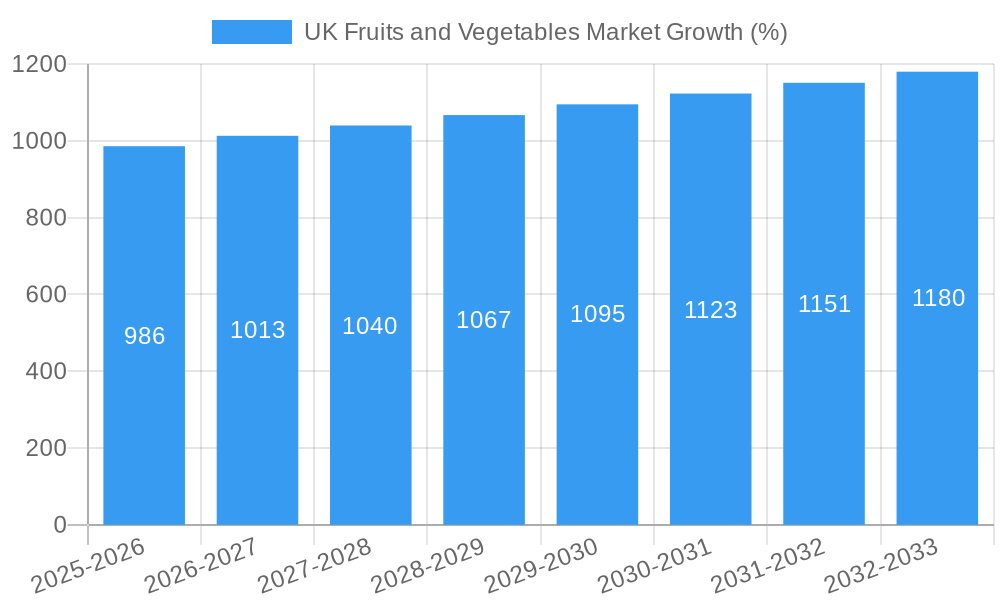
The UK fruits and vegetables market, valued at £31.58 billion in 2025, is projected to experience steady growth, driven by increasing health consciousness among consumers, rising disposable incomes, and a growing preference for fresh produce. The market's Compound Annual Growth Rate (CAGR) of 2.97% from 2025 to 2033 indicates a consistent expansion, although this rate might fluctuate slightly year-on-year based on factors such as weather patterns impacting yields and economic conditions influencing consumer spending. Key segments within the market, fruits and vegetables, exhibit similar growth trajectories, with consumption and import volumes expected to increase moderately. The increasing demand for organic and sustainably sourced produce is a significant trend, impacting both production and retail strategies. Major supermarket chains like Tesco, Sainsbury's, Asda, Waitrose, and Marks & Spencer play a crucial role in market distribution, shaping consumer access and influencing price trends. Competition within the retail landscape remains intense, driving innovation in supply chains and product offerings. While challenges like fluctuating import costs and potential disruptions to supply chains due to geopolitical events may exist, the overall market outlook remains positive due to sustained consumer demand.
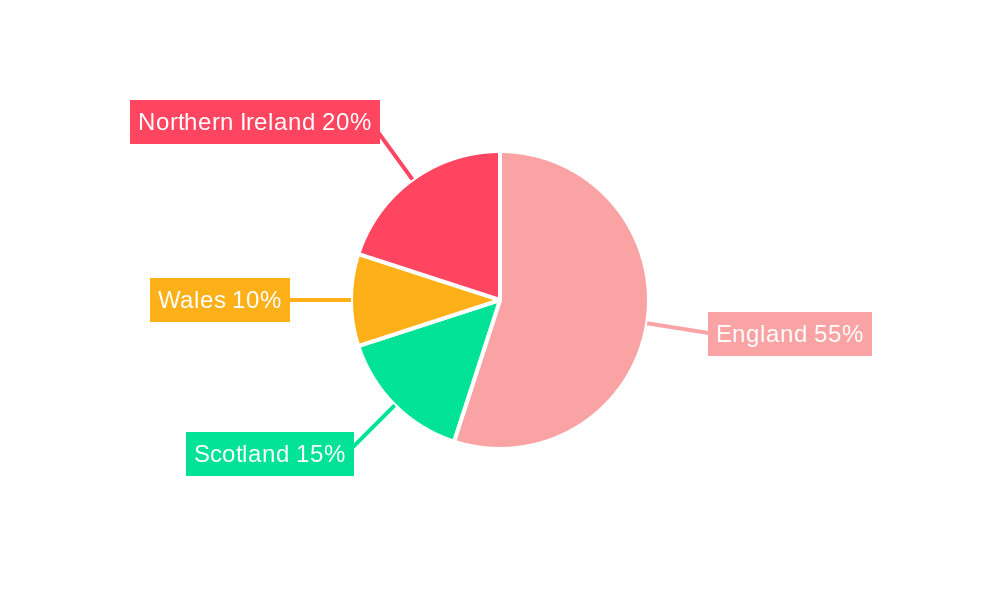
The regional distribution across England, Wales, Scotland, and Northern Ireland reflects population density and consumption patterns. While specific regional data is not provided, it's reasonable to assume that larger populations in England will contribute a larger share of market revenue compared to other regions. Price trends are expected to remain relatively stable, with minor fluctuations influenced by seasonal availability, global commodity prices, and import/export dynamics. The market's future growth will likely be shaped by consumer demand for convenience, innovative packaging, and ethically sourced produce. Furthermore, the increasing focus on reducing food waste across the supply chain presents both a challenge and an opportunity for market participants to optimize their operations and contribute to sustainability goals.
UK Fruits and Vegetables Market: A Comprehensive Report (2019-2033)
This detailed report provides a comprehensive analysis of the UK fruits and vegetables market, offering invaluable insights for businesses, investors, and industry stakeholders. Covering the period 2019-2033, with a base year of 2025 and a forecast period of 2025-2033, this report unravels the market's dynamics, growth drivers, and challenges. The report leverages rigorous data analysis to present a holistic view, including production, consumption, import/export analysis, price trends, and competitive landscapes, segmented across fruits and vegetables.
UK Fruits and Vegetables Market Structure & Competitive Dynamics
The UK fruits and vegetables market exhibits a moderately concentrated structure, with large supermarket chains like Tesco, Tesco, Sainsbury's, Asda, and Waitrose holding significant market share. Marks & Spencer also plays a considerable role, particularly in the premium segment. Market share fluctuations are influenced by pricing strategies, promotional activities, and brand loyalty. The estimated market share of Tesco in 2025 is xx%, followed by Sainsbury's at xx%, Asda at xx%, Waitrose at xx%, and Marks & Spencer at xx%. The innovation ecosystem is characterized by ongoing investments in supply chain optimization, sustainable farming practices, and extended shelf-life technologies. Regulatory frameworks, including food safety standards and labeling regulations, significantly impact market operations. Product substitutes, such as processed foods and imported alternatives, exert competitive pressure. End-user trends towards healthier diets and convenience drive market growth. M&A activity in the sector has been relatively modest in recent years, with deal values averaging approximately £xx Million annually during the historical period (2019-2024).
UK Fruits and Vegetables Market Industry Trends & Insights
The UK fruits and vegetables market demonstrates robust growth, driven by increasing consumer awareness of health and wellness, a rising preference for fresh produce, and the expanding retail landscape. The market's Compound Annual Growth Rate (CAGR) during the historical period (2019-2024) was approximately xx%, while the projected CAGR for the forecast period (2025-2033) is xx%. This growth is fueled by several factors: increasing disposable incomes, changing consumer lifestyles, and rising demand for convenient, ready-to-eat options. Technological disruptions, including advancements in precision agriculture and supply chain management technologies, are enhancing efficiency and sustainability. Consumer preferences are shifting towards locally sourced, organic, and ethically produced fruits and vegetables, impacting market segmentation and pricing. Competitive dynamics are marked by intense rivalry among major retailers, particularly in pricing and promotional strategies. Market penetration of organic produce continues to rise, with an estimated xx% market share in 2025.
Dominant Markets & Segments in UK Fruits and Vegetables Market
- Fruits: Consumption of apples, bananas, and berries dominates the fruit segment, contributing to the largest volume and value share. Importantly, the UK is a net importer of fruits, with significant volumes arriving from Spain, the Netherlands, and South Africa. Price trends show seasonal fluctuations, with peak prices observed during the winter months. The high consumption of apples and bananas can be attributed to their year-round availability and affordability. The high import volume of fruits reflects the UK's inability to produce these fruits domestically in large quantities and/or at low costs. This reflects the UK’s climate and import reliance.
- Vegetables: Potatoes, onions, and carrots constitute a substantial portion of the vegetable market. Consumption patterns reveal high demand for convenient forms such as pre-cut vegetables and ready-to-eat salads. While the UK produces a significant volume of vegetables domestically, there's considerable import of specialty vegetables and those out of season. Price trends show similar seasonal variations, influenced by weather conditions and supply chain efficiencies.
Key Drivers: The UK's strong retail infrastructure, supportive economic policies (e.g., farm subsidies), and advancements in agricultural technologies contribute to market dominance.
UK Fruits and Vegetables Market Product Innovations
Recent innovations focus on extending the shelf life of fresh produce through advanced packaging and preservation techniques. The market is also witnessing a rise in value-added products, such as pre-cut vegetables, ready-to-eat salads, and fruit-based snacks. These innovations cater to consumer demand for convenience and time-saving options, enhancing product appeal and driving market growth. Technological trends like blockchain are improving supply chain transparency, enhancing consumer trust, and improving traceability.
Report Segmentation & Scope
This report segments the UK fruits and vegetables market across multiple dimensions: By type (fruits and vegetables), by product (specific fruits and vegetables), by distribution channel (retail, wholesale, food service), by region (England, Scotland, Wales, Northern Ireland). Each segment's growth projections, market size (in Million GBP), and competitive dynamics are analyzed comprehensively. The report examines production, consumption, import, and export volumes and values for each segment, providing a granular understanding of the market's structure.
Key Drivers of UK Fruits and Vegetables Market Growth
Several factors fuel the market's growth: increasing health consciousness among consumers, growing demand for convenient and ready-to-eat options, advancements in agricultural technologies leading to increased yields and improved quality, supportive government policies promoting sustainable agriculture, and robust retail infrastructure ensuring efficient distribution.
Challenges in the UK Fruits and Vegetables Market Sector
The sector faces challenges such as fluctuating global prices, seasonal variations in supply and demand, the environmental impact of intensive farming, and competition from imported produce. Supply chain disruptions, exacerbated by Brexit, and regulatory hurdles relating to food safety and sustainability standards also impact market stability. These challenges have led to price volatility and increased costs in recent years.
Leading Players in the UK Fruits and Vegetables Market Market
- Marks & Spencer
- Waitrose
- Sainsbury's
- Asda
- Tesco
Key Developments in UK Fruits and Vegetables Market Sector
- 2022-Q4: Tesco launched a new range of sustainably sourced vegetables.
- 2023-Q1: Sainsbury's invested in improved supply chain technology.
- 2023-Q2: A significant merger between two smaller produce suppliers was announced, consolidating market share.
Strategic UK Fruits and Vegetables Market Outlook
The UK fruits and vegetables market presents substantial growth opportunities. Focus on sustainable agriculture, technological innovation, and meeting evolving consumer preferences (e.g., organic, locally sourced products) will be key to success. The market offers attractive potential for companies specializing in value-added products, convenient formats, and premium offerings. Investing in supply chain resilience and tackling challenges like labor shortages and climate change will be crucial for long-term growth and profitability.
UK Fruits and Vegetables Market Segmentation
-
1. Fruits
- 1.1. Production Analysis (Volume)
- 1.2. Consumption Analysis (Volume and Value)
- 1.3. Import Analysis (Volume and Value)
- 1.4. Export Analysis (Volume and Value)
- 1.5. Price Trend Analysis
-
2. Vegetables
- 2.1. Production Analysis (Volume)
- 2.2. Consumption Analysis (Volume and Value)
- 2.3. Import Analysis (Volume and Value)
- 2.4. Export Analysis (Volume and Value)
- 2.5. Price Trend Analysis
-
3. Fruits
- 3.1. Production Analysis (Volume)
- 3.2. Consumption Analysis (Volume and Value)
- 3.3. Import Analysis (Volume and Value)
- 3.4. Export Analysis (Volume and Value)
- 3.5. Price Trend Analysis
-
4. Vegetables
- 4.1. Production Analysis (Volume)
- 4.2. Consumption Analysis (Volume and Value)
- 4.3. Import Analysis (Volume and Value)
- 4.4. Export Analysis (Volume and Value)
- 4.5. Price Trend Analysis
UK Fruits and Vegetables Market Segmentation By Geography
-
1. North America
- 1.1. United States
- 1.2. Canada
- 1.3. Mexico
-
2. South America
- 2.1. Brazil
- 2.2. Argentina
- 2.3. Rest of South America
-
3. Europe
- 3.1. United Kingdom
- 3.2. Germany
- 3.3. France
- 3.4. Italy
- 3.5. Spain
- 3.6. Russia
- 3.7. Benelux
- 3.8. Nordics
- 3.9. Rest of Europe
-
4. Middle East & Africa
- 4.1. Turkey
- 4.2. Israel
- 4.3. GCC
- 4.4. North Africa
- 4.5. South Africa
- 4.6. Rest of Middle East & Africa
-
5. Asia Pacific
- 5.1. China
- 5.2. India
- 5.3. Japan
- 5.4. South Korea
- 5.5. ASEAN
- 5.6. Oceania
- 5.7. Rest of Asia Pacific
UK Fruits and Vegetables Market REPORT HIGHLIGHTS
| Aspects | Details |
|---|---|
| Study Period | 2019-2033 |
| Base Year | 2024 |
| Estimated Year | 2025 |
| Forecast Period | 2025-2033 |
| Historical Period | 2019-2024 |
| Growth Rate | CAGR of 2.97% from 2019-2033 |
| Segmentation |
|
Table of Contents
- 1. Introduction
- 1.1. Research Scope
- 1.2. Market Segmentation
- 1.3. Research Methodology
- 1.4. Definitions and Assumptions
- 2. Executive Summary
- 2.1. Introduction
- 3. Market Dynamics
- 3.1. Introduction
- 3.2. Market Drivers
- 3.2.1. ; Awareness About Health Benefits Associated With Pecan Consumption; Wide Application of Pecan
- 3.3. Market Restrains
- 3.3.1. ; Volatility in the Prices; Adverse Weather Conditions Affecting Yield
- 3.4. Market Trends
- 3.4.1. Increasing Area Under Cultivation
- 4. Market Factor Analysis
- 4.1. Porters Five Forces
- 4.2. Supply/Value Chain
- 4.3. PESTEL analysis
- 4.4. Market Entropy
- 4.5. Patent/Trademark Analysis
- 5. Global UK Fruits and Vegetables Market Analysis, Insights and Forecast, 2019-2031
- 5.1. Market Analysis, Insights and Forecast - by Fruits
- 5.1.1. Production Analysis (Volume)
- 5.1.2. Consumption Analysis (Volume and Value)
- 5.1.3. Import Analysis (Volume and Value)
- 5.1.4. Export Analysis (Volume and Value)
- 5.1.5. Price Trend Analysis
- 5.2. Market Analysis, Insights and Forecast - by Vegetables
- 5.2.1. Production Analysis (Volume)
- 5.2.2. Consumption Analysis (Volume and Value)
- 5.2.3. Import Analysis (Volume and Value)
- 5.2.4. Export Analysis (Volume and Value)
- 5.2.5. Price Trend Analysis
- 5.3. Market Analysis, Insights and Forecast - by Fruits
- 5.3.1. Production Analysis (Volume)
- 5.3.2. Consumption Analysis (Volume and Value)
- 5.3.3. Import Analysis (Volume and Value)
- 5.3.4. Export Analysis (Volume and Value)
- 5.3.5. Price Trend Analysis
- 5.4. Market Analysis, Insights and Forecast - by Vegetables
- 5.4.1. Production Analysis (Volume)
- 5.4.2. Consumption Analysis (Volume and Value)
- 5.4.3. Import Analysis (Volume and Value)
- 5.4.4. Export Analysis (Volume and Value)
- 5.4.5. Price Trend Analysis
- 5.5. Market Analysis, Insights and Forecast - by Region
- 5.5.1. North America
- 5.5.2. South America
- 5.5.3. Europe
- 5.5.4. Middle East & Africa
- 5.5.5. Asia Pacific
- 5.1. Market Analysis, Insights and Forecast - by Fruits
- 6. North America UK Fruits and Vegetables Market Analysis, Insights and Forecast, 2019-2031
- 6.1. Market Analysis, Insights and Forecast - by Fruits
- 6.1.1. Production Analysis (Volume)
- 6.1.2. Consumption Analysis (Volume and Value)
- 6.1.3. Import Analysis (Volume and Value)
- 6.1.4. Export Analysis (Volume and Value)
- 6.1.5. Price Trend Analysis
- 6.2. Market Analysis, Insights and Forecast - by Vegetables
- 6.2.1. Production Analysis (Volume)
- 6.2.2. Consumption Analysis (Volume and Value)
- 6.2.3. Import Analysis (Volume and Value)
- 6.2.4. Export Analysis (Volume and Value)
- 6.2.5. Price Trend Analysis
- 6.3. Market Analysis, Insights and Forecast - by Fruits
- 6.3.1. Production Analysis (Volume)
- 6.3.2. Consumption Analysis (Volume and Value)
- 6.3.3. Import Analysis (Volume and Value)
- 6.3.4. Export Analysis (Volume and Value)
- 6.3.5. Price Trend Analysis
- 6.4. Market Analysis, Insights and Forecast - by Vegetables
- 6.4.1. Production Analysis (Volume)
- 6.4.2. Consumption Analysis (Volume and Value)
- 6.4.3. Import Analysis (Volume and Value)
- 6.4.4. Export Analysis (Volume and Value)
- 6.4.5. Price Trend Analysis
- 6.1. Market Analysis, Insights and Forecast - by Fruits
- 7. South America UK Fruits and Vegetables Market Analysis, Insights and Forecast, 2019-2031
- 7.1. Market Analysis, Insights and Forecast - by Fruits
- 7.1.1. Production Analysis (Volume)
- 7.1.2. Consumption Analysis (Volume and Value)
- 7.1.3. Import Analysis (Volume and Value)
- 7.1.4. Export Analysis (Volume and Value)
- 7.1.5. Price Trend Analysis
- 7.2. Market Analysis, Insights and Forecast - by Vegetables
- 7.2.1. Production Analysis (Volume)
- 7.2.2. Consumption Analysis (Volume and Value)
- 7.2.3. Import Analysis (Volume and Value)
- 7.2.4. Export Analysis (Volume and Value)
- 7.2.5. Price Trend Analysis
- 7.3. Market Analysis, Insights and Forecast - by Fruits
- 7.3.1. Production Analysis (Volume)
- 7.3.2. Consumption Analysis (Volume and Value)
- 7.3.3. Import Analysis (Volume and Value)
- 7.3.4. Export Analysis (Volume and Value)
- 7.3.5. Price Trend Analysis
- 7.4. Market Analysis, Insights and Forecast - by Vegetables
- 7.4.1. Production Analysis (Volume)
- 7.4.2. Consumption Analysis (Volume and Value)
- 7.4.3. Import Analysis (Volume and Value)
- 7.4.4. Export Analysis (Volume and Value)
- 7.4.5. Price Trend Analysis
- 7.1. Market Analysis, Insights and Forecast - by Fruits
- 8. Europe UK Fruits and Vegetables Market Analysis, Insights and Forecast, 2019-2031
- 8.1. Market Analysis, Insights and Forecast - by Fruits
- 8.1.1. Production Analysis (Volume)
- 8.1.2. Consumption Analysis (Volume and Value)
- 8.1.3. Import Analysis (Volume and Value)
- 8.1.4. Export Analysis (Volume and Value)
- 8.1.5. Price Trend Analysis
- 8.2. Market Analysis, Insights and Forecast - by Vegetables
- 8.2.1. Production Analysis (Volume)
- 8.2.2. Consumption Analysis (Volume and Value)
- 8.2.3. Import Analysis (Volume and Value)
- 8.2.4. Export Analysis (Volume and Value)
- 8.2.5. Price Trend Analysis
- 8.3. Market Analysis, Insights and Forecast - by Fruits
- 8.3.1. Production Analysis (Volume)
- 8.3.2. Consumption Analysis (Volume and Value)
- 8.3.3. Import Analysis (Volume and Value)
- 8.3.4. Export Analysis (Volume and Value)
- 8.3.5. Price Trend Analysis
- 8.4. Market Analysis, Insights and Forecast - by Vegetables
- 8.4.1. Production Analysis (Volume)
- 8.4.2. Consumption Analysis (Volume and Value)
- 8.4.3. Import Analysis (Volume and Value)
- 8.4.4. Export Analysis (Volume and Value)
- 8.4.5. Price Trend Analysis
- 8.1. Market Analysis, Insights and Forecast - by Fruits
- 9. Middle East & Africa UK Fruits and Vegetables Market Analysis, Insights and Forecast, 2019-2031
- 9.1. Market Analysis, Insights and Forecast - by Fruits
- 9.1.1. Production Analysis (Volume)
- 9.1.2. Consumption Analysis (Volume and Value)
- 9.1.3. Import Analysis (Volume and Value)
- 9.1.4. Export Analysis (Volume and Value)
- 9.1.5. Price Trend Analysis
- 9.2. Market Analysis, Insights and Forecast - by Vegetables
- 9.2.1. Production Analysis (Volume)
- 9.2.2. Consumption Analysis (Volume and Value)
- 9.2.3. Import Analysis (Volume and Value)
- 9.2.4. Export Analysis (Volume and Value)
- 9.2.5. Price Trend Analysis
- 9.3. Market Analysis, Insights and Forecast - by Fruits
- 9.3.1. Production Analysis (Volume)
- 9.3.2. Consumption Analysis (Volume and Value)
- 9.3.3. Import Analysis (Volume and Value)
- 9.3.4. Export Analysis (Volume and Value)
- 9.3.5. Price Trend Analysis
- 9.4. Market Analysis, Insights and Forecast - by Vegetables
- 9.4.1. Production Analysis (Volume)
- 9.4.2. Consumption Analysis (Volume and Value)
- 9.4.3. Import Analysis (Volume and Value)
- 9.4.4. Export Analysis (Volume and Value)
- 9.4.5. Price Trend Analysis
- 9.1. Market Analysis, Insights and Forecast - by Fruits
- 10. Asia Pacific UK Fruits and Vegetables Market Analysis, Insights and Forecast, 2019-2031
- 10.1. Market Analysis, Insights and Forecast - by Fruits
- 10.1.1. Production Analysis (Volume)
- 10.1.2. Consumption Analysis (Volume and Value)
- 10.1.3. Import Analysis (Volume and Value)
- 10.1.4. Export Analysis (Volume and Value)
- 10.1.5. Price Trend Analysis
- 10.2. Market Analysis, Insights and Forecast - by Vegetables
- 10.2.1. Production Analysis (Volume)
- 10.2.2. Consumption Analysis (Volume and Value)
- 10.2.3. Import Analysis (Volume and Value)
- 10.2.4. Export Analysis (Volume and Value)
- 10.2.5. Price Trend Analysis
- 10.3. Market Analysis, Insights and Forecast - by Fruits
- 10.3.1. Production Analysis (Volume)
- 10.3.2. Consumption Analysis (Volume and Value)
- 10.3.3. Import Analysis (Volume and Value)
- 10.3.4. Export Analysis (Volume and Value)
- 10.3.5. Price Trend Analysis
- 10.4. Market Analysis, Insights and Forecast - by Vegetables
- 10.4.1. Production Analysis (Volume)
- 10.4.2. Consumption Analysis (Volume and Value)
- 10.4.3. Import Analysis (Volume and Value)
- 10.4.4. Export Analysis (Volume and Value)
- 10.4.5. Price Trend Analysis
- 10.1. Market Analysis, Insights and Forecast - by Fruits
- 11. England UK Fruits and Vegetables Market Analysis, Insights and Forecast, 2019-2031
- 12. Wales UK Fruits and Vegetables Market Analysis, Insights and Forecast, 2019-2031
- 13. Scotland UK Fruits and Vegetables Market Analysis, Insights and Forecast, 2019-2031
- 14. Northern UK Fruits and Vegetables Market Analysis, Insights and Forecast, 2019-2031
- 15. Ireland UK Fruits and Vegetables Market Analysis, Insights and Forecast, 2019-2031
- 16. Competitive Analysis
- 16.1. Global Market Share Analysis 2024
- 16.2. Company Profiles
- 16.2.1 Marks & Spencer
- 16.2.1.1. Overview
- 16.2.1.2. Products
- 16.2.1.3. SWOT Analysis
- 16.2.1.4. Recent Developments
- 16.2.1.5. Financials (Based on Availability)
- 16.2.2 Waitrose
- 16.2.2.1. Overview
- 16.2.2.2. Products
- 16.2.2.3. SWOT Analysis
- 16.2.2.4. Recent Developments
- 16.2.2.5. Financials (Based on Availability)
- 16.2.3 Sainsbury's
- 16.2.3.1. Overview
- 16.2.3.2. Products
- 16.2.3.3. SWOT Analysis
- 16.2.3.4. Recent Developments
- 16.2.3.5. Financials (Based on Availability)
- 16.2.4 Asda
- 16.2.4.1. Overview
- 16.2.4.2. Products
- 16.2.4.3. SWOT Analysis
- 16.2.4.4. Recent Developments
- 16.2.4.5. Financials (Based on Availability)
- 16.2.5 Tesco
- 16.2.5.1. Overview
- 16.2.5.2. Products
- 16.2.5.3. SWOT Analysis
- 16.2.5.4. Recent Developments
- 16.2.5.5. Financials (Based on Availability)
- 16.2.1 Marks & Spencer
List of Figures
- Figure 1: Global UK Fruits and Vegetables Market Revenue Breakdown (Million, %) by Region 2024 & 2032
- Figure 2: Global UK Fruits and Vegetables Market Volume Breakdown (Kiloton, %) by Region 2024 & 2032
- Figure 3: United kingdom Region UK Fruits and Vegetables Market Revenue (Million), by Country 2024 & 2032
- Figure 4: United kingdom Region UK Fruits and Vegetables Market Volume (Kiloton), by Country 2024 & 2032
- Figure 5: United kingdom Region UK Fruits and Vegetables Market Revenue Share (%), by Country 2024 & 2032
- Figure 6: United kingdom Region UK Fruits and Vegetables Market Volume Share (%), by Country 2024 & 2032
- Figure 7: North America UK Fruits and Vegetables Market Revenue (Million), by Fruits 2024 & 2032
- Figure 8: North America UK Fruits and Vegetables Market Volume (Kiloton), by Fruits 2024 & 2032
- Figure 9: North America UK Fruits and Vegetables Market Revenue Share (%), by Fruits 2024 & 2032
- Figure 10: North America UK Fruits and Vegetables Market Volume Share (%), by Fruits 2024 & 2032
- Figure 11: North America UK Fruits and Vegetables Market Revenue (Million), by Vegetables 2024 & 2032
- Figure 12: North America UK Fruits and Vegetables Market Volume (Kiloton), by Vegetables 2024 & 2032
- Figure 13: North America UK Fruits and Vegetables Market Revenue Share (%), by Vegetables 2024 & 2032
- Figure 14: North America UK Fruits and Vegetables Market Volume Share (%), by Vegetables 2024 & 2032
- Figure 15: North America UK Fruits and Vegetables Market Revenue (Million), by Fruits 2024 & 2032
- Figure 16: North America UK Fruits and Vegetables Market Volume (Kiloton), by Fruits 2024 & 2032
- Figure 17: North America UK Fruits and Vegetables Market Revenue Share (%), by Fruits 2024 & 2032
- Figure 18: North America UK Fruits and Vegetables Market Volume Share (%), by Fruits 2024 & 2032
- Figure 19: North America UK Fruits and Vegetables Market Revenue (Million), by Vegetables 2024 & 2032
- Figure 20: North America UK Fruits and Vegetables Market Volume (Kiloton), by Vegetables 2024 & 2032
- Figure 21: North America UK Fruits and Vegetables Market Revenue Share (%), by Vegetables 2024 & 2032
- Figure 22: North America UK Fruits and Vegetables Market Volume Share (%), by Vegetables 2024 & 2032
- Figure 23: North America UK Fruits and Vegetables Market Revenue (Million), by Country 2024 & 2032
- Figure 24: North America UK Fruits and Vegetables Market Volume (Kiloton), by Country 2024 & 2032
- Figure 25: North America UK Fruits and Vegetables Market Revenue Share (%), by Country 2024 & 2032
- Figure 26: North America UK Fruits and Vegetables Market Volume Share (%), by Country 2024 & 2032
- Figure 27: South America UK Fruits and Vegetables Market Revenue (Million), by Fruits 2024 & 2032
- Figure 28: South America UK Fruits and Vegetables Market Volume (Kiloton), by Fruits 2024 & 2032
- Figure 29: South America UK Fruits and Vegetables Market Revenue Share (%), by Fruits 2024 & 2032
- Figure 30: South America UK Fruits and Vegetables Market Volume Share (%), by Fruits 2024 & 2032
- Figure 31: South America UK Fruits and Vegetables Market Revenue (Million), by Vegetables 2024 & 2032
- Figure 32: South America UK Fruits and Vegetables Market Volume (Kiloton), by Vegetables 2024 & 2032
- Figure 33: South America UK Fruits and Vegetables Market Revenue Share (%), by Vegetables 2024 & 2032
- Figure 34: South America UK Fruits and Vegetables Market Volume Share (%), by Vegetables 2024 & 2032
- Figure 35: South America UK Fruits and Vegetables Market Revenue (Million), by Fruits 2024 & 2032
- Figure 36: South America UK Fruits and Vegetables Market Volume (Kiloton), by Fruits 2024 & 2032
- Figure 37: South America UK Fruits and Vegetables Market Revenue Share (%), by Fruits 2024 & 2032
- Figure 38: South America UK Fruits and Vegetables Market Volume Share (%), by Fruits 2024 & 2032
- Figure 39: South America UK Fruits and Vegetables Market Revenue (Million), by Vegetables 2024 & 2032
- Figure 40: South America UK Fruits and Vegetables Market Volume (Kiloton), by Vegetables 2024 & 2032
- Figure 41: South America UK Fruits and Vegetables Market Revenue Share (%), by Vegetables 2024 & 2032
- Figure 42: South America UK Fruits and Vegetables Market Volume Share (%), by Vegetables 2024 & 2032
- Figure 43: South America UK Fruits and Vegetables Market Revenue (Million), by Country 2024 & 2032
- Figure 44: South America UK Fruits and Vegetables Market Volume (Kiloton), by Country 2024 & 2032
- Figure 45: South America UK Fruits and Vegetables Market Revenue Share (%), by Country 2024 & 2032
- Figure 46: South America UK Fruits and Vegetables Market Volume Share (%), by Country 2024 & 2032
- Figure 47: Europe UK Fruits and Vegetables Market Revenue (Million), by Fruits 2024 & 2032
- Figure 48: Europe UK Fruits and Vegetables Market Volume (Kiloton), by Fruits 2024 & 2032
- Figure 49: Europe UK Fruits and Vegetables Market Revenue Share (%), by Fruits 2024 & 2032
- Figure 50: Europe UK Fruits and Vegetables Market Volume Share (%), by Fruits 2024 & 2032
- Figure 51: Europe UK Fruits and Vegetables Market Revenue (Million), by Vegetables 2024 & 2032
- Figure 52: Europe UK Fruits and Vegetables Market Volume (Kiloton), by Vegetables 2024 & 2032
- Figure 53: Europe UK Fruits and Vegetables Market Revenue Share (%), by Vegetables 2024 & 2032
- Figure 54: Europe UK Fruits and Vegetables Market Volume Share (%), by Vegetables 2024 & 2032
- Figure 55: Europe UK Fruits and Vegetables Market Revenue (Million), by Fruits 2024 & 2032
- Figure 56: Europe UK Fruits and Vegetables Market Volume (Kiloton), by Fruits 2024 & 2032
- Figure 57: Europe UK Fruits and Vegetables Market Revenue Share (%), by Fruits 2024 & 2032
- Figure 58: Europe UK Fruits and Vegetables Market Volume Share (%), by Fruits 2024 & 2032
- Figure 59: Europe UK Fruits and Vegetables Market Revenue (Million), by Vegetables 2024 & 2032
- Figure 60: Europe UK Fruits and Vegetables Market Volume (Kiloton), by Vegetables 2024 & 2032
- Figure 61: Europe UK Fruits and Vegetables Market Revenue Share (%), by Vegetables 2024 & 2032
- Figure 62: Europe UK Fruits and Vegetables Market Volume Share (%), by Vegetables 2024 & 2032
- Figure 63: Europe UK Fruits and Vegetables Market Revenue (Million), by Country 2024 & 2032
- Figure 64: Europe UK Fruits and Vegetables Market Volume (Kiloton), by Country 2024 & 2032
- Figure 65: Europe UK Fruits and Vegetables Market Revenue Share (%), by Country 2024 & 2032
- Figure 66: Europe UK Fruits and Vegetables Market Volume Share (%), by Country 2024 & 2032
- Figure 67: Middle East & Africa UK Fruits and Vegetables Market Revenue (Million), by Fruits 2024 & 2032
- Figure 68: Middle East & Africa UK Fruits and Vegetables Market Volume (Kiloton), by Fruits 2024 & 2032
- Figure 69: Middle East & Africa UK Fruits and Vegetables Market Revenue Share (%), by Fruits 2024 & 2032
- Figure 70: Middle East & Africa UK Fruits and Vegetables Market Volume Share (%), by Fruits 2024 & 2032
- Figure 71: Middle East & Africa UK Fruits and Vegetables Market Revenue (Million), by Vegetables 2024 & 2032
- Figure 72: Middle East & Africa UK Fruits and Vegetables Market Volume (Kiloton), by Vegetables 2024 & 2032
- Figure 73: Middle East & Africa UK Fruits and Vegetables Market Revenue Share (%), by Vegetables 2024 & 2032
- Figure 74: Middle East & Africa UK Fruits and Vegetables Market Volume Share (%), by Vegetables 2024 & 2032
- Figure 75: Middle East & Africa UK Fruits and Vegetables Market Revenue (Million), by Fruits 2024 & 2032
- Figure 76: Middle East & Africa UK Fruits and Vegetables Market Volume (Kiloton), by Fruits 2024 & 2032
- Figure 77: Middle East & Africa UK Fruits and Vegetables Market Revenue Share (%), by Fruits 2024 & 2032
- Figure 78: Middle East & Africa UK Fruits and Vegetables Market Volume Share (%), by Fruits 2024 & 2032
- Figure 79: Middle East & Africa UK Fruits and Vegetables Market Revenue (Million), by Vegetables 2024 & 2032
- Figure 80: Middle East & Africa UK Fruits and Vegetables Market Volume (Kiloton), by Vegetables 2024 & 2032
- Figure 81: Middle East & Africa UK Fruits and Vegetables Market Revenue Share (%), by Vegetables 2024 & 2032
- Figure 82: Middle East & Africa UK Fruits and Vegetables Market Volume Share (%), by Vegetables 2024 & 2032
- Figure 83: Middle East & Africa UK Fruits and Vegetables Market Revenue (Million), by Country 2024 & 2032
- Figure 84: Middle East & Africa UK Fruits and Vegetables Market Volume (Kiloton), by Country 2024 & 2032
- Figure 85: Middle East & Africa UK Fruits and Vegetables Market Revenue Share (%), by Country 2024 & 2032
- Figure 86: Middle East & Africa UK Fruits and Vegetables Market Volume Share (%), by Country 2024 & 2032
- Figure 87: Asia Pacific UK Fruits and Vegetables Market Revenue (Million), by Fruits 2024 & 2032
- Figure 88: Asia Pacific UK Fruits and Vegetables Market Volume (Kiloton), by Fruits 2024 & 2032
- Figure 89: Asia Pacific UK Fruits and Vegetables Market Revenue Share (%), by Fruits 2024 & 2032
- Figure 90: Asia Pacific UK Fruits and Vegetables Market Volume Share (%), by Fruits 2024 & 2032
- Figure 91: Asia Pacific UK Fruits and Vegetables Market Revenue (Million), by Vegetables 2024 & 2032
- Figure 92: Asia Pacific UK Fruits and Vegetables Market Volume (Kiloton), by Vegetables 2024 & 2032
- Figure 93: Asia Pacific UK Fruits and Vegetables Market Revenue Share (%), by Vegetables 2024 & 2032
- Figure 94: Asia Pacific UK Fruits and Vegetables Market Volume Share (%), by Vegetables 2024 & 2032
- Figure 95: Asia Pacific UK Fruits and Vegetables Market Revenue (Million), by Fruits 2024 & 2032
- Figure 96: Asia Pacific UK Fruits and Vegetables Market Volume (Kiloton), by Fruits 2024 & 2032
- Figure 97: Asia Pacific UK Fruits and Vegetables Market Revenue Share (%), by Fruits 2024 & 2032
- Figure 98: Asia Pacific UK Fruits and Vegetables Market Volume Share (%), by Fruits 2024 & 2032
- Figure 99: Asia Pacific UK Fruits and Vegetables Market Revenue (Million), by Vegetables 2024 & 2032
- Figure 100: Asia Pacific UK Fruits and Vegetables Market Volume (Kiloton), by Vegetables 2024 & 2032
- Figure 101: Asia Pacific UK Fruits and Vegetables Market Revenue Share (%), by Vegetables 2024 & 2032
- Figure 102: Asia Pacific UK Fruits and Vegetables Market Volume Share (%), by Vegetables 2024 & 2032
- Figure 103: Asia Pacific UK Fruits and Vegetables Market Revenue (Million), by Country 2024 & 2032
- Figure 104: Asia Pacific UK Fruits and Vegetables Market Volume (Kiloton), by Country 2024 & 2032
- Figure 105: Asia Pacific UK Fruits and Vegetables Market Revenue Share (%), by Country 2024 & 2032
- Figure 106: Asia Pacific UK Fruits and Vegetables Market Volume Share (%), by Country 2024 & 2032
List of Tables
- Table 1: Global UK Fruits and Vegetables Market Revenue Million Forecast, by Region 2019 & 2032
- Table 2: Global UK Fruits and Vegetables Market Volume Kiloton Forecast, by Region 2019 & 2032
- Table 3: Global UK Fruits and Vegetables Market Revenue Million Forecast, by Fruits 2019 & 2032
- Table 4: Global UK Fruits and Vegetables Market Volume Kiloton Forecast, by Fruits 2019 & 2032
- Table 5: Global UK Fruits and Vegetables Market Revenue Million Forecast, by Vegetables 2019 & 2032
- Table 6: Global UK Fruits and Vegetables Market Volume Kiloton Forecast, by Vegetables 2019 & 2032
- Table 7: Global UK Fruits and Vegetables Market Revenue Million Forecast, by Fruits 2019 & 2032
- Table 8: Global UK Fruits and Vegetables Market Volume Kiloton Forecast, by Fruits 2019 & 2032
- Table 9: Global UK Fruits and Vegetables Market Revenue Million Forecast, by Vegetables 2019 & 2032
- Table 10: Global UK Fruits and Vegetables Market Volume Kiloton Forecast, by Vegetables 2019 & 2032
- Table 11: Global UK Fruits and Vegetables Market Revenue Million Forecast, by Region 2019 & 2032
- Table 12: Global UK Fruits and Vegetables Market Volume Kiloton Forecast, by Region 2019 & 2032
- Table 13: Global UK Fruits and Vegetables Market Revenue Million Forecast, by Country 2019 & 2032
- Table 14: Global UK Fruits and Vegetables Market Volume Kiloton Forecast, by Country 2019 & 2032
- Table 15: England UK Fruits and Vegetables Market Revenue (Million) Forecast, by Application 2019 & 2032
- Table 16: England UK Fruits and Vegetables Market Volume (Kiloton) Forecast, by Application 2019 & 2032
- Table 17: Wales UK Fruits and Vegetables Market Revenue (Million) Forecast, by Application 2019 & 2032
- Table 18: Wales UK Fruits and Vegetables Market Volume (Kiloton) Forecast, by Application 2019 & 2032
- Table 19: Scotland UK Fruits and Vegetables Market Revenue (Million) Forecast, by Application 2019 & 2032
- Table 20: Scotland UK Fruits and Vegetables Market Volume (Kiloton) Forecast, by Application 2019 & 2032
- Table 21: Northern UK Fruits and Vegetables Market Revenue (Million) Forecast, by Application 2019 & 2032
- Table 22: Northern UK Fruits and Vegetables Market Volume (Kiloton) Forecast, by Application 2019 & 2032
- Table 23: Ireland UK Fruits and Vegetables Market Revenue (Million) Forecast, by Application 2019 & 2032
- Table 24: Ireland UK Fruits and Vegetables Market Volume (Kiloton) Forecast, by Application 2019 & 2032
- Table 25: Global UK Fruits and Vegetables Market Revenue Million Forecast, by Fruits 2019 & 2032
- Table 26: Global UK Fruits and Vegetables Market Volume Kiloton Forecast, by Fruits 2019 & 2032
- Table 27: Global UK Fruits and Vegetables Market Revenue Million Forecast, by Vegetables 2019 & 2032
- Table 28: Global UK Fruits and Vegetables Market Volume Kiloton Forecast, by Vegetables 2019 & 2032
- Table 29: Global UK Fruits and Vegetables Market Revenue Million Forecast, by Fruits 2019 & 2032
- Table 30: Global UK Fruits and Vegetables Market Volume Kiloton Forecast, by Fruits 2019 & 2032
- Table 31: Global UK Fruits and Vegetables Market Revenue Million Forecast, by Vegetables 2019 & 2032
- Table 32: Global UK Fruits and Vegetables Market Volume Kiloton Forecast, by Vegetables 2019 & 2032
- Table 33: Global UK Fruits and Vegetables Market Revenue Million Forecast, by Country 2019 & 2032
- Table 34: Global UK Fruits and Vegetables Market Volume Kiloton Forecast, by Country 2019 & 2032
- Table 35: United States UK Fruits and Vegetables Market Revenue (Million) Forecast, by Application 2019 & 2032
- Table 36: United States UK Fruits and Vegetables Market Volume (Kiloton) Forecast, by Application 2019 & 2032
- Table 37: Canada UK Fruits and Vegetables Market Revenue (Million) Forecast, by Application 2019 & 2032
- Table 38: Canada UK Fruits and Vegetables Market Volume (Kiloton) Forecast, by Application 2019 & 2032
- Table 39: Mexico UK Fruits and Vegetables Market Revenue (Million) Forecast, by Application 2019 & 2032
- Table 40: Mexico UK Fruits and Vegetables Market Volume (Kiloton) Forecast, by Application 2019 & 2032
- Table 41: Global UK Fruits and Vegetables Market Revenue Million Forecast, by Fruits 2019 & 2032
- Table 42: Global UK Fruits and Vegetables Market Volume Kiloton Forecast, by Fruits 2019 & 2032
- Table 43: Global UK Fruits and Vegetables Market Revenue Million Forecast, by Vegetables 2019 & 2032
- Table 44: Global UK Fruits and Vegetables Market Volume Kiloton Forecast, by Vegetables 2019 & 2032
- Table 45: Global UK Fruits and Vegetables Market Revenue Million Forecast, by Fruits 2019 & 2032
- Table 46: Global UK Fruits and Vegetables Market Volume Kiloton Forecast, by Fruits 2019 & 2032
- Table 47: Global UK Fruits and Vegetables Market Revenue Million Forecast, by Vegetables 2019 & 2032
- Table 48: Global UK Fruits and Vegetables Market Volume Kiloton Forecast, by Vegetables 2019 & 2032
- Table 49: Global UK Fruits and Vegetables Market Revenue Million Forecast, by Country 2019 & 2032
- Table 50: Global UK Fruits and Vegetables Market Volume Kiloton Forecast, by Country 2019 & 2032
- Table 51: Brazil UK Fruits and Vegetables Market Revenue (Million) Forecast, by Application 2019 & 2032
- Table 52: Brazil UK Fruits and Vegetables Market Volume (Kiloton) Forecast, by Application 2019 & 2032
- Table 53: Argentina UK Fruits and Vegetables Market Revenue (Million) Forecast, by Application 2019 & 2032
- Table 54: Argentina UK Fruits and Vegetables Market Volume (Kiloton) Forecast, by Application 2019 & 2032
- Table 55: Rest of South America UK Fruits and Vegetables Market Revenue (Million) Forecast, by Application 2019 & 2032
- Table 56: Rest of South America UK Fruits and Vegetables Market Volume (Kiloton) Forecast, by Application 2019 & 2032
- Table 57: Global UK Fruits and Vegetables Market Revenue Million Forecast, by Fruits 2019 & 2032
- Table 58: Global UK Fruits and Vegetables Market Volume Kiloton Forecast, by Fruits 2019 & 2032
- Table 59: Global UK Fruits and Vegetables Market Revenue Million Forecast, by Vegetables 2019 & 2032
- Table 60: Global UK Fruits and Vegetables Market Volume Kiloton Forecast, by Vegetables 2019 & 2032
- Table 61: Global UK Fruits and Vegetables Market Revenue Million Forecast, by Fruits 2019 & 2032
- Table 62: Global UK Fruits and Vegetables Market Volume Kiloton Forecast, by Fruits 2019 & 2032
- Table 63: Global UK Fruits and Vegetables Market Revenue Million Forecast, by Vegetables 2019 & 2032
- Table 64: Global UK Fruits and Vegetables Market Volume Kiloton Forecast, by Vegetables 2019 & 2032
- Table 65: Global UK Fruits and Vegetables Market Revenue Million Forecast, by Country 2019 & 2032
- Table 66: Global UK Fruits and Vegetables Market Volume Kiloton Forecast, by Country 2019 & 2032
- Table 67: United Kingdom UK Fruits and Vegetables Market Revenue (Million) Forecast, by Application 2019 & 2032
- Table 68: United Kingdom UK Fruits and Vegetables Market Volume (Kiloton) Forecast, by Application 2019 & 2032
- Table 69: Germany UK Fruits and Vegetables Market Revenue (Million) Forecast, by Application 2019 & 2032
- Table 70: Germany UK Fruits and Vegetables Market Volume (Kiloton) Forecast, by Application 2019 & 2032
- Table 71: France UK Fruits and Vegetables Market Revenue (Million) Forecast, by Application 2019 & 2032
- Table 72: France UK Fruits and Vegetables Market Volume (Kiloton) Forecast, by Application 2019 & 2032
- Table 73: Italy UK Fruits and Vegetables Market Revenue (Million) Forecast, by Application 2019 & 2032
- Table 74: Italy UK Fruits and Vegetables Market Volume (Kiloton) Forecast, by Application 2019 & 2032
- Table 75: Spain UK Fruits and Vegetables Market Revenue (Million) Forecast, by Application 2019 & 2032
- Table 76: Spain UK Fruits and Vegetables Market Volume (Kiloton) Forecast, by Application 2019 & 2032
- Table 77: Russia UK Fruits and Vegetables Market Revenue (Million) Forecast, by Application 2019 & 2032
- Table 78: Russia UK Fruits and Vegetables Market Volume (Kiloton) Forecast, by Application 2019 & 2032
- Table 79: Benelux UK Fruits and Vegetables Market Revenue (Million) Forecast, by Application 2019 & 2032
- Table 80: Benelux UK Fruits and Vegetables Market Volume (Kiloton) Forecast, by Application 2019 & 2032
- Table 81: Nordics UK Fruits and Vegetables Market Revenue (Million) Forecast, by Application 2019 & 2032
- Table 82: Nordics UK Fruits and Vegetables Market Volume (Kiloton) Forecast, by Application 2019 & 2032
- Table 83: Rest of Europe UK Fruits and Vegetables Market Revenue (Million) Forecast, by Application 2019 & 2032
- Table 84: Rest of Europe UK Fruits and Vegetables Market Volume (Kiloton) Forecast, by Application 2019 & 2032
- Table 85: Global UK Fruits and Vegetables Market Revenue Million Forecast, by Fruits 2019 & 2032
- Table 86: Global UK Fruits and Vegetables Market Volume Kiloton Forecast, by Fruits 2019 & 2032
- Table 87: Global UK Fruits and Vegetables Market Revenue Million Forecast, by Vegetables 2019 & 2032
- Table 88: Global UK Fruits and Vegetables Market Volume Kiloton Forecast, by Vegetables 2019 & 2032
- Table 89: Global UK Fruits and Vegetables Market Revenue Million Forecast, by Fruits 2019 & 2032
- Table 90: Global UK Fruits and Vegetables Market Volume Kiloton Forecast, by Fruits 2019 & 2032
- Table 91: Global UK Fruits and Vegetables Market Revenue Million Forecast, by Vegetables 2019 & 2032
- Table 92: Global UK Fruits and Vegetables Market Volume Kiloton Forecast, by Vegetables 2019 & 2032
- Table 93: Global UK Fruits and Vegetables Market Revenue Million Forecast, by Country 2019 & 2032
- Table 94: Global UK Fruits and Vegetables Market Volume Kiloton Forecast, by Country 2019 & 2032
- Table 95: Turkey UK Fruits and Vegetables Market Revenue (Million) Forecast, by Application 2019 & 2032
- Table 96: Turkey UK Fruits and Vegetables Market Volume (Kiloton) Forecast, by Application 2019 & 2032
- Table 97: Israel UK Fruits and Vegetables Market Revenue (Million) Forecast, by Application 2019 & 2032
- Table 98: Israel UK Fruits and Vegetables Market Volume (Kiloton) Forecast, by Application 2019 & 2032
- Table 99: GCC UK Fruits and Vegetables Market Revenue (Million) Forecast, by Application 2019 & 2032
- Table 100: GCC UK Fruits and Vegetables Market Volume (Kiloton) Forecast, by Application 2019 & 2032
- Table 101: North Africa UK Fruits and Vegetables Market Revenue (Million) Forecast, by Application 2019 & 2032
- Table 102: North Africa UK Fruits and Vegetables Market Volume (Kiloton) Forecast, by Application 2019 & 2032
- Table 103: South Africa UK Fruits and Vegetables Market Revenue (Million) Forecast, by Application 2019 & 2032
- Table 104: South Africa UK Fruits and Vegetables Market Volume (Kiloton) Forecast, by Application 2019 & 2032
- Table 105: Rest of Middle East & Africa UK Fruits and Vegetables Market Revenue (Million) Forecast, by Application 2019 & 2032
- Table 106: Rest of Middle East & Africa UK Fruits and Vegetables Market Volume (Kiloton) Forecast, by Application 2019 & 2032
- Table 107: Global UK Fruits and Vegetables Market Revenue Million Forecast, by Fruits 2019 & 2032
- Table 108: Global UK Fruits and Vegetables Market Volume Kiloton Forecast, by Fruits 2019 & 2032
- Table 109: Global UK Fruits and Vegetables Market Revenue Million Forecast, by Vegetables 2019 & 2032
- Table 110: Global UK Fruits and Vegetables Market Volume Kiloton Forecast, by Vegetables 2019 & 2032
- Table 111: Global UK Fruits and Vegetables Market Revenue Million Forecast, by Fruits 2019 & 2032
- Table 112: Global UK Fruits and Vegetables Market Volume Kiloton Forecast, by Fruits 2019 & 2032
- Table 113: Global UK Fruits and Vegetables Market Revenue Million Forecast, by Vegetables 2019 & 2032
- Table 114: Global UK Fruits and Vegetables Market Volume Kiloton Forecast, by Vegetables 2019 & 2032
- Table 115: Global UK Fruits and Vegetables Market Revenue Million Forecast, by Country 2019 & 2032
- Table 116: Global UK Fruits and Vegetables Market Volume Kiloton Forecast, by Country 2019 & 2032
- Table 117: China UK Fruits and Vegetables Market Revenue (Million) Forecast, by Application 2019 & 2032
- Table 118: China UK Fruits and Vegetables Market Volume (Kiloton) Forecast, by Application 2019 & 2032
- Table 119: India UK Fruits and Vegetables Market Revenue (Million) Forecast, by Application 2019 & 2032
- Table 120: India UK Fruits and Vegetables Market Volume (Kiloton) Forecast, by Application 2019 & 2032
- Table 121: Japan UK Fruits and Vegetables Market Revenue (Million) Forecast, by Application 2019 & 2032
- Table 122: Japan UK Fruits and Vegetables Market Volume (Kiloton) Forecast, by Application 2019 & 2032
- Table 123: South Korea UK Fruits and Vegetables Market Revenue (Million) Forecast, by Application 2019 & 2032
- Table 124: South Korea UK Fruits and Vegetables Market Volume (Kiloton) Forecast, by Application 2019 & 2032
- Table 125: ASEAN UK Fruits and Vegetables Market Revenue (Million) Forecast, by Application 2019 & 2032
- Table 126: ASEAN UK Fruits and Vegetables Market Volume (Kiloton) Forecast, by Application 2019 & 2032
- Table 127: Oceania UK Fruits and Vegetables Market Revenue (Million) Forecast, by Application 2019 & 2032
- Table 128: Oceania UK Fruits and Vegetables Market Volume (Kiloton) Forecast, by Application 2019 & 2032
- Table 129: Rest of Asia Pacific UK Fruits and Vegetables Market Revenue (Million) Forecast, by Application 2019 & 2032
- Table 130: Rest of Asia Pacific UK Fruits and Vegetables Market Volume (Kiloton) Forecast, by Application 2019 & 2032
Frequently Asked Questions
1. What is the projected Compound Annual Growth Rate (CAGR) of the UK Fruits and Vegetables Market?
The projected CAGR is approximately 2.97%.
2. Which companies are prominent players in the UK Fruits and Vegetables Market?
Key companies in the market include Marks & Spencer , Waitrose, Sainsbury's , Asda , Tesco .
3. What are the main segments of the UK Fruits and Vegetables Market?
The market segments include Fruits, Vegetables, Fruits, Vegetables.
4. Can you provide details about the market size?
The market size is estimated to be USD 31.58 Million as of 2022.
5. What are some drivers contributing to market growth?
; Awareness About Health Benefits Associated With Pecan Consumption; Wide Application of Pecan.
6. What are the notable trends driving market growth?
Increasing Area Under Cultivation.
7. Are there any restraints impacting market growth?
; Volatility in the Prices; Adverse Weather Conditions Affecting Yield.
8. Can you provide examples of recent developments in the market?
N/A
9. What pricing options are available for accessing the report?
Pricing options include single-user, multi-user, and enterprise licenses priced at USD 3800, USD 4500, and USD 5800 respectively.
10. Is the market size provided in terms of value or volume?
The market size is provided in terms of value, measured in Million and volume, measured in Kiloton.
11. Are there any specific market keywords associated with the report?
Yes, the market keyword associated with the report is "UK Fruits and Vegetables Market," which aids in identifying and referencing the specific market segment covered.
12. How do I determine which pricing option suits my needs best?
The pricing options vary based on user requirements and access needs. Individual users may opt for single-user licenses, while businesses requiring broader access may choose multi-user or enterprise licenses for cost-effective access to the report.
13. Are there any additional resources or data provided in the UK Fruits and Vegetables Market report?
While the report offers comprehensive insights, it's advisable to review the specific contents or supplementary materials provided to ascertain if additional resources or data are available.
14. How can I stay updated on further developments or reports in the UK Fruits and Vegetables Market?
To stay informed about further developments, trends, and reports in the UK Fruits and Vegetables Market, consider subscribing to industry newsletters, following relevant companies and organizations, or regularly checking reputable industry news sources and publications.
Methodology
Step 1 - Identification of Relevant Samples Size from Population Database


Step 2 - Approaches for Defining Global Market Size (Value, Volume* & Price*)

Note*: In applicable scenarios
Step 3 - Data Sources
Primary Research
- Web Analytics
- Survey Reports
- Research Institute
- Latest Research Reports
- Opinion Leaders
Secondary Research
- Annual Reports
- White Paper
- Latest Press Release
- Industry Association
- Paid Database
- Investor Presentations

Step 4 - Data Triangulation
Involves using different sources of information in order to increase the validity of a study
These sources are likely to be stakeholders in a program - participants, other researchers, program staff, other community members, and so on.
Then we put all data in single framework & apply various statistical tools to find out the dynamic on the market.
During the analysis stage, feedback from the stakeholder groups would be compared to determine areas of agreement as well as areas of divergence


