

Key Insights
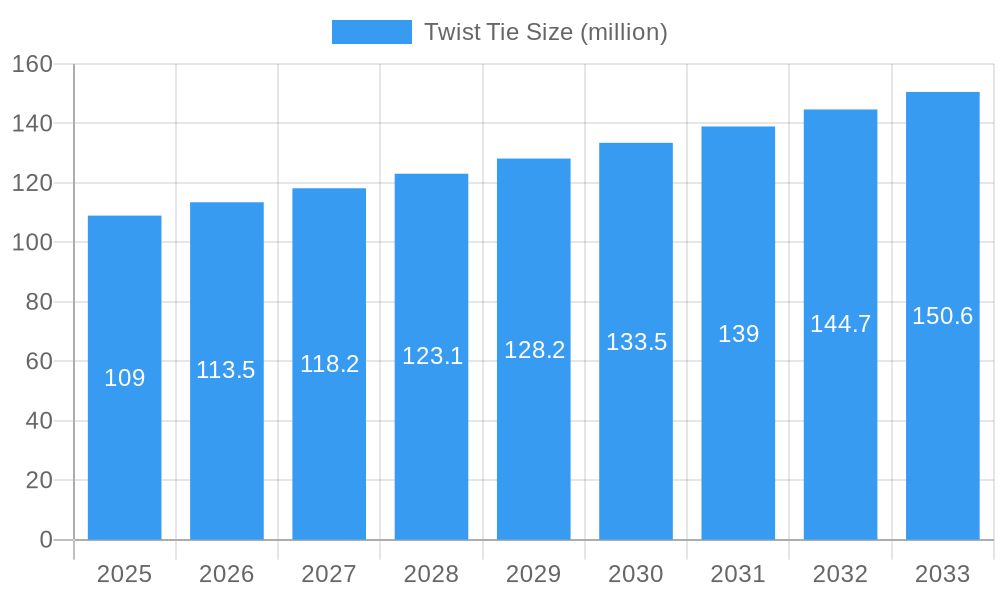
The twist tie market, currently valued at $109 million in 2025, is projected to experience steady growth, driven by increasing demand across diverse sectors. The Compound Annual Growth Rate (CAGR) of 3.7% from 2025 to 2033 indicates a consistent expansion, fueled by factors such as the rising popularity of e-commerce and food delivery services, which necessitate secure and efficient packaging solutions. The growth is further propelled by advancements in material science, leading to the development of more sustainable and biodegradable twist ties, catering to the growing environmental consciousness among consumers and businesses. Key segments within the market likely include those catering to food packaging (bakery, produce, meat), industrial applications (bundling, securing), and consumer goods packaging. Competition among established players like Bedford, Hanscom, Inc., AR-BEE Transparent Products, Inc., and others suggests a relatively mature market with established supply chains. However, the market may also see the emergence of niche players focusing on sustainable or specialized twist tie solutions. The market's growth trajectory remains positive, with potential for accelerated growth if innovative materials and packaging applications gain wider adoption.
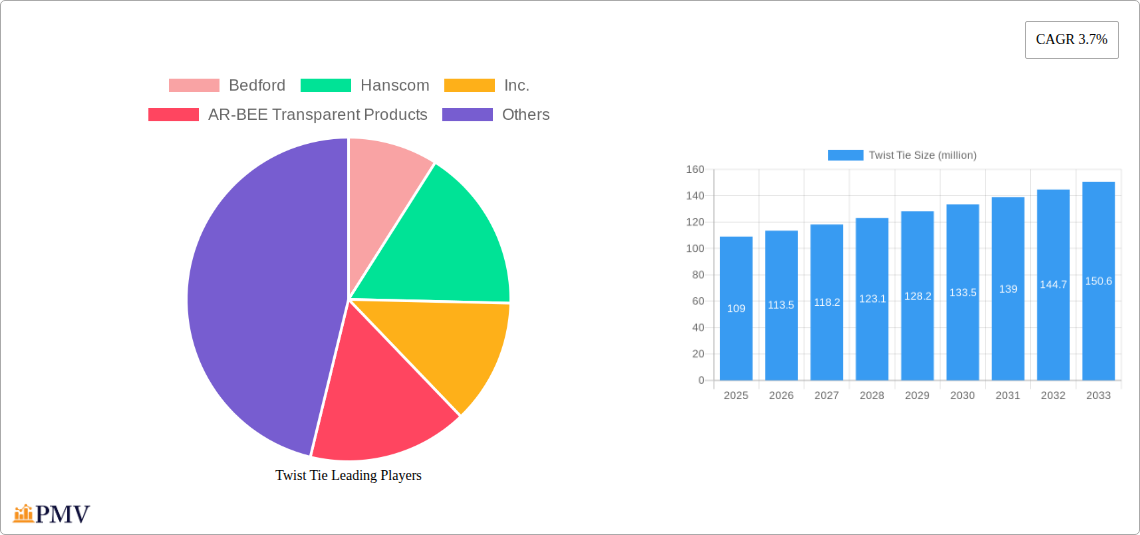
Twist Tie Market Size (In Million)
While regional data is unavailable, a reasonable estimation based on global market trends would suggest that North America and Europe constitute significant portions of the market share. Asia-Pacific is also likely to show substantial growth due to its expanding manufacturing and food processing sectors. The main restraints to growth may include price sensitivity in certain segments, the availability of alternative closure mechanisms, and fluctuations in raw material costs. However, ongoing innovations and the inherent versatility of twist ties across various applications suggest that the market will continue its upward trajectory. Further research into specific regional market shares and segment breakdowns is recommended to gain a more precise understanding of the market dynamics.
Twist Tie Company Market Share
The Twist Tie Market: A Comprehensive Analysis (2019-2033)
This in-depth report provides a comprehensive analysis of the global twist tie market, offering invaluable insights for businesses and investors seeking to navigate this dynamic sector. With a study period spanning 2019-2033, a base year of 2025, and a forecast period of 2025-2033, this report leverages rigorous data analysis and market intelligence to illuminate key trends, challenges, and opportunities within the twist tie industry. The report analyzes a multi-billion dollar market, covering major segments and providing granular insights into growth drivers and competitive dynamics.
Twist Tie Market Structure & Competitive Dynamics
The global twist tie market exhibits a moderately concentrated structure, with a few major players holding significant market share. Bedford, Hanscom, Inc. and Alpha Packaging, Inc. are estimated to control approximately xx% of the market collectively in 2025, reflecting their extensive production capabilities and established distribution networks. However, the market also features a considerable number of smaller players, particularly in regional markets, leading to competitive intensity. Innovation in materials, such as biodegradable and recyclable options, is a key factor differentiating players. Regulatory frameworks concerning material sourcing and environmental impact increasingly influence market dynamics. Product substitution, primarily from alternative closure mechanisms, presents a moderate challenge, although the cost-effectiveness and familiarity of twist ties maintain substantial demand. The market witnessed xx million in M&A activity during the historical period (2019-2024), largely driven by consolidation among smaller players seeking to enhance scale and reach. Further M&A activity is anticipated in the forecast period, potentially leading to further market concentration.
- Market Concentration: Moderately concentrated, with top players holding xx% market share in 2025.
- Innovation Ecosystem: Focus on sustainable and biodegradable materials.
- Regulatory Frameworks: Increasing emphasis on environmental sustainability.
- Product Substitutes: Moderate threat from alternative closure mechanisms.
- End-User Trends: Demand driven by food packaging, industrial applications, and consumer needs.
- M&A Activity: xx million in deals during 2019-2024; further consolidation expected.
Twist Tie Industry Trends & Insights
The global twist tie market is projected to experience robust growth, with a Compound Annual Growth Rate (CAGR) of xx% during the forecast period (2025-2033). This growth is primarily fueled by increasing demand from the food and beverage industry, driven by rising consumer preference for convenient packaging solutions. Technological advancements, particularly in automation and material science, are improving manufacturing efficiency and enabling the development of more sustainable products. Market penetration of biodegradable and recyclable twist ties is increasing, driven by heightened environmental awareness among consumers and stricter regulatory norms. However, fluctuations in raw material prices and increasing competition from substitute products pose challenges. The market is also witnessing a shift towards specialized twist ties tailored to specific applications, enhancing market segmentation. By 2033, market penetration for biodegradable twist ties is anticipated to reach xx%.
Dominant Markets & Segments in Twist Tie
North America is projected to remain the dominant market for twist ties throughout the forecast period, driven by robust demand from food processing and retail sectors. Strong economic growth, well-developed infrastructure, and established packaging industries contribute to the region's market leadership. Within North America, the United States holds the largest share, further bolstered by a large consumer base and extensive industrial activities.
- Key Drivers in North America:
- Strong economic growth
- Well-developed infrastructure
- Large consumer base
- Established packaging industry
- Dominance Analysis: The dominance of North America is attributed to a confluence of factors including robust demand, efficient supply chains, and technological advancements within the region's packaging sector. This dominance is expected to persist, albeit with increasing competition from other regions as emerging markets mature.
Twist Tie Product Innovations
Recent innovations focus on enhancing sustainability, functionality, and cost-effectiveness. Biodegradable twist ties made from plant-based polymers are gaining traction, aligning with growing consumer demand for eco-friendly packaging solutions. Developments in automated twist tie application equipment are streamlining packaging processes and improving efficiency. These innovations contribute to cost reduction for producers and enhance convenience for end-users. The market is also witnessing the emergence of specialized twist ties with improved strength and durability for specific applications.
Report Segmentation & Scope
This report segments the twist tie market based on material type (metal, plastic, and others), application (food packaging, industrial use, and others), and region (North America, Europe, Asia-Pacific, and Rest of the World). Each segment offers distinct growth opportunities and competitive landscapes. For instance, the plastic twist tie segment is projected to witness significant growth due to its versatility and cost-effectiveness, while the biodegradable segment is expected to gain significant traction driven by environmental concerns. Regional variations in consumption patterns and regulatory frameworks influence market dynamics within each segment.
Key Drivers of Twist Tie Growth
Growth in the twist tie market is primarily driven by factors such as the expanding food and beverage industry, increasing demand for convenient packaging, and technological advancements enabling the creation of more efficient and sustainable products. The rise of e-commerce and online grocery delivery platforms is also boosting demand for secure and tamper-evident packaging. Favorable economic conditions in key regions further stimulate growth. Stringent regulatory requirements regarding food safety and hygiene also support the use of reliable closure systems like twist ties.
Challenges in the Twist Tie Sector
The twist tie sector faces challenges such as fluctuating raw material prices, particularly for metals and polymers, directly impacting production costs. The increasing prevalence of substitute closure mechanisms, such as zip ties and heat-sealable closures, poses competitive pressure. Further, stricter environmental regulations might necessitate higher investment in sustainable manufacturing practices, increasing production costs. Supply chain disruptions can also cause production delays and price increases.
Leading Players in the Twist Tie Market
- Bedford, Hanscom, Inc.
- AR-BEE Transparent Products, Inc.
- Universal Plastic Bag Co.
- Alpha Packaging, Inc.
- Riverside Paper Co.
- Andler Packaging Group
- Clear View Bag Co., Inc.
- Thai Coated Wire
- WSK
Key Developments in Twist Tie Sector
- 2022 Q4: Alpha Packaging, Inc. announced the launch of a new line of biodegradable twist ties.
- 2023 Q1: Universal Plastic Bag Co. invested xx million in upgrading its manufacturing facility to enhance production capacity.
- 2023 Q3: A merger between two smaller twist tie manufacturers resulted in the creation of a larger entity with expanded market reach. (Further details regarding the merger are unavailable at this time.)
Strategic Twist Tie Market Outlook
The future of the twist tie market appears bright, driven by the continued expansion of the food and beverage industry, the growth of e-commerce, and increasing consumer demand for sustainable packaging solutions. Opportunities exist for businesses to capitalize on this growth by investing in innovative product development, focusing on sustainability, and strengthening their supply chain resilience. Strategic partnerships and acquisitions will play a key role in shaping the market landscape in the coming years. The market presents a compelling investment opportunity for companies that can adapt to evolving consumer preferences and regulatory trends.
Twist Tie Segmentation
-
1. Application
- 1.1. Food & Beverage
- 1.2. Chemical Industry
- 1.3. Others
-
2. Types
- 2.1. Metallic
- 2.2. Spool
- 2.3. Paper
- 2.4. Plastic
Twist Tie Segmentation By Geography
-
1. North America
- 1.1. United States
- 1.2. Canada
- 1.3. Mexico
-
2. South America
- 2.1. Brazil
- 2.2. Argentina
- 2.3. Rest of South America
-
3. Europe
- 3.1. United Kingdom
- 3.2. Germany
- 3.3. France
- 3.4. Italy
- 3.5. Spain
- 3.6. Russia
- 3.7. Benelux
- 3.8. Nordics
- 3.9. Rest of Europe
-
4. Middle East & Africa
- 4.1. Turkey
- 4.2. Israel
- 4.3. GCC
- 4.4. North Africa
- 4.5. South Africa
- 4.6. Rest of Middle East & Africa
-
5. Asia Pacific
- 5.1. China
- 5.2. India
- 5.3. Japan
- 5.4. South Korea
- 5.5. ASEAN
- 5.6. Oceania
- 5.7. Rest of Asia Pacific

Twist Tie Regional Market Share
Geographic Coverage of Twist Tie
Twist Tie REPORT HIGHLIGHTS
| Aspects | Details |
|---|---|
| Study Period | 2020-2034 |
| Base Year | 2025 |
| Estimated Year | 2026 |
| Forecast Period | 2026-2034 |
| Historical Period | 2020-2025 |
| Growth Rate | CAGR of 5.5% from 2020-2034 |
| Segmentation |
|
Table of Contents
- 1. Introduction
- 1.1. Research Scope
- 1.2. Market Segmentation
- 1.3. Research Methodology
- 1.4. Definitions and Assumptions
- 2. Executive Summary
- 2.1. Introduction
- 3. Market Dynamics
- 3.1. Introduction
- 3.2. Market Drivers
- 3.3. Market Restrains
- 3.4. Market Trends
- 4. Market Factor Analysis
- 4.1. Porters Five Forces
- 4.2. Supply/Value Chain
- 4.3. PESTEL analysis
- 4.4. Market Entropy
- 4.5. Patent/Trademark Analysis
- 5. Global Twist Tie Analysis, Insights and Forecast, 2020-2032
- 5.1. Market Analysis, Insights and Forecast - by Application
- 5.1.1. Food & Beverage
- 5.1.2. Chemical Industry
- 5.1.3. Others
- 5.2. Market Analysis, Insights and Forecast - by Types
- 5.2.1. Metallic
- 5.2.2. Spool
- 5.2.3. Paper
- 5.2.4. Plastic
- 5.3. Market Analysis, Insights and Forecast - by Region
- 5.3.1. North America
- 5.3.2. South America
- 5.3.3. Europe
- 5.3.4. Middle East & Africa
- 5.3.5. Asia Pacific
- 5.1. Market Analysis, Insights and Forecast - by Application
- 6. North America Twist Tie Analysis, Insights and Forecast, 2020-2032
- 6.1. Market Analysis, Insights and Forecast - by Application
- 6.1.1. Food & Beverage
- 6.1.2. Chemical Industry
- 6.1.3. Others
- 6.2. Market Analysis, Insights and Forecast - by Types
- 6.2.1. Metallic
- 6.2.2. Spool
- 6.2.3. Paper
- 6.2.4. Plastic
- 6.1. Market Analysis, Insights and Forecast - by Application
- 7. South America Twist Tie Analysis, Insights and Forecast, 2020-2032
- 7.1. Market Analysis, Insights and Forecast - by Application
- 7.1.1. Food & Beverage
- 7.1.2. Chemical Industry
- 7.1.3. Others
- 7.2. Market Analysis, Insights and Forecast - by Types
- 7.2.1. Metallic
- 7.2.2. Spool
- 7.2.3. Paper
- 7.2.4. Plastic
- 7.1. Market Analysis, Insights and Forecast - by Application
- 8. Europe Twist Tie Analysis, Insights and Forecast, 2020-2032
- 8.1. Market Analysis, Insights and Forecast - by Application
- 8.1.1. Food & Beverage
- 8.1.2. Chemical Industry
- 8.1.3. Others
- 8.2. Market Analysis, Insights and Forecast - by Types
- 8.2.1. Metallic
- 8.2.2. Spool
- 8.2.3. Paper
- 8.2.4. Plastic
- 8.1. Market Analysis, Insights and Forecast - by Application
- 9. Middle East & Africa Twist Tie Analysis, Insights and Forecast, 2020-2032
- 9.1. Market Analysis, Insights and Forecast - by Application
- 9.1.1. Food & Beverage
- 9.1.2. Chemical Industry
- 9.1.3. Others
- 9.2. Market Analysis, Insights and Forecast - by Types
- 9.2.1. Metallic
- 9.2.2. Spool
- 9.2.3. Paper
- 9.2.4. Plastic
- 9.1. Market Analysis, Insights and Forecast - by Application
- 10. Asia Pacific Twist Tie Analysis, Insights and Forecast, 2020-2032
- 10.1. Market Analysis, Insights and Forecast - by Application
- 10.1.1. Food & Beverage
- 10.1.2. Chemical Industry
- 10.1.3. Others
- 10.2. Market Analysis, Insights and Forecast - by Types
- 10.2.1. Metallic
- 10.2.2. Spool
- 10.2.3. Paper
- 10.2.4. Plastic
- 10.1. Market Analysis, Insights and Forecast - by Application
- 11. Competitive Analysis
- 11.1. Global Market Share Analysis 2025
- 11.2. Company Profiles
- 11.2.1 Bedford
- 11.2.1.1. Overview
- 11.2.1.2. Products
- 11.2.1.3. SWOT Analysis
- 11.2.1.4. Recent Developments
- 11.2.1.5. Financials (Based on Availability)
- 11.2.2 Hanscom
- 11.2.2.1. Overview
- 11.2.2.2. Products
- 11.2.2.3. SWOT Analysis
- 11.2.2.4. Recent Developments
- 11.2.2.5. Financials (Based on Availability)
- 11.2.3 Inc.
- 11.2.3.1. Overview
- 11.2.3.2. Products
- 11.2.3.3. SWOT Analysis
- 11.2.3.4. Recent Developments
- 11.2.3.5. Financials (Based on Availability)
- 11.2.4 AR-BEE Transparent Products
- 11.2.4.1. Overview
- 11.2.4.2. Products
- 11.2.4.3. SWOT Analysis
- 11.2.4.4. Recent Developments
- 11.2.4.5. Financials (Based on Availability)
- 11.2.5 Inc.
- 11.2.5.1. Overview
- 11.2.5.2. Products
- 11.2.5.3. SWOT Analysis
- 11.2.5.4. Recent Developments
- 11.2.5.5. Financials (Based on Availability)
- 11.2.6 Universal Plastic Bag Co.
- 11.2.6.1. Overview
- 11.2.6.2. Products
- 11.2.6.3. SWOT Analysis
- 11.2.6.4. Recent Developments
- 11.2.6.5. Financials (Based on Availability)
- 11.2.7 Alpha Packaging
- 11.2.7.1. Overview
- 11.2.7.2. Products
- 11.2.7.3. SWOT Analysis
- 11.2.7.4. Recent Developments
- 11.2.7.5. Financials (Based on Availability)
- 11.2.8 Inc.
- 11.2.8.1. Overview
- 11.2.8.2. Products
- 11.2.8.3. SWOT Analysis
- 11.2.8.4. Recent Developments
- 11.2.8.5. Financials (Based on Availability)
- 11.2.9 Riverside Paper Co.
- 11.2.9.1. Overview
- 11.2.9.2. Products
- 11.2.9.3. SWOT Analysis
- 11.2.9.4. Recent Developments
- 11.2.9.5. Financials (Based on Availability)
- 11.2.10 Andler Packaging Group
- 11.2.10.1. Overview
- 11.2.10.2. Products
- 11.2.10.3. SWOT Analysis
- 11.2.10.4. Recent Developments
- 11.2.10.5. Financials (Based on Availability)
- 11.2.11 Clear View Bag Co.
- 11.2.11.1. Overview
- 11.2.11.2. Products
- 11.2.11.3. SWOT Analysis
- 11.2.11.4. Recent Developments
- 11.2.11.5. Financials (Based on Availability)
- 11.2.12 Inc.
- 11.2.12.1. Overview
- 11.2.12.2. Products
- 11.2.12.3. SWOT Analysis
- 11.2.12.4. Recent Developments
- 11.2.12.5. Financials (Based on Availability)
- 11.2.13 Thai Coated Wire
- 11.2.13.1. Overview
- 11.2.13.2. Products
- 11.2.13.3. SWOT Analysis
- 11.2.13.4. Recent Developments
- 11.2.13.5. Financials (Based on Availability)
- 11.2.14 WSK
- 11.2.14.1. Overview
- 11.2.14.2. Products
- 11.2.14.3. SWOT Analysis
- 11.2.14.4. Recent Developments
- 11.2.14.5. Financials (Based on Availability)
- 11.2.1 Bedford
List of Figures
- Figure 1: Global Twist Tie Revenue Breakdown (undefined, %) by Region 2025 & 2033
- Figure 2: Global Twist Tie Volume Breakdown (K, %) by Region 2025 & 2033
- Figure 3: North America Twist Tie Revenue (undefined), by Application 2025 & 2033
- Figure 4: North America Twist Tie Volume (K), by Application 2025 & 2033
- Figure 5: North America Twist Tie Revenue Share (%), by Application 2025 & 2033
- Figure 6: North America Twist Tie Volume Share (%), by Application 2025 & 2033
- Figure 7: North America Twist Tie Revenue (undefined), by Types 2025 & 2033
- Figure 8: North America Twist Tie Volume (K), by Types 2025 & 2033
- Figure 9: North America Twist Tie Revenue Share (%), by Types 2025 & 2033
- Figure 10: North America Twist Tie Volume Share (%), by Types 2025 & 2033
- Figure 11: North America Twist Tie Revenue (undefined), by Country 2025 & 2033
- Figure 12: North America Twist Tie Volume (K), by Country 2025 & 2033
- Figure 13: North America Twist Tie Revenue Share (%), by Country 2025 & 2033
- Figure 14: North America Twist Tie Volume Share (%), by Country 2025 & 2033
- Figure 15: South America Twist Tie Revenue (undefined), by Application 2025 & 2033
- Figure 16: South America Twist Tie Volume (K), by Application 2025 & 2033
- Figure 17: South America Twist Tie Revenue Share (%), by Application 2025 & 2033
- Figure 18: South America Twist Tie Volume Share (%), by Application 2025 & 2033
- Figure 19: South America Twist Tie Revenue (undefined), by Types 2025 & 2033
- Figure 20: South America Twist Tie Volume (K), by Types 2025 & 2033
- Figure 21: South America Twist Tie Revenue Share (%), by Types 2025 & 2033
- Figure 22: South America Twist Tie Volume Share (%), by Types 2025 & 2033
- Figure 23: South America Twist Tie Revenue (undefined), by Country 2025 & 2033
- Figure 24: South America Twist Tie Volume (K), by Country 2025 & 2033
- Figure 25: South America Twist Tie Revenue Share (%), by Country 2025 & 2033
- Figure 26: South America Twist Tie Volume Share (%), by Country 2025 & 2033
- Figure 27: Europe Twist Tie Revenue (undefined), by Application 2025 & 2033
- Figure 28: Europe Twist Tie Volume (K), by Application 2025 & 2033
- Figure 29: Europe Twist Tie Revenue Share (%), by Application 2025 & 2033
- Figure 30: Europe Twist Tie Volume Share (%), by Application 2025 & 2033
- Figure 31: Europe Twist Tie Revenue (undefined), by Types 2025 & 2033
- Figure 32: Europe Twist Tie Volume (K), by Types 2025 & 2033
- Figure 33: Europe Twist Tie Revenue Share (%), by Types 2025 & 2033
- Figure 34: Europe Twist Tie Volume Share (%), by Types 2025 & 2033
- Figure 35: Europe Twist Tie Revenue (undefined), by Country 2025 & 2033
- Figure 36: Europe Twist Tie Volume (K), by Country 2025 & 2033
- Figure 37: Europe Twist Tie Revenue Share (%), by Country 2025 & 2033
- Figure 38: Europe Twist Tie Volume Share (%), by Country 2025 & 2033
- Figure 39: Middle East & Africa Twist Tie Revenue (undefined), by Application 2025 & 2033
- Figure 40: Middle East & Africa Twist Tie Volume (K), by Application 2025 & 2033
- Figure 41: Middle East & Africa Twist Tie Revenue Share (%), by Application 2025 & 2033
- Figure 42: Middle East & Africa Twist Tie Volume Share (%), by Application 2025 & 2033
- Figure 43: Middle East & Africa Twist Tie Revenue (undefined), by Types 2025 & 2033
- Figure 44: Middle East & Africa Twist Tie Volume (K), by Types 2025 & 2033
- Figure 45: Middle East & Africa Twist Tie Revenue Share (%), by Types 2025 & 2033
- Figure 46: Middle East & Africa Twist Tie Volume Share (%), by Types 2025 & 2033
- Figure 47: Middle East & Africa Twist Tie Revenue (undefined), by Country 2025 & 2033
- Figure 48: Middle East & Africa Twist Tie Volume (K), by Country 2025 & 2033
- Figure 49: Middle East & Africa Twist Tie Revenue Share (%), by Country 2025 & 2033
- Figure 50: Middle East & Africa Twist Tie Volume Share (%), by Country 2025 & 2033
- Figure 51: Asia Pacific Twist Tie Revenue (undefined), by Application 2025 & 2033
- Figure 52: Asia Pacific Twist Tie Volume (K), by Application 2025 & 2033
- Figure 53: Asia Pacific Twist Tie Revenue Share (%), by Application 2025 & 2033
- Figure 54: Asia Pacific Twist Tie Volume Share (%), by Application 2025 & 2033
- Figure 55: Asia Pacific Twist Tie Revenue (undefined), by Types 2025 & 2033
- Figure 56: Asia Pacific Twist Tie Volume (K), by Types 2025 & 2033
- Figure 57: Asia Pacific Twist Tie Revenue Share (%), by Types 2025 & 2033
- Figure 58: Asia Pacific Twist Tie Volume Share (%), by Types 2025 & 2033
- Figure 59: Asia Pacific Twist Tie Revenue (undefined), by Country 2025 & 2033
- Figure 60: Asia Pacific Twist Tie Volume (K), by Country 2025 & 2033
- Figure 61: Asia Pacific Twist Tie Revenue Share (%), by Country 2025 & 2033
- Figure 62: Asia Pacific Twist Tie Volume Share (%), by Country 2025 & 2033
List of Tables
- Table 1: Global Twist Tie Revenue undefined Forecast, by Application 2020 & 2033
- Table 2: Global Twist Tie Volume K Forecast, by Application 2020 & 2033
- Table 3: Global Twist Tie Revenue undefined Forecast, by Types 2020 & 2033
- Table 4: Global Twist Tie Volume K Forecast, by Types 2020 & 2033
- Table 5: Global Twist Tie Revenue undefined Forecast, by Region 2020 & 2033
- Table 6: Global Twist Tie Volume K Forecast, by Region 2020 & 2033
- Table 7: Global Twist Tie Revenue undefined Forecast, by Application 2020 & 2033
- Table 8: Global Twist Tie Volume K Forecast, by Application 2020 & 2033
- Table 9: Global Twist Tie Revenue undefined Forecast, by Types 2020 & 2033
- Table 10: Global Twist Tie Volume K Forecast, by Types 2020 & 2033
- Table 11: Global Twist Tie Revenue undefined Forecast, by Country 2020 & 2033
- Table 12: Global Twist Tie Volume K Forecast, by Country 2020 & 2033
- Table 13: United States Twist Tie Revenue (undefined) Forecast, by Application 2020 & 2033
- Table 14: United States Twist Tie Volume (K) Forecast, by Application 2020 & 2033
- Table 15: Canada Twist Tie Revenue (undefined) Forecast, by Application 2020 & 2033
- Table 16: Canada Twist Tie Volume (K) Forecast, by Application 2020 & 2033
- Table 17: Mexico Twist Tie Revenue (undefined) Forecast, by Application 2020 & 2033
- Table 18: Mexico Twist Tie Volume (K) Forecast, by Application 2020 & 2033
- Table 19: Global Twist Tie Revenue undefined Forecast, by Application 2020 & 2033
- Table 20: Global Twist Tie Volume K Forecast, by Application 2020 & 2033
- Table 21: Global Twist Tie Revenue undefined Forecast, by Types 2020 & 2033
- Table 22: Global Twist Tie Volume K Forecast, by Types 2020 & 2033
- Table 23: Global Twist Tie Revenue undefined Forecast, by Country 2020 & 2033
- Table 24: Global Twist Tie Volume K Forecast, by Country 2020 & 2033
- Table 25: Brazil Twist Tie Revenue (undefined) Forecast, by Application 2020 & 2033
- Table 26: Brazil Twist Tie Volume (K) Forecast, by Application 2020 & 2033
- Table 27: Argentina Twist Tie Revenue (undefined) Forecast, by Application 2020 & 2033
- Table 28: Argentina Twist Tie Volume (K) Forecast, by Application 2020 & 2033
- Table 29: Rest of South America Twist Tie Revenue (undefined) Forecast, by Application 2020 & 2033
- Table 30: Rest of South America Twist Tie Volume (K) Forecast, by Application 2020 & 2033
- Table 31: Global Twist Tie Revenue undefined Forecast, by Application 2020 & 2033
- Table 32: Global Twist Tie Volume K Forecast, by Application 2020 & 2033
- Table 33: Global Twist Tie Revenue undefined Forecast, by Types 2020 & 2033
- Table 34: Global Twist Tie Volume K Forecast, by Types 2020 & 2033
- Table 35: Global Twist Tie Revenue undefined Forecast, by Country 2020 & 2033
- Table 36: Global Twist Tie Volume K Forecast, by Country 2020 & 2033
- Table 37: United Kingdom Twist Tie Revenue (undefined) Forecast, by Application 2020 & 2033
- Table 38: United Kingdom Twist Tie Volume (K) Forecast, by Application 2020 & 2033
- Table 39: Germany Twist Tie Revenue (undefined) Forecast, by Application 2020 & 2033
- Table 40: Germany Twist Tie Volume (K) Forecast, by Application 2020 & 2033
- Table 41: France Twist Tie Revenue (undefined) Forecast, by Application 2020 & 2033
- Table 42: France Twist Tie Volume (K) Forecast, by Application 2020 & 2033
- Table 43: Italy Twist Tie Revenue (undefined) Forecast, by Application 2020 & 2033
- Table 44: Italy Twist Tie Volume (K) Forecast, by Application 2020 & 2033
- Table 45: Spain Twist Tie Revenue (undefined) Forecast, by Application 2020 & 2033
- Table 46: Spain Twist Tie Volume (K) Forecast, by Application 2020 & 2033
- Table 47: Russia Twist Tie Revenue (undefined) Forecast, by Application 2020 & 2033
- Table 48: Russia Twist Tie Volume (K) Forecast, by Application 2020 & 2033
- Table 49: Benelux Twist Tie Revenue (undefined) Forecast, by Application 2020 & 2033
- Table 50: Benelux Twist Tie Volume (K) Forecast, by Application 2020 & 2033
- Table 51: Nordics Twist Tie Revenue (undefined) Forecast, by Application 2020 & 2033
- Table 52: Nordics Twist Tie Volume (K) Forecast, by Application 2020 & 2033
- Table 53: Rest of Europe Twist Tie Revenue (undefined) Forecast, by Application 2020 & 2033
- Table 54: Rest of Europe Twist Tie Volume (K) Forecast, by Application 2020 & 2033
- Table 55: Global Twist Tie Revenue undefined Forecast, by Application 2020 & 2033
- Table 56: Global Twist Tie Volume K Forecast, by Application 2020 & 2033
- Table 57: Global Twist Tie Revenue undefined Forecast, by Types 2020 & 2033
- Table 58: Global Twist Tie Volume K Forecast, by Types 2020 & 2033
- Table 59: Global Twist Tie Revenue undefined Forecast, by Country 2020 & 2033
- Table 60: Global Twist Tie Volume K Forecast, by Country 2020 & 2033
- Table 61: Turkey Twist Tie Revenue (undefined) Forecast, by Application 2020 & 2033
- Table 62: Turkey Twist Tie Volume (K) Forecast, by Application 2020 & 2033
- Table 63: Israel Twist Tie Revenue (undefined) Forecast, by Application 2020 & 2033
- Table 64: Israel Twist Tie Volume (K) Forecast, by Application 2020 & 2033
- Table 65: GCC Twist Tie Revenue (undefined) Forecast, by Application 2020 & 2033
- Table 66: GCC Twist Tie Volume (K) Forecast, by Application 2020 & 2033
- Table 67: North Africa Twist Tie Revenue (undefined) Forecast, by Application 2020 & 2033
- Table 68: North Africa Twist Tie Volume (K) Forecast, by Application 2020 & 2033
- Table 69: South Africa Twist Tie Revenue (undefined) Forecast, by Application 2020 & 2033
- Table 70: South Africa Twist Tie Volume (K) Forecast, by Application 2020 & 2033
- Table 71: Rest of Middle East & Africa Twist Tie Revenue (undefined) Forecast, by Application 2020 & 2033
- Table 72: Rest of Middle East & Africa Twist Tie Volume (K) Forecast, by Application 2020 & 2033
- Table 73: Global Twist Tie Revenue undefined Forecast, by Application 2020 & 2033
- Table 74: Global Twist Tie Volume K Forecast, by Application 2020 & 2033
- Table 75: Global Twist Tie Revenue undefined Forecast, by Types 2020 & 2033
- Table 76: Global Twist Tie Volume K Forecast, by Types 2020 & 2033
- Table 77: Global Twist Tie Revenue undefined Forecast, by Country 2020 & 2033
- Table 78: Global Twist Tie Volume K Forecast, by Country 2020 & 2033
- Table 79: China Twist Tie Revenue (undefined) Forecast, by Application 2020 & 2033
- Table 80: China Twist Tie Volume (K) Forecast, by Application 2020 & 2033
- Table 81: India Twist Tie Revenue (undefined) Forecast, by Application 2020 & 2033
- Table 82: India Twist Tie Volume (K) Forecast, by Application 2020 & 2033
- Table 83: Japan Twist Tie Revenue (undefined) Forecast, by Application 2020 & 2033
- Table 84: Japan Twist Tie Volume (K) Forecast, by Application 2020 & 2033
- Table 85: South Korea Twist Tie Revenue (undefined) Forecast, by Application 2020 & 2033
- Table 86: South Korea Twist Tie Volume (K) Forecast, by Application 2020 & 2033
- Table 87: ASEAN Twist Tie Revenue (undefined) Forecast, by Application 2020 & 2033
- Table 88: ASEAN Twist Tie Volume (K) Forecast, by Application 2020 & 2033
- Table 89: Oceania Twist Tie Revenue (undefined) Forecast, by Application 2020 & 2033
- Table 90: Oceania Twist Tie Volume (K) Forecast, by Application 2020 & 2033
- Table 91: Rest of Asia Pacific Twist Tie Revenue (undefined) Forecast, by Application 2020 & 2033
- Table 92: Rest of Asia Pacific Twist Tie Volume (K) Forecast, by Application 2020 & 2033
Frequently Asked Questions
1. What is the projected Compound Annual Growth Rate (CAGR) of the Twist Tie?
The projected CAGR is approximately 5.5%.
2. Which companies are prominent players in the Twist Tie?
Key companies in the market include Bedford, Hanscom, Inc., AR-BEE Transparent Products, Inc., Universal Plastic Bag Co., Alpha Packaging, Inc., Riverside Paper Co., Andler Packaging Group, Clear View Bag Co., Inc., Thai Coated Wire, WSK.
3. What are the main segments of the Twist Tie?
The market segments include Application, Types.
4. Can you provide details about the market size?
The market size is estimated to be USD XXX N/A as of 2022.
5. What are some drivers contributing to market growth?
N/A
6. What are the notable trends driving market growth?
N/A
7. Are there any restraints impacting market growth?
N/A
8. Can you provide examples of recent developments in the market?
N/A
9. What pricing options are available for accessing the report?
Pricing options include single-user, multi-user, and enterprise licenses priced at USD 3350.00, USD 5025.00, and USD 6700.00 respectively.
10. Is the market size provided in terms of value or volume?
The market size is provided in terms of value, measured in N/A and volume, measured in K.
11. Are there any specific market keywords associated with the report?
Yes, the market keyword associated with the report is "Twist Tie," which aids in identifying and referencing the specific market segment covered.
12. How do I determine which pricing option suits my needs best?
The pricing options vary based on user requirements and access needs. Individual users may opt for single-user licenses, while businesses requiring broader access may choose multi-user or enterprise licenses for cost-effective access to the report.
13. Are there any additional resources or data provided in the Twist Tie report?
While the report offers comprehensive insights, it's advisable to review the specific contents or supplementary materials provided to ascertain if additional resources or data are available.
14. How can I stay updated on further developments or reports in the Twist Tie?
To stay informed about further developments, trends, and reports in the Twist Tie, consider subscribing to industry newsletters, following relevant companies and organizations, or regularly checking reputable industry news sources and publications.
Methodology
Step 1 - Identification of Relevant Samples Size from Population Database


Step 2 - Approaches for Defining Global Market Size (Value, Volume* & Price*)

Note*: In applicable scenarios
Step 3 - Data Sources
Primary Research
- Web Analytics
- Survey Reports
- Research Institute
- Latest Research Reports
- Opinion Leaders
Secondary Research
- Annual Reports
- White Paper
- Latest Press Release
- Industry Association
- Paid Database
- Investor Presentations

Step 4 - Data Triangulation
Involves using different sources of information in order to increase the validity of a study
These sources are likely to be stakeholders in a program - participants, other researchers, program staff, other community members, and so on.
Then we put all data in single framework & apply various statistical tools to find out the dynamic on the market.
During the analysis stage, feedback from the stakeholder groups would be compared to determine areas of agreement as well as areas of divergence