
Key Insights
The global toy kitchens and play food market is experiencing robust growth, driven by increasing disposable incomes in developing economies, a rising preference for experiential learning in children, and the growing influence of social media showcasing engaging playtime scenarios. The market, estimated at $2.5 billion in 2025, is projected to exhibit a Compound Annual Growth Rate (CAGR) of 7% from 2025 to 2033, reaching approximately $4.2 billion by 2033. This growth is fueled by the introduction of innovative, interactive toy kitchens incorporating technology like smart appliances and augmented reality features. Parents are increasingly seeking educational toys that foster creativity, role-playing skills, and cognitive development, making toy kitchens and play food an attractive choice. Key players like Hamleys, Melissa & Doug, and KidKraft are capitalizing on these trends through product diversification, strategic partnerships, and effective marketing campaigns. The market is segmented by product type (e.g., wooden, plastic, electronic), price range, and distribution channel (online vs. offline). Regional variations exist, with North America and Europe currently holding significant market shares, while Asia-Pacific is expected to showcase substantial growth in the coming years due to its expanding middle class and increasing adoption of westernized play patterns.
However, several factors might restrain market growth. Fluctuations in raw material prices, particularly plastic and wood, pose a challenge to profitability. Concerns about the environmental impact of plastic toys are also leading to increased demand for sustainable, eco-friendly alternatives, requiring manufacturers to adapt their product offerings. Furthermore, intense competition among established players and new entrants necessitates continuous innovation and effective branding strategies to maintain market share. Nevertheless, the long-term outlook for the toy kitchens and play food market remains positive, driven by consistent demand from parents seeking to provide engaging and educational play experiences for their children. This necessitates a focus on delivering high-quality, durable, and safe products that meet the evolving needs and preferences of both children and parents.
Toy Kitchens and Play Food Market Report: 2019-2033
This comprehensive report provides an in-depth analysis of the global toy kitchens and play food market, offering invaluable insights for industry stakeholders, investors, and strategic decision-makers. Covering the period from 2019 to 2033, with a focus on 2025, this report unveils market dynamics, competitive landscapes, and future growth projections, empowering you to make informed decisions in this dynamic sector. The market reached a value of $XX million in 2024 and is projected to reach $XX million by 2033.
Toy Kitchens and Play Food Market Structure & Competitive Dynamics
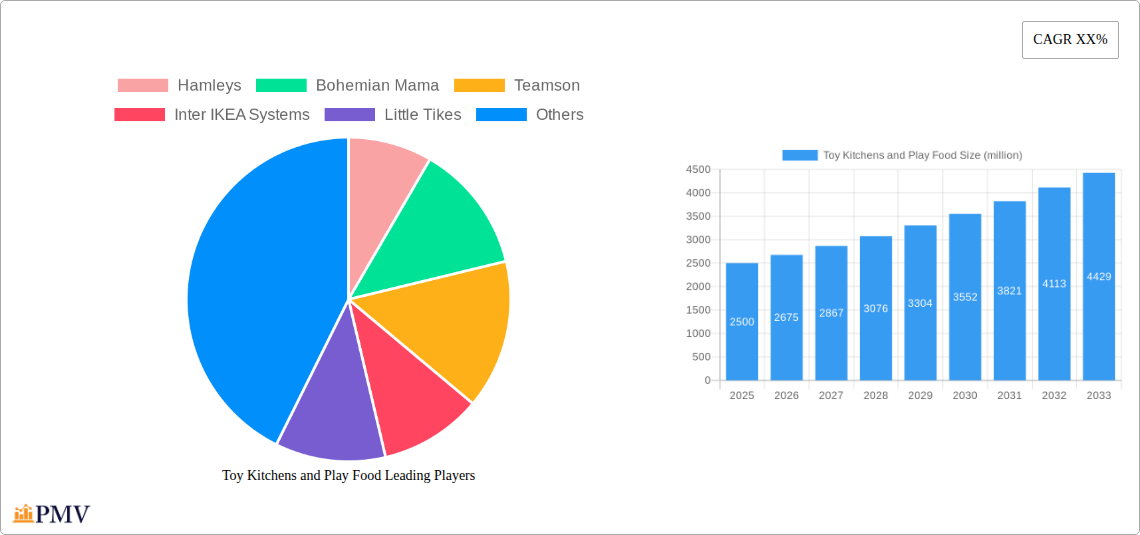
This section analyzes the competitive landscape of the toy kitchens and play food market, considering market concentration, innovation ecosystems, regulatory frameworks, product substitutes, end-user trends, and mergers & acquisitions (M&A) activities. The market exhibits a moderately fragmented structure, with several key players competing for market share. Major players like Hamleys, Bohemian Mama, Teamson, Inter IKEA Systems, Little Tikes, Melissa & Doug, KidKraft, TP Toys, Smyths Toys, and Hape Toys contribute significantly to the overall market value.
- Market Concentration: The market is characterized by a combination of large multinational corporations and smaller niche players, resulting in a moderately fragmented structure. The top 5 players hold an estimated xx% market share in 2025.
- Innovation Ecosystems: Significant innovation is driven by new material usage, interactive features (e.g., sound and light effects), and sustainable practices.
- Regulatory Frameworks: Safety standards and regulations concerning materials and manufacturing processes significantly influence market dynamics.
- Product Substitutes: Digital alternatives, such as interactive apps and online games, represent a growing competitive threat.
- End-User Trends: Growing demand for educational and eco-friendly toys, alongside a preference for durable and high-quality products, is shaping market growth.
- M&A Activities: The past five years have seen xx M&A deals, with a total value exceeding $XX million, reflecting industry consolidation efforts.
Toy Kitchens and Play Food Industry Trends & Insights
This section delves into the key trends driving the growth of the toy kitchens and play food market. The market experienced robust growth during the historical period (2019-2024), with a CAGR of xx%. This positive trend is expected to continue throughout the forecast period (2025-2033), with a projected CAGR of xx%, driven by several factors:
- Rising Disposable Incomes: Increased disposable incomes in developing economies fuel demand for premium toys.
- Growing Parent Awareness: Parents are increasingly recognizing the educational benefits of play kitchens and play food for cognitive and social development.
- Technological Advancements: The integration of smart features and interactive elements enhances play experience and market appeal.
- E-commerce Expansion: Online retail platforms provide wider accessibility to these products, boosting sales volumes.
- Shifting Consumer Preferences: Demand for eco-friendly, sustainable toys is rising, impacting material choices and manufacturing processes.
- Competitive Landscape: Intense competition necessitates continuous product innovation and diversification to maintain market position. Market penetration of online sales channels is estimated at xx% in 2025.

Dominant Markets & Segments in Toy Kitchens and Play Food
North America currently holds the largest market share in the toy kitchens and play food sector, followed by Europe. This dominance is attributed to several key factors:
- High Disposable Incomes: High disposable incomes in these regions fuel significant demand.
- Strong Retail Infrastructure: Well-developed retail networks facilitate wider product availability and accessibility.
- High Consumer Awareness: Parents are increasingly aware of the educational and developmental advantages of play kitchens.
- Favorable Demographic Trends: Stable population growth and a high percentage of families with young children contribute significantly to market size.
- Government Support: Government initiatives promoting early childhood development indirectly benefit the toy industry.
Toy Kitchens and Play Food Product Innovations
Recent product innovations have focused on incorporating realistic designs, interactive features (e.g., sounds, lights), and sustainable materials. The integration of technology, such as smart apps and voice assistants, is enhancing play experience and creating new market opportunities. The market is witnessing a shift towards toys made from recycled and sustainable materials, aligning with growing environmental concerns. This innovation directly addresses consumer demand for eco-friendly and engaging products.
Report Segmentation & Scope
This report segments the market by product type (play kitchens, play food, accessories), age group (preschool, school-aged), distribution channel (online, offline), and region (North America, Europe, Asia-Pacific, etc.). Each segment presents unique growth projections, market sizes, and competitive dynamics. For instance, the preschool segment is expected to witness significant growth due to the increasing preference for educational play, while online sales channels are expected to outpace offline channels in terms of growth rate.
Key Drivers of Toy Kitchens and Play Food Growth
Several key factors contribute to the anticipated growth of the toy kitchens and play food market. The growing disposable incomes of the middle class globally stimulate higher demand. Additionally, increasing awareness of the educational benefits of imaginative play encourages parental investments in these products. Technological innovations, like the incorporation of smart features, also contribute significantly to the market expansion.
Challenges in the Toy Kitchens and Play Food Sector
Challenges faced by the industry include rising raw material costs, increasing competition, stringent safety regulations, and potential supply chain disruptions. These factors influence pricing strategies and overall profitability, leading to varying levels of impact across the market. The market is facing the challenge of balancing cost-effectiveness with the demand for high-quality, eco-friendly products.
Leading Players in the Toy Kitchens and Play Food Market
- Hamleys
- Bohemian Mama
- Teamson
- Inter IKEA Systems
- Little Tikes
- Melissa & Doug
- KidKraft
- TP Toys
- Smyths Toys
- Hape Toys
Key Developments in Toy Kitchens and Play Food Sector
- 2022 Q4: Melissa & Doug launched a new line of eco-friendly play kitchens.
- 2023 Q1: KidKraft introduced an interactive play kitchen with smart features.
- 2023 Q3: A major merger between two leading toy manufacturers reshaped the market landscape. (Specific details omitted for confidentiality).
Strategic Toy Kitchens and Play Food Market Outlook
The toy kitchens and play food market exhibits strong growth potential over the forecast period. Continued innovation in product design and features, coupled with the increasing focus on sustainability and educational value, will drive future market expansion. Strategic partnerships, acquisitions, and expansion into emerging markets are crucial for market success in this competitive sector. The growing preference for high-quality, eco-friendly toys presents significant opportunities for businesses who align with evolving consumer preferences.
Toy Kitchens and Play Food Segmentation
-
1. Application
- 1.1. Direct Sales
- 1.2. Hypermarkets/ Supermarkets
- 1.3. Specialty Stores
- 1.4. Online retailing
- 1.5. Others
-
2. Types
- 2.1. Corner Play Kitchen
- 2.2. Large Play Kitchens
- 2.3. Toddler Play Kitchens
Toy Kitchens and Play Food Segmentation By Geography
-
1. North America
- 1.1. United States
- 1.2. Canada
- 1.3. Mexico
-
2. South America
- 2.1. Brazil
- 2.2. Argentina
- 2.3. Rest of South America
-
3. Europe
- 3.1. United Kingdom
- 3.2. Germany
- 3.3. France
- 3.4. Italy
- 3.5. Spain
- 3.6. Russia
- 3.7. Benelux
- 3.8. Nordics
- 3.9. Rest of Europe
-
4. Middle East & Africa
- 4.1. Turkey
- 4.2. Israel
- 4.3. GCC
- 4.4. North Africa
- 4.5. South Africa
- 4.6. Rest of Middle East & Africa
-
5. Asia Pacific
- 5.1. China
- 5.2. India
- 5.3. Japan
- 5.4. South Korea
- 5.5. ASEAN
- 5.6. Oceania
- 5.7. Rest of Asia Pacific

Toy Kitchens and Play Food REPORT HIGHLIGHTS
| Aspects | Details |
|---|---|
| Study Period | 2019-2033 |
| Base Year | 2024 |
| Estimated Year | 2025 |
| Forecast Period | 2025-2033 |
| Historical Period | 2019-2024 |
| Growth Rate | CAGR of XX% from 2019-2033 |
| Segmentation |
|
Table of Contents
- 1. Introduction
- 1.1. Research Scope
- 1.2. Market Segmentation
- 1.3. Research Methodology
- 1.4. Definitions and Assumptions
- 2. Executive Summary
- 2.1. Introduction
- 3. Market Dynamics
- 3.1. Introduction
- 3.2. Market Drivers
- 3.3. Market Restrains
- 3.4. Market Trends
- 4. Market Factor Analysis
- 4.1. Porters Five Forces
- 4.2. Supply/Value Chain
- 4.3. PESTEL analysis
- 4.4. Market Entropy
- 4.5. Patent/Trademark Analysis
- 5. Global Toy Kitchens and Play Food Analysis, Insights and Forecast, 2019-2031
- 5.1. Market Analysis, Insights and Forecast - by Application
- 5.1.1. Direct Sales
- 5.1.2. Hypermarkets/ Supermarkets
- 5.1.3. Specialty Stores
- 5.1.4. Online retailing
- 5.1.5. Others
- 5.2. Market Analysis, Insights and Forecast - by Types
- 5.2.1. Corner Play Kitchen
- 5.2.2. Large Play Kitchens
- 5.2.3. Toddler Play Kitchens
- 5.3. Market Analysis, Insights and Forecast - by Region
- 5.3.1. North America
- 5.3.2. South America
- 5.3.3. Europe
- 5.3.4. Middle East & Africa
- 5.3.5. Asia Pacific
- 5.1. Market Analysis, Insights and Forecast - by Application
- 6. North America Toy Kitchens and Play Food Analysis, Insights and Forecast, 2019-2031
- 6.1. Market Analysis, Insights and Forecast - by Application
- 6.1.1. Direct Sales
- 6.1.2. Hypermarkets/ Supermarkets
- 6.1.3. Specialty Stores
- 6.1.4. Online retailing
- 6.1.5. Others
- 6.2. Market Analysis, Insights and Forecast - by Types
- 6.2.1. Corner Play Kitchen
- 6.2.2. Large Play Kitchens
- 6.2.3. Toddler Play Kitchens
- 6.1. Market Analysis, Insights and Forecast - by Application
- 7. South America Toy Kitchens and Play Food Analysis, Insights and Forecast, 2019-2031
- 7.1. Market Analysis, Insights and Forecast - by Application
- 7.1.1. Direct Sales
- 7.1.2. Hypermarkets/ Supermarkets
- 7.1.3. Specialty Stores
- 7.1.4. Online retailing
- 7.1.5. Others
- 7.2. Market Analysis, Insights and Forecast - by Types
- 7.2.1. Corner Play Kitchen
- 7.2.2. Large Play Kitchens
- 7.2.3. Toddler Play Kitchens
- 7.1. Market Analysis, Insights and Forecast - by Application
- 8. Europe Toy Kitchens and Play Food Analysis, Insights and Forecast, 2019-2031
- 8.1. Market Analysis, Insights and Forecast - by Application
- 8.1.1. Direct Sales
- 8.1.2. Hypermarkets/ Supermarkets
- 8.1.3. Specialty Stores
- 8.1.4. Online retailing
- 8.1.5. Others
- 8.2. Market Analysis, Insights and Forecast - by Types
- 8.2.1. Corner Play Kitchen
- 8.2.2. Large Play Kitchens
- 8.2.3. Toddler Play Kitchens
- 8.1. Market Analysis, Insights and Forecast - by Application
- 9. Middle East & Africa Toy Kitchens and Play Food Analysis, Insights and Forecast, 2019-2031
- 9.1. Market Analysis, Insights and Forecast - by Application
- 9.1.1. Direct Sales
- 9.1.2. Hypermarkets/ Supermarkets
- 9.1.3. Specialty Stores
- 9.1.4. Online retailing
- 9.1.5. Others
- 9.2. Market Analysis, Insights and Forecast - by Types
- 9.2.1. Corner Play Kitchen
- 9.2.2. Large Play Kitchens
- 9.2.3. Toddler Play Kitchens
- 9.1. Market Analysis, Insights and Forecast - by Application
- 10. Asia Pacific Toy Kitchens and Play Food Analysis, Insights and Forecast, 2019-2031
- 10.1. Market Analysis, Insights and Forecast - by Application
- 10.1.1. Direct Sales
- 10.1.2. Hypermarkets/ Supermarkets
- 10.1.3. Specialty Stores
- 10.1.4. Online retailing
- 10.1.5. Others
- 10.2. Market Analysis, Insights and Forecast - by Types
- 10.2.1. Corner Play Kitchen
- 10.2.2. Large Play Kitchens
- 10.2.3. Toddler Play Kitchens
- 10.1. Market Analysis, Insights and Forecast - by Application
- 11. Competitive Analysis
- 11.1. Global Market Share Analysis 2024
- 11.2. Company Profiles
- 11.2.1 Hamleys
- 11.2.1.1. Overview
- 11.2.1.2. Products
- 11.2.1.3. SWOT Analysis
- 11.2.1.4. Recent Developments
- 11.2.1.5. Financials (Based on Availability)
- 11.2.2 Bohemian Mama
- 11.2.2.1. Overview
- 11.2.2.2. Products
- 11.2.2.3. SWOT Analysis
- 11.2.2.4. Recent Developments
- 11.2.2.5. Financials (Based on Availability)
- 11.2.3 Teamson
- 11.2.3.1. Overview
- 11.2.3.2. Products
- 11.2.3.3. SWOT Analysis
- 11.2.3.4. Recent Developments
- 11.2.3.5. Financials (Based on Availability)
- 11.2.4 Inter IKEA Systems
- 11.2.4.1. Overview
- 11.2.4.2. Products
- 11.2.4.3. SWOT Analysis
- 11.2.4.4. Recent Developments
- 11.2.4.5. Financials (Based on Availability)
- 11.2.5 Little Tikes
- 11.2.5.1. Overview
- 11.2.5.2. Products
- 11.2.5.3. SWOT Analysis
- 11.2.5.4. Recent Developments
- 11.2.5.5. Financials (Based on Availability)
- 11.2.6 Melissa & Doug
- 11.2.6.1. Overview
- 11.2.6.2. Products
- 11.2.6.3. SWOT Analysis
- 11.2.6.4. Recent Developments
- 11.2.6.5. Financials (Based on Availability)
- 11.2.7 KidKraft
- 11.2.7.1. Overview
- 11.2.7.2. Products
- 11.2.7.3. SWOT Analysis
- 11.2.7.4. Recent Developments
- 11.2.7.5. Financials (Based on Availability)
- 11.2.8 TP Toys
- 11.2.8.1. Overview
- 11.2.8.2. Products
- 11.2.8.3. SWOT Analysis
- 11.2.8.4. Recent Developments
- 11.2.8.5. Financials (Based on Availability)
- 11.2.9 Smyths Toys
- 11.2.9.1. Overview
- 11.2.9.2. Products
- 11.2.9.3. SWOT Analysis
- 11.2.9.4. Recent Developments
- 11.2.9.5. Financials (Based on Availability)
- 11.2.10 Hape Toys
- 11.2.10.1. Overview
- 11.2.10.2. Products
- 11.2.10.3. SWOT Analysis
- 11.2.10.4. Recent Developments
- 11.2.10.5. Financials (Based on Availability)
- 11.2.1 Hamleys
List of Figures
- Figure 1: Global Toy Kitchens and Play Food Revenue Breakdown (million, %) by Region 2024 & 2032
- Figure 2: North America Toy Kitchens and Play Food Revenue (million), by Application 2024 & 2032
- Figure 3: North America Toy Kitchens and Play Food Revenue Share (%), by Application 2024 & 2032
- Figure 4: North America Toy Kitchens and Play Food Revenue (million), by Types 2024 & 2032
- Figure 5: North America Toy Kitchens and Play Food Revenue Share (%), by Types 2024 & 2032
- Figure 6: North America Toy Kitchens and Play Food Revenue (million), by Country 2024 & 2032
- Figure 7: North America Toy Kitchens and Play Food Revenue Share (%), by Country 2024 & 2032
- Figure 8: South America Toy Kitchens and Play Food Revenue (million), by Application 2024 & 2032
- Figure 9: South America Toy Kitchens and Play Food Revenue Share (%), by Application 2024 & 2032
- Figure 10: South America Toy Kitchens and Play Food Revenue (million), by Types 2024 & 2032
- Figure 11: South America Toy Kitchens and Play Food Revenue Share (%), by Types 2024 & 2032
- Figure 12: South America Toy Kitchens and Play Food Revenue (million), by Country 2024 & 2032
- Figure 13: South America Toy Kitchens and Play Food Revenue Share (%), by Country 2024 & 2032
- Figure 14: Europe Toy Kitchens and Play Food Revenue (million), by Application 2024 & 2032
- Figure 15: Europe Toy Kitchens and Play Food Revenue Share (%), by Application 2024 & 2032
- Figure 16: Europe Toy Kitchens and Play Food Revenue (million), by Types 2024 & 2032
- Figure 17: Europe Toy Kitchens and Play Food Revenue Share (%), by Types 2024 & 2032
- Figure 18: Europe Toy Kitchens and Play Food Revenue (million), by Country 2024 & 2032
- Figure 19: Europe Toy Kitchens and Play Food Revenue Share (%), by Country 2024 & 2032
- Figure 20: Middle East & Africa Toy Kitchens and Play Food Revenue (million), by Application 2024 & 2032
- Figure 21: Middle East & Africa Toy Kitchens and Play Food Revenue Share (%), by Application 2024 & 2032
- Figure 22: Middle East & Africa Toy Kitchens and Play Food Revenue (million), by Types 2024 & 2032
- Figure 23: Middle East & Africa Toy Kitchens and Play Food Revenue Share (%), by Types 2024 & 2032
- Figure 24: Middle East & Africa Toy Kitchens and Play Food Revenue (million), by Country 2024 & 2032
- Figure 25: Middle East & Africa Toy Kitchens and Play Food Revenue Share (%), by Country 2024 & 2032
- Figure 26: Asia Pacific Toy Kitchens and Play Food Revenue (million), by Application 2024 & 2032
- Figure 27: Asia Pacific Toy Kitchens and Play Food Revenue Share (%), by Application 2024 & 2032
- Figure 28: Asia Pacific Toy Kitchens and Play Food Revenue (million), by Types 2024 & 2032
- Figure 29: Asia Pacific Toy Kitchens and Play Food Revenue Share (%), by Types 2024 & 2032
- Figure 30: Asia Pacific Toy Kitchens and Play Food Revenue (million), by Country 2024 & 2032
- Figure 31: Asia Pacific Toy Kitchens and Play Food Revenue Share (%), by Country 2024 & 2032
List of Tables
- Table 1: Global Toy Kitchens and Play Food Revenue million Forecast, by Region 2019 & 2032
- Table 2: Global Toy Kitchens and Play Food Revenue million Forecast, by Application 2019 & 2032
- Table 3: Global Toy Kitchens and Play Food Revenue million Forecast, by Types 2019 & 2032
- Table 4: Global Toy Kitchens and Play Food Revenue million Forecast, by Region 2019 & 2032
- Table 5: Global Toy Kitchens and Play Food Revenue million Forecast, by Application 2019 & 2032
- Table 6: Global Toy Kitchens and Play Food Revenue million Forecast, by Types 2019 & 2032
- Table 7: Global Toy Kitchens and Play Food Revenue million Forecast, by Country 2019 & 2032
- Table 8: United States Toy Kitchens and Play Food Revenue (million) Forecast, by Application 2019 & 2032
- Table 9: Canada Toy Kitchens and Play Food Revenue (million) Forecast, by Application 2019 & 2032
- Table 10: Mexico Toy Kitchens and Play Food Revenue (million) Forecast, by Application 2019 & 2032
- Table 11: Global Toy Kitchens and Play Food Revenue million Forecast, by Application 2019 & 2032
- Table 12: Global Toy Kitchens and Play Food Revenue million Forecast, by Types 2019 & 2032
- Table 13: Global Toy Kitchens and Play Food Revenue million Forecast, by Country 2019 & 2032
- Table 14: Brazil Toy Kitchens and Play Food Revenue (million) Forecast, by Application 2019 & 2032
- Table 15: Argentina Toy Kitchens and Play Food Revenue (million) Forecast, by Application 2019 & 2032
- Table 16: Rest of South America Toy Kitchens and Play Food Revenue (million) Forecast, by Application 2019 & 2032
- Table 17: Global Toy Kitchens and Play Food Revenue million Forecast, by Application 2019 & 2032
- Table 18: Global Toy Kitchens and Play Food Revenue million Forecast, by Types 2019 & 2032
- Table 19: Global Toy Kitchens and Play Food Revenue million Forecast, by Country 2019 & 2032
- Table 20: United Kingdom Toy Kitchens and Play Food Revenue (million) Forecast, by Application 2019 & 2032
- Table 21: Germany Toy Kitchens and Play Food Revenue (million) Forecast, by Application 2019 & 2032
- Table 22: France Toy Kitchens and Play Food Revenue (million) Forecast, by Application 2019 & 2032
- Table 23: Italy Toy Kitchens and Play Food Revenue (million) Forecast, by Application 2019 & 2032
- Table 24: Spain Toy Kitchens and Play Food Revenue (million) Forecast, by Application 2019 & 2032
- Table 25: Russia Toy Kitchens and Play Food Revenue (million) Forecast, by Application 2019 & 2032
- Table 26: Benelux Toy Kitchens and Play Food Revenue (million) Forecast, by Application 2019 & 2032
- Table 27: Nordics Toy Kitchens and Play Food Revenue (million) Forecast, by Application 2019 & 2032
- Table 28: Rest of Europe Toy Kitchens and Play Food Revenue (million) Forecast, by Application 2019 & 2032
- Table 29: Global Toy Kitchens and Play Food Revenue million Forecast, by Application 2019 & 2032
- Table 30: Global Toy Kitchens and Play Food Revenue million Forecast, by Types 2019 & 2032
- Table 31: Global Toy Kitchens and Play Food Revenue million Forecast, by Country 2019 & 2032
- Table 32: Turkey Toy Kitchens and Play Food Revenue (million) Forecast, by Application 2019 & 2032
- Table 33: Israel Toy Kitchens and Play Food Revenue (million) Forecast, by Application 2019 & 2032
- Table 34: GCC Toy Kitchens and Play Food Revenue (million) Forecast, by Application 2019 & 2032
- Table 35: North Africa Toy Kitchens and Play Food Revenue (million) Forecast, by Application 2019 & 2032
- Table 36: South Africa Toy Kitchens and Play Food Revenue (million) Forecast, by Application 2019 & 2032
- Table 37: Rest of Middle East & Africa Toy Kitchens and Play Food Revenue (million) Forecast, by Application 2019 & 2032
- Table 38: Global Toy Kitchens and Play Food Revenue million Forecast, by Application 2019 & 2032
- Table 39: Global Toy Kitchens and Play Food Revenue million Forecast, by Types 2019 & 2032
- Table 40: Global Toy Kitchens and Play Food Revenue million Forecast, by Country 2019 & 2032
- Table 41: China Toy Kitchens and Play Food Revenue (million) Forecast, by Application 2019 & 2032
- Table 42: India Toy Kitchens and Play Food Revenue (million) Forecast, by Application 2019 & 2032
- Table 43: Japan Toy Kitchens and Play Food Revenue (million) Forecast, by Application 2019 & 2032
- Table 44: South Korea Toy Kitchens and Play Food Revenue (million) Forecast, by Application 2019 & 2032
- Table 45: ASEAN Toy Kitchens and Play Food Revenue (million) Forecast, by Application 2019 & 2032
- Table 46: Oceania Toy Kitchens and Play Food Revenue (million) Forecast, by Application 2019 & 2032
- Table 47: Rest of Asia Pacific Toy Kitchens and Play Food Revenue (million) Forecast, by Application 2019 & 2032
Frequently Asked Questions
1. What is the projected Compound Annual Growth Rate (CAGR) of the Toy Kitchens and Play Food?
The projected CAGR is approximately XX%.
2. Which companies are prominent players in the Toy Kitchens and Play Food?
Key companies in the market include Hamleys, Bohemian Mama, Teamson, Inter IKEA Systems, Little Tikes, Melissa & Doug, KidKraft, TP Toys, Smyths Toys, Hape Toys.
3. What are the main segments of the Toy Kitchens and Play Food?
The market segments include Application, Types.
4. Can you provide details about the market size?
The market size is estimated to be USD XXX million as of 2022.
5. What are some drivers contributing to market growth?
N/A
6. What are the notable trends driving market growth?
N/A
7. Are there any restraints impacting market growth?
N/A
8. Can you provide examples of recent developments in the market?
N/A
9. What pricing options are available for accessing the report?
Pricing options include single-user, multi-user, and enterprise licenses priced at USD 2900.00, USD 4350.00, and USD 5800.00 respectively.
10. Is the market size provided in terms of value or volume?
The market size is provided in terms of value, measured in million.
11. Are there any specific market keywords associated with the report?
Yes, the market keyword associated with the report is "Toy Kitchens and Play Food," which aids in identifying and referencing the specific market segment covered.
12. How do I determine which pricing option suits my needs best?
The pricing options vary based on user requirements and access needs. Individual users may opt for single-user licenses, while businesses requiring broader access may choose multi-user or enterprise licenses for cost-effective access to the report.
13. Are there any additional resources or data provided in the Toy Kitchens and Play Food report?
While the report offers comprehensive insights, it's advisable to review the specific contents or supplementary materials provided to ascertain if additional resources or data are available.
14. How can I stay updated on further developments or reports in the Toy Kitchens and Play Food?
To stay informed about further developments, trends, and reports in the Toy Kitchens and Play Food, consider subscribing to industry newsletters, following relevant companies and organizations, or regularly checking reputable industry news sources and publications.
Methodology
Step 1 - Identification of Relevant Samples Size from Population Database


Step 2 - Approaches for Defining Global Market Size (Value, Volume* & Price*)

Note*: In applicable scenarios
Step 3 - Data Sources
Primary Research
- Web Analytics
- Survey Reports
- Research Institute
- Latest Research Reports
- Opinion Leaders
Secondary Research
- Annual Reports
- White Paper
- Latest Press Release
- Industry Association
- Paid Database
- Investor Presentations

Step 4 - Data Triangulation
Involves using different sources of information in order to increase the validity of a study
These sources are likely to be stakeholders in a program - participants, other researchers, program staff, other community members, and so on.
Then we put all data in single framework & apply various statistical tools to find out the dynamic on the market.
During the analysis stage, feedback from the stakeholder groups would be compared to determine areas of agreement as well as areas of divergence


