

Key Insights
The global titanium dioxide (TiO2) market, valued at approximately $19.06 billion in the base year 2025, is projected to expand at a compound annual growth rate (CAGR) of 7.1%. This significant growth is propelled by escalating demand from key sectors. The construction industry's robust expansion worldwide drives substantial demand for TiO2 in paints and coatings, a primary application. Increased utilization of TiO2 in plastics for enhanced durability and aesthetic appeal also contributes to market expansion. Further fueling market growth is the rising demand from the paper and pulp sector for brightening agents and the cosmetics industry for its whitening and UV-blocking capabilities. Asia-Pacific regions, particularly China and India, exhibit strong growth due to rapid industrialization and urbanization. However, market expansion faces restraints from fluctuating raw material costs and environmental considerations associated with TiO2 production. The market is segmented by grade (rutile and anatase) and application, with rutile holding dominance due to its superior performance and broad applicability. Leading companies such as INEOS, Evonik, and Tronox are actively pursuing capacity enhancements and strategic acquisitions to strengthen their market positions.
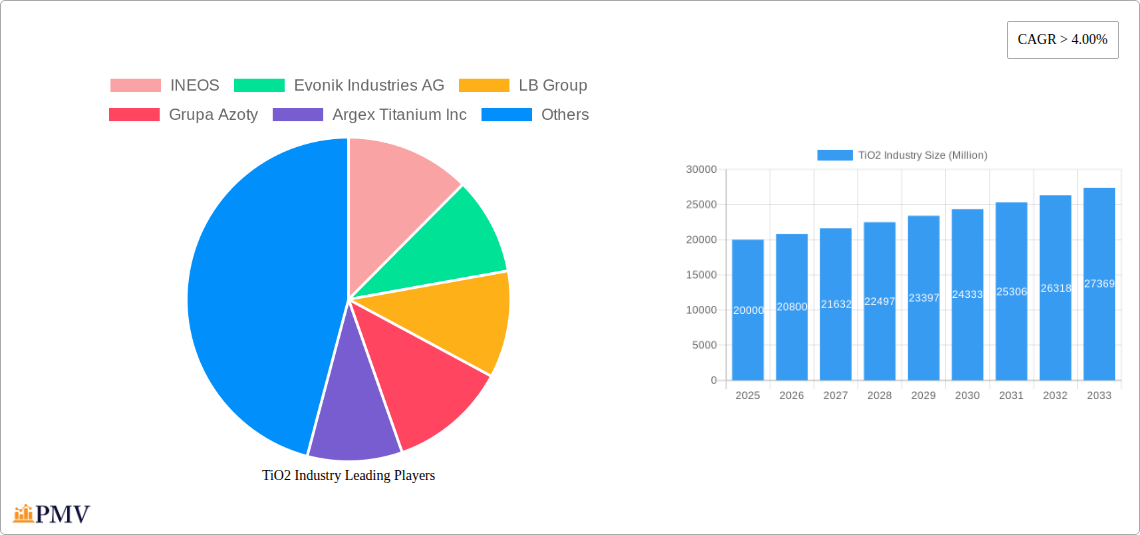
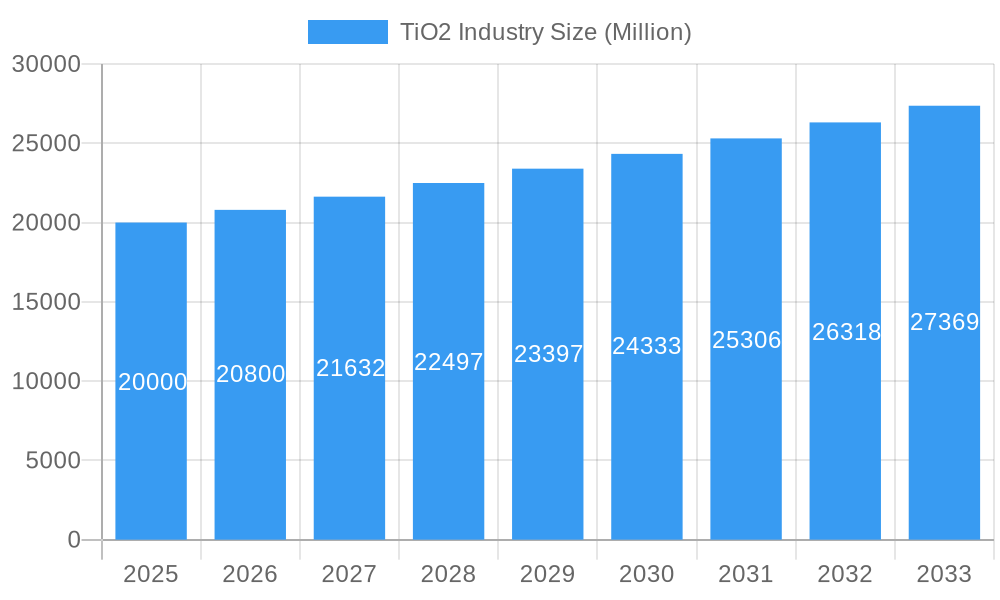
TiO2 Industry Market Size (In Billion)
The competitive environment features a blend of established global corporations and agile regional entities. While large players leverage economies of scale and extensive distribution, smaller firms demonstrate flexibility and innovation, targeting niche applications or specialized TiO2 grades. Anticipated market consolidation through mergers and acquisitions will reshape the industry structure. Ongoing advancements in TiO2 production, prioritizing sustainability and efficiency, will be pivotal to future market trends. Government regulations pertaining to environmental impact and the investigation of alternative pigment technologies will also shape market trajectory. The TiO2 market's long-term outlook remains optimistic, supported by consistent demand from critical application areas and continuous industry innovation.
TiO2 Industry Company Market Share
TiO2 Industry: A Comprehensive Market Report (2019-2033)
This in-depth report provides a comprehensive analysis of the TiO2 industry, covering market structure, competitive dynamics, growth drivers, challenges, and future outlook. The study period spans from 2019 to 2033, with 2025 serving as the base and estimated year. The report offers invaluable insights for industry stakeholders, including manufacturers, investors, and researchers. The global TiO2 market is projected to reach xx Million by 2033, exhibiting a CAGR of xx% during the forecast period (2025-2033).
TiO2 Industry Market Structure & Competitive Dynamics
The TiO2 industry is characterized by a moderately concentrated market structure, with a few major players holding significant market share. INEOS, Evonik Industries AG, and Tronox Holdings PLC are among the leading global producers, collectively controlling a significant portion of the global market. Market share fluctuates based on production capacity, technological advancements, and pricing strategies. The industry’s innovation ecosystem is dynamic, driven by continuous R&D investments in enhancing pigment properties, production efficiency, and sustainability.
Regulatory frameworks, particularly concerning environmental regulations and safety standards for TiO2 production and handling, play a crucial role in shaping the industry landscape. Stringent environmental regulations are influencing the adoption of more sustainable production methods and driving innovation in waste reduction and resource efficiency. The industry faces competition from alternative pigments, such as zinc oxide and calcium carbonate, which necessitates ongoing innovation and product differentiation. Furthermore, M&A activities have significantly impacted the market consolidation. Recent deals, while specific values are unavailable (xx Million), have been primarily driven by companies seeking to expand their production capacity and geographical reach.
- Market Concentration: Moderately concentrated, with top players holding xx% market share.
- Innovation Ecosystem: Active R&D in pigment properties, production efficiency, and sustainability.
- Regulatory Frameworks: Stringent environmental regulations impacting production methods.
- Product Substitutes: Competition from alternative pigments like zinc oxide and calcium carbonate.
- M&A Activities: Consolidation through mergers and acquisitions (values unavailable - xx Million).
- End-User Trends: Growing demand from key sectors like paints & coatings and plastics.
TiO2 Industry Industry Trends & Insights
The TiO2 industry is witnessing robust growth driven by increasing demand from diverse sectors. The paints and coatings sector remains the dominant application area, fueled by the construction boom and rising infrastructure development globally. The plastics industry also demonstrates significant demand for TiO2 as a pigment and additive, boosted by the increasing production of plastic products. Consumer preference for brighter and more durable products further fuels the market. Technological advancements, such as the development of nano-TiO2 and improved production processes, contribute significantly to efficiency gains and enhance product performance. Competitive dynamics are primarily driven by pricing strategies, innovation in product quality, and capacity expansions. The global market exhibits regional variations in growth rates, primarily influenced by economic activity and infrastructural development in different regions.
The compound annual growth rate (CAGR) for the TiO2 market during the study period (2019-2024) is estimated to be xx%, with market penetration in key application segments ranging from xx% to xx%. Technological disruptions, such as the adoption of advanced production techniques and the development of sustainable TiO2 alternatives, are influencing market dynamics and shaping the competitive landscape.
Dominant Markets & Segments in TiO2 Industry
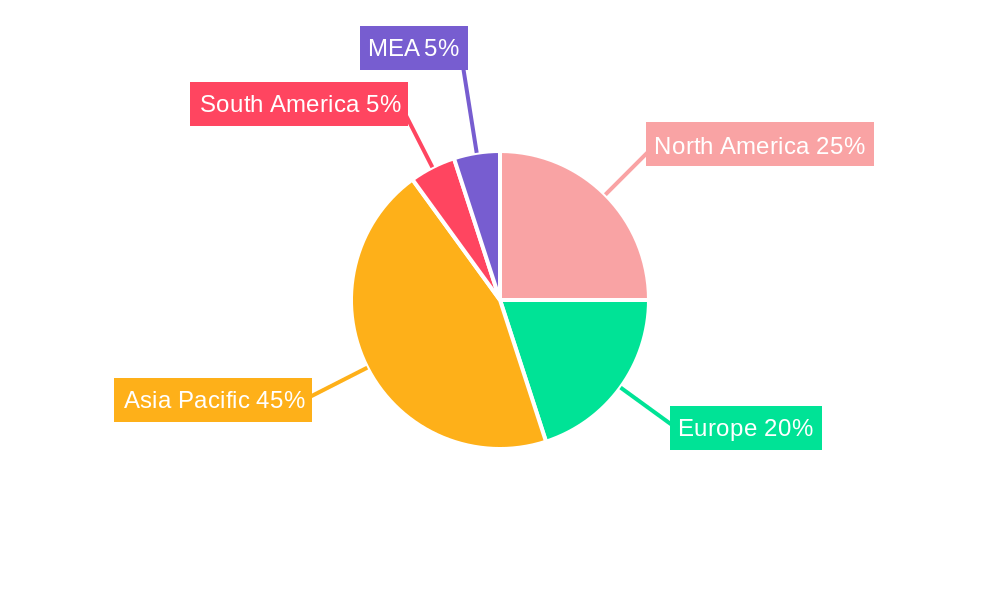
The global TiO2 market is geographically diverse, with significant contributions from regions like Asia-Pacific, North America, and Europe. Specific country dominance within these regions varies depending on factors such as industrial activity and manufacturing capabilities. Among the TiO2 grades, Rutile holds the largest market share due to its superior properties compared to Anatase. In terms of applications, Paints and Coatings accounts for the largest segment, driven by the construction, automotive, and consumer goods industries.
- Leading Region: Asia-Pacific (due to strong economic growth and construction activity).
- Leading Grade: Rutile (superior properties, higher market share).
- Leading Application: Paints and Coatings (dominant market share due to construction and manufacturing).
Key Drivers:
- Paints & Coatings: Increased construction activity, automotive production, and consumer goods manufacturing.
- Plastics: Growing demand for plastic products across various sectors.
- Paper & Pulp: Demand for high-brightness papers and packaging.
- Cosmetics: Demand for brighter and more vibrant cosmetic products.
Dominance Analysis: Asia-Pacific’s dominance stems from its robust economic growth, rising infrastructure development, and expanding manufacturing capabilities. Rutile's leading position arises from its superior properties like higher refractive index and opacity compared to Anatase, offering enhanced performance in applications. The Paints and Coatings segment's dominance is directly correlated with the significant demand from diverse industries.
TiO2 Industry Product Innovations
Recent innovations focus on developing TiO2 pigments with enhanced properties such as improved brightness, opacity, and dispersibility. Nanotechnology plays a significant role, leading to the creation of nano-TiO2 with superior performance characteristics. These advancements enable the development of products tailored to specific applications, offering competitive advantages to manufacturers. Product developments also emphasize improving sustainability through environmentally friendly production methods and minimizing environmental impact.
Report Segmentation & Scope
This report segments the TiO2 market based on grade (Rutile and Anatase) and application (Paints and Coatings, Plastics, Paper and Pulp, Cosmetics, and Other Applications – Leather, Textiles). Growth projections and market sizes are provided for each segment, detailing competitive dynamics within each area. Market analysis assesses each segment's current size, growth rate, and future potential. The report examines the competitive landscape for each segment, identifying key players and their market strategies.
- Grade: Rutile and Anatase, with Rutile holding a larger market share.
- Application: Paints & Coatings, Plastics, Paper & Pulp, Cosmetics, and Other Applications. Each application segment displays unique growth trajectories and competitive dynamics.
Key Drivers of TiO2 Industry Growth
The TiO2 industry's growth is propelled by several factors. The rising global construction sector and the growing demand for durable and aesthetically pleasing products are key drivers. Advancements in TiO2 production technology resulting in higher efficiency and lower costs further boost industry expansion. Increasing consumer preference for brighter and more vibrant colors across numerous applications fuels market growth. Finally, supportive government policies and infrastructural investments in several regions contribute significantly to market expansion.
Challenges in the TiO2 Industry Sector
The TiO2 industry faces several challenges, including stringent environmental regulations that necessitate higher production costs and compliance complexities. Fluctuations in raw material prices, particularly ilmenite and titanium slag, impact profitability. Intense competition among major players necessitates constant innovation and efficient production to maintain market share. Supply chain disruptions and logistical complexities can negatively impact production and delivery timelines. The environmental impact of TiO2 production and disposal remains a subject of increasing scrutiny and necessitates continuous improvement in sustainability practices. These factors collectively present significant hurdles for the industry's continued growth.
Leading Players in the TiO2 Industry Market
- INEOS
- Evonik Industries AG
- LB Group
- Grupa Azoty
- Argex Titanium Inc
- Kemipex
- Venator Materials PLC
- TAYCA
- The Chemours Company
- Tronox Holdings PLC
- Precheza
- KRONOS Worldwide Inc
- The Kish Company Inc
Key Developments in TiO2 Industry Sector
- August 2022: Chemours commenced mining at its new Florida sand mine, boosting TiO2 production capacity. This expansion is expected to significantly increase Chemours' ilmenite supply for its chloride-based TiO2 synthesis, impacting market dynamics.
- January 2022: LB Group announced a CNY 1 billion (USD 157.6 million) investment in a new 200ktpa TiO2 pigment finishing plant in Xiangyang, China. This expansion will significantly boost their production capacity, affecting their market share and competitive positioning.
Strategic TiO2 Industry Market Outlook
The TiO2 industry is poised for continued growth, driven by increasing demand from key sectors. Future market potential is significant, particularly in developing economies with robust infrastructure development. Strategic opportunities lie in developing sustainable TiO2 production methods, innovating in higher-performance pigments, and expanding into new applications. Companies that proactively address sustainability concerns, embrace technological advancements, and efficiently manage supply chains are well-positioned to capitalize on future growth opportunities.
TiO2 Industry Segmentation
-
1. Grade
- 1.1. Rutile
- 1.2. Anatase
-
2. Application
- 2.1. Paints and Coatings
- 2.2. Plastics
- 2.3. Paper and Pulp
- 2.4. Cosmetics
- 2.5. Other Applications (Leather, Textiles)
TiO2 Industry Segmentation By Geography
-
1. Asia Pacific
- 1.1. China
- 1.2. India
- 1.3. Japan
- 1.4. South Korea
- 1.5. Rest of Asia Pacific
-
2. North America
- 2.1. United States
- 2.2. Canada
- 2.3. Mexico
-
3. Europe
- 3.1. Germany
- 3.2. United Kingdom
- 3.3. France
- 3.4. Italy
- 3.5. Rest of Europe
-
4. South America
- 4.1. Brazil
- 4.2. Argentina
- 4.3. Rest of South America
-
5. Middle East and Africa
- 5.1. Saudi Arabia
- 5.2. South Africa
- 5.3. Rest of Middle East and Africa
TiO2 Industry Regional Market Share
Geographic Coverage of TiO2 Industry
TiO2 Industry REPORT HIGHLIGHTS
| Aspects | Details |
|---|---|
| Study Period | 2020-2034 |
| Base Year | 2025 |
| Estimated Year | 2026 |
| Forecast Period | 2026-2034 |
| Historical Period | 2020-2025 |
| Growth Rate | CAGR of 7.1% from 2020-2034 |
| Segmentation |
|
Table of Contents
- 1. Introduction
- 1.1. Research Scope
- 1.2. Market Segmentation
- 1.3. Research Objective
- 1.4. Definitions and Assumptions
- 2. Executive Summary
- 2.1. Market Snapshot
- 3. Market Dynamics
- 3.1. Market Drivers
- 3.2. Market Restrains
- 3.3. Market Trends
- 3.4. Market Opportunities
- 4. Market Factor Analysis
- 4.1. Porters Five Forces
- 4.1.1. Bargaining Power of Suppliers
- 4.1.2. Bargaining Power of Buyers
- 4.1.3. Threat of New Entrants
- 4.1.4. Threat of Substitutes
- 4.1.5. Competitive Rivalry
- 4.2. PESTEL analysis
- 4.3. BCG Analysis
- 4.3.1. Stars (High Growth, High Market Share)
- 4.3.2. Cash Cows (Low Growth, High Market Share)
- 4.3.3. Question Mark (High Growth, Low Market Share)
- 4.3.4. Dogs (Low Growth, Low Market Share)
- 4.4. Ansoff Matrix Analysis
- 4.5. Supply Chain Analysis
- 4.6. Regulatory Landscape
- 4.7. Current Market Potential and Opportunity Assessment (TAM–SAM–SOM Framework)
- 4.8. PMV Analyst Note
- 4.1. Porters Five Forces
- 5. Market Analysis, Insights and Forecast 2021-2033
- 5.1. Market Analysis, Insights and Forecast - by Grade
- 5.1.1. Rutile
- 5.1.2. Anatase
- 5.2. Market Analysis, Insights and Forecast - by Application
- 5.2.1. Paints and Coatings
- 5.2.2. Plastics
- 5.2.3. Paper and Pulp
- 5.2.4. Cosmetics
- 5.2.5. Other Applications (Leather, Textiles)
- 5.3. Market Analysis, Insights and Forecast - by Region
- 5.3.1. Asia Pacific
- 5.3.2. North America
- 5.3.3. Europe
- 5.3.4. South America
- 5.3.5. Middle East and Africa
- 5.1. Market Analysis, Insights and Forecast - by Grade
- 6. Global TiO2 Industry Analysis, Insights and Forecast, 2021-2033
- 6.1. Market Analysis, Insights and Forecast - by Grade
- 6.1.1. Rutile
- 6.1.2. Anatase
- 6.2. Market Analysis, Insights and Forecast - by Application
- 6.2.1. Paints and Coatings
- 6.2.2. Plastics
- 6.2.3. Paper and Pulp
- 6.2.4. Cosmetics
- 6.2.5. Other Applications (Leather, Textiles)
- 6.1. Market Analysis, Insights and Forecast - by Grade
- 7. Asia Pacific TiO2 Industry Analysis, Insights and Forecast, 2020-2032
- 7.1. Market Analysis, Insights and Forecast - by Grade
- 7.1.1. Rutile
- 7.1.2. Anatase
- 7.2. Market Analysis, Insights and Forecast - by Application
- 7.2.1. Paints and Coatings
- 7.2.2. Plastics
- 7.2.3. Paper and Pulp
- 7.2.4. Cosmetics
- 7.2.5. Other Applications (Leather, Textiles)
- 7.1. Market Analysis, Insights and Forecast - by Grade
- 8. North America TiO2 Industry Analysis, Insights and Forecast, 2020-2032
- 8.1. Market Analysis, Insights and Forecast - by Grade
- 8.1.1. Rutile
- 8.1.2. Anatase
- 8.2. Market Analysis, Insights and Forecast - by Application
- 8.2.1. Paints and Coatings
- 8.2.2. Plastics
- 8.2.3. Paper and Pulp
- 8.2.4. Cosmetics
- 8.2.5. Other Applications (Leather, Textiles)
- 8.1. Market Analysis, Insights and Forecast - by Grade
- 9. Europe TiO2 Industry Analysis, Insights and Forecast, 2020-2032
- 9.1. Market Analysis, Insights and Forecast - by Grade
- 9.1.1. Rutile
- 9.1.2. Anatase
- 9.2. Market Analysis, Insights and Forecast - by Application
- 9.2.1. Paints and Coatings
- 9.2.2. Plastics
- 9.2.3. Paper and Pulp
- 9.2.4. Cosmetics
- 9.2.5. Other Applications (Leather, Textiles)
- 9.1. Market Analysis, Insights and Forecast - by Grade
- 10. South America TiO2 Industry Analysis, Insights and Forecast, 2020-2032
- 10.1. Market Analysis, Insights and Forecast - by Grade
- 10.1.1. Rutile
- 10.1.2. Anatase
- 10.2. Market Analysis, Insights and Forecast - by Application
- 10.2.1. Paints and Coatings
- 10.2.2. Plastics
- 10.2.3. Paper and Pulp
- 10.2.4. Cosmetics
- 10.2.5. Other Applications (Leather, Textiles)
- 10.1. Market Analysis, Insights and Forecast - by Grade
- 11. Middle East and Africa TiO2 Industry Analysis, Insights and Forecast, 2020-2032
- 11.1. Market Analysis, Insights and Forecast - by Grade
- 11.1.1. Rutile
- 11.1.2. Anatase
- 11.2. Market Analysis, Insights and Forecast - by Application
- 11.2.1. Paints and Coatings
- 11.2.2. Plastics
- 11.2.3. Paper and Pulp
- 11.2.4. Cosmetics
- 11.2.5. Other Applications (Leather, Textiles)
- 11.1. Market Analysis, Insights and Forecast - by Grade
- 12. Competitive Analysis
- 12.1. Company Profiles
- 12.1.1 INEOS
- 12.1.1.1. Company Overview
- 12.1.1.2. Products
- 12.1.1.3. Company Financials
- 12.1.1.4. SWOT Analysis
- 12.1.2 Evonik Industries AG
- 12.1.2.1. Company Overview
- 12.1.2.2. Products
- 12.1.2.3. Company Financials
- 12.1.2.4. SWOT Analysis
- 12.1.3 LB Group
- 12.1.3.1. Company Overview
- 12.1.3.2. Products
- 12.1.3.3. Company Financials
- 12.1.3.4. SWOT Analysis
- 12.1.4 Grupa Azoty
- 12.1.4.1. Company Overview
- 12.1.4.2. Products
- 12.1.4.3. Company Financials
- 12.1.4.4. SWOT Analysis
- 12.1.5 Argex Titanium Inc
- 12.1.5.1. Company Overview
- 12.1.5.2. Products
- 12.1.5.3. Company Financials
- 12.1.5.4. SWOT Analysis
- 12.1.6 Kemipex
- 12.1.6.1. Company Overview
- 12.1.6.2. Products
- 12.1.6.3. Company Financials
- 12.1.6.4. SWOT Analysis
- 12.1.7 Venator Materials PLC
- 12.1.7.1. Company Overview
- 12.1.7.2. Products
- 12.1.7.3. Company Financials
- 12.1.7.4. SWOT Analysis
- 12.1.8 TAYCA
- 12.1.8.1. Company Overview
- 12.1.8.2. Products
- 12.1.8.3. Company Financials
- 12.1.8.4. SWOT Analysis
- 12.1.9 The Chemours Company
- 12.1.9.1. Company Overview
- 12.1.9.2. Products
- 12.1.9.3. Company Financials
- 12.1.9.4. SWOT Analysis
- 12.1.10 Tronox Holdings PLC
- 12.1.10.1. Company Overview
- 12.1.10.2. Products
- 12.1.10.3. Company Financials
- 12.1.10.4. SWOT Analysis
- 12.1.11 Precheza
- 12.1.11.1. Company Overview
- 12.1.11.2. Products
- 12.1.11.3. Company Financials
- 12.1.11.4. SWOT Analysis
- 12.1.12 KRONOS Worldwide Inc
- 12.1.12.1. Company Overview
- 12.1.12.2. Products
- 12.1.12.3. Company Financials
- 12.1.12.4. SWOT Analysis
- 12.1.13 The Kish Company Inc
- 12.1.13.1. Company Overview
- 12.1.13.2. Products
- 12.1.13.3. Company Financials
- 12.1.13.4. SWOT Analysis
- 12.1.1 INEOS
- 12.2. Market Entropy
- 12.2.1 Company's Key Areas Served
- 12.2.2 Recent Developments
- 12.3. Company Market Share Analysis 2025
- 12.3.1 Top 5 Companies Market Share Analysis
- 12.3.2 Top 3 Companies Market Share Analysis
- 12.4. List of Potential Customers
- 13. Research Methodology
List of Figures
- Figure 1: Global TiO2 Industry Revenue Breakdown (billion, %) by Region 2025 & 2033
- Figure 2: Global TiO2 Industry Volume Breakdown (K Tons, %) by Region 2025 & 2033
- Figure 3: Asia Pacific TiO2 Industry Revenue (billion), by Grade 2025 & 2033
- Figure 4: Asia Pacific TiO2 Industry Volume (K Tons), by Grade 2025 & 2033
- Figure 5: Asia Pacific TiO2 Industry Revenue Share (%), by Grade 2025 & 2033
- Figure 6: Asia Pacific TiO2 Industry Volume Share (%), by Grade 2025 & 2033
- Figure 7: Asia Pacific TiO2 Industry Revenue (billion), by Application 2025 & 2033
- Figure 8: Asia Pacific TiO2 Industry Volume (K Tons), by Application 2025 & 2033
- Figure 9: Asia Pacific TiO2 Industry Revenue Share (%), by Application 2025 & 2033
- Figure 10: Asia Pacific TiO2 Industry Volume Share (%), by Application 2025 & 2033
- Figure 11: Asia Pacific TiO2 Industry Revenue (billion), by Country 2025 & 2033
- Figure 12: Asia Pacific TiO2 Industry Volume (K Tons), by Country 2025 & 2033
- Figure 13: Asia Pacific TiO2 Industry Revenue Share (%), by Country 2025 & 2033
- Figure 14: Asia Pacific TiO2 Industry Volume Share (%), by Country 2025 & 2033
- Figure 15: North America TiO2 Industry Revenue (billion), by Grade 2025 & 2033
- Figure 16: North America TiO2 Industry Volume (K Tons), by Grade 2025 & 2033
- Figure 17: North America TiO2 Industry Revenue Share (%), by Grade 2025 & 2033
- Figure 18: North America TiO2 Industry Volume Share (%), by Grade 2025 & 2033
- Figure 19: North America TiO2 Industry Revenue (billion), by Application 2025 & 2033
- Figure 20: North America TiO2 Industry Volume (K Tons), by Application 2025 & 2033
- Figure 21: North America TiO2 Industry Revenue Share (%), by Application 2025 & 2033
- Figure 22: North America TiO2 Industry Volume Share (%), by Application 2025 & 2033
- Figure 23: North America TiO2 Industry Revenue (billion), by Country 2025 & 2033
- Figure 24: North America TiO2 Industry Volume (K Tons), by Country 2025 & 2033
- Figure 25: North America TiO2 Industry Revenue Share (%), by Country 2025 & 2033
- Figure 26: North America TiO2 Industry Volume Share (%), by Country 2025 & 2033
- Figure 27: Europe TiO2 Industry Revenue (billion), by Grade 2025 & 2033
- Figure 28: Europe TiO2 Industry Volume (K Tons), by Grade 2025 & 2033
- Figure 29: Europe TiO2 Industry Revenue Share (%), by Grade 2025 & 2033
- Figure 30: Europe TiO2 Industry Volume Share (%), by Grade 2025 & 2033
- Figure 31: Europe TiO2 Industry Revenue (billion), by Application 2025 & 2033
- Figure 32: Europe TiO2 Industry Volume (K Tons), by Application 2025 & 2033
- Figure 33: Europe TiO2 Industry Revenue Share (%), by Application 2025 & 2033
- Figure 34: Europe TiO2 Industry Volume Share (%), by Application 2025 & 2033
- Figure 35: Europe TiO2 Industry Revenue (billion), by Country 2025 & 2033
- Figure 36: Europe TiO2 Industry Volume (K Tons), by Country 2025 & 2033
- Figure 37: Europe TiO2 Industry Revenue Share (%), by Country 2025 & 2033
- Figure 38: Europe TiO2 Industry Volume Share (%), by Country 2025 & 2033
- Figure 39: South America TiO2 Industry Revenue (billion), by Grade 2025 & 2033
- Figure 40: South America TiO2 Industry Volume (K Tons), by Grade 2025 & 2033
- Figure 41: South America TiO2 Industry Revenue Share (%), by Grade 2025 & 2033
- Figure 42: South America TiO2 Industry Volume Share (%), by Grade 2025 & 2033
- Figure 43: South America TiO2 Industry Revenue (billion), by Application 2025 & 2033
- Figure 44: South America TiO2 Industry Volume (K Tons), by Application 2025 & 2033
- Figure 45: South America TiO2 Industry Revenue Share (%), by Application 2025 & 2033
- Figure 46: South America TiO2 Industry Volume Share (%), by Application 2025 & 2033
- Figure 47: South America TiO2 Industry Revenue (billion), by Country 2025 & 2033
- Figure 48: South America TiO2 Industry Volume (K Tons), by Country 2025 & 2033
- Figure 49: South America TiO2 Industry Revenue Share (%), by Country 2025 & 2033
- Figure 50: South America TiO2 Industry Volume Share (%), by Country 2025 & 2033
- Figure 51: Middle East and Africa TiO2 Industry Revenue (billion), by Grade 2025 & 2033
- Figure 52: Middle East and Africa TiO2 Industry Volume (K Tons), by Grade 2025 & 2033
- Figure 53: Middle East and Africa TiO2 Industry Revenue Share (%), by Grade 2025 & 2033
- Figure 54: Middle East and Africa TiO2 Industry Volume Share (%), by Grade 2025 & 2033
- Figure 55: Middle East and Africa TiO2 Industry Revenue (billion), by Application 2025 & 2033
- Figure 56: Middle East and Africa TiO2 Industry Volume (K Tons), by Application 2025 & 2033
- Figure 57: Middle East and Africa TiO2 Industry Revenue Share (%), by Application 2025 & 2033
- Figure 58: Middle East and Africa TiO2 Industry Volume Share (%), by Application 2025 & 2033
- Figure 59: Middle East and Africa TiO2 Industry Revenue (billion), by Country 2025 & 2033
- Figure 60: Middle East and Africa TiO2 Industry Volume (K Tons), by Country 2025 & 2033
- Figure 61: Middle East and Africa TiO2 Industry Revenue Share (%), by Country 2025 & 2033
- Figure 62: Middle East and Africa TiO2 Industry Volume Share (%), by Country 2025 & 2033
List of Tables
- Table 1: Global TiO2 Industry Revenue billion Forecast, by Grade 2020 & 2033
- Table 2: Global TiO2 Industry Volume K Tons Forecast, by Grade 2020 & 2033
- Table 3: Global TiO2 Industry Revenue billion Forecast, by Application 2020 & 2033
- Table 4: Global TiO2 Industry Volume K Tons Forecast, by Application 2020 & 2033
- Table 5: Global TiO2 Industry Revenue billion Forecast, by Region 2020 & 2033
- Table 6: Global TiO2 Industry Volume K Tons Forecast, by Region 2020 & 2033
- Table 7: Global TiO2 Industry Revenue billion Forecast, by Grade 2020 & 2033
- Table 8: Global TiO2 Industry Volume K Tons Forecast, by Grade 2020 & 2033
- Table 9: Global TiO2 Industry Revenue billion Forecast, by Application 2020 & 2033
- Table 10: Global TiO2 Industry Volume K Tons Forecast, by Application 2020 & 2033
- Table 11: Global TiO2 Industry Revenue billion Forecast, by Country 2020 & 2033
- Table 12: Global TiO2 Industry Volume K Tons Forecast, by Country 2020 & 2033
- Table 13: China TiO2 Industry Revenue (billion) Forecast, by Application 2020 & 2033
- Table 14: China TiO2 Industry Volume (K Tons) Forecast, by Application 2020 & 2033
- Table 15: India TiO2 Industry Revenue (billion) Forecast, by Application 2020 & 2033
- Table 16: India TiO2 Industry Volume (K Tons) Forecast, by Application 2020 & 2033
- Table 17: Japan TiO2 Industry Revenue (billion) Forecast, by Application 2020 & 2033
- Table 18: Japan TiO2 Industry Volume (K Tons) Forecast, by Application 2020 & 2033
- Table 19: South Korea TiO2 Industry Revenue (billion) Forecast, by Application 2020 & 2033
- Table 20: South Korea TiO2 Industry Volume (K Tons) Forecast, by Application 2020 & 2033
- Table 21: Rest of Asia Pacific TiO2 Industry Revenue (billion) Forecast, by Application 2020 & 2033
- Table 22: Rest of Asia Pacific TiO2 Industry Volume (K Tons) Forecast, by Application 2020 & 2033
- Table 23: Global TiO2 Industry Revenue billion Forecast, by Grade 2020 & 2033
- Table 24: Global TiO2 Industry Volume K Tons Forecast, by Grade 2020 & 2033
- Table 25: Global TiO2 Industry Revenue billion Forecast, by Application 2020 & 2033
- Table 26: Global TiO2 Industry Volume K Tons Forecast, by Application 2020 & 2033
- Table 27: Global TiO2 Industry Revenue billion Forecast, by Country 2020 & 2033
- Table 28: Global TiO2 Industry Volume K Tons Forecast, by Country 2020 & 2033
- Table 29: United States TiO2 Industry Revenue (billion) Forecast, by Application 2020 & 2033
- Table 30: United States TiO2 Industry Volume (K Tons) Forecast, by Application 2020 & 2033
- Table 31: Canada TiO2 Industry Revenue (billion) Forecast, by Application 2020 & 2033
- Table 32: Canada TiO2 Industry Volume (K Tons) Forecast, by Application 2020 & 2033
- Table 33: Mexico TiO2 Industry Revenue (billion) Forecast, by Application 2020 & 2033
- Table 34: Mexico TiO2 Industry Volume (K Tons) Forecast, by Application 2020 & 2033
- Table 35: Global TiO2 Industry Revenue billion Forecast, by Grade 2020 & 2033
- Table 36: Global TiO2 Industry Volume K Tons Forecast, by Grade 2020 & 2033
- Table 37: Global TiO2 Industry Revenue billion Forecast, by Application 2020 & 2033
- Table 38: Global TiO2 Industry Volume K Tons Forecast, by Application 2020 & 2033
- Table 39: Global TiO2 Industry Revenue billion Forecast, by Country 2020 & 2033
- Table 40: Global TiO2 Industry Volume K Tons Forecast, by Country 2020 & 2033
- Table 41: Germany TiO2 Industry Revenue (billion) Forecast, by Application 2020 & 2033
- Table 42: Germany TiO2 Industry Volume (K Tons) Forecast, by Application 2020 & 2033
- Table 43: United Kingdom TiO2 Industry Revenue (billion) Forecast, by Application 2020 & 2033
- Table 44: United Kingdom TiO2 Industry Volume (K Tons) Forecast, by Application 2020 & 2033
- Table 45: France TiO2 Industry Revenue (billion) Forecast, by Application 2020 & 2033
- Table 46: France TiO2 Industry Volume (K Tons) Forecast, by Application 2020 & 2033
- Table 47: Italy TiO2 Industry Revenue (billion) Forecast, by Application 2020 & 2033
- Table 48: Italy TiO2 Industry Volume (K Tons) Forecast, by Application 2020 & 2033
- Table 49: Rest of Europe TiO2 Industry Revenue (billion) Forecast, by Application 2020 & 2033
- Table 50: Rest of Europe TiO2 Industry Volume (K Tons) Forecast, by Application 2020 & 2033
- Table 51: Global TiO2 Industry Revenue billion Forecast, by Grade 2020 & 2033
- Table 52: Global TiO2 Industry Volume K Tons Forecast, by Grade 2020 & 2033
- Table 53: Global TiO2 Industry Revenue billion Forecast, by Application 2020 & 2033
- Table 54: Global TiO2 Industry Volume K Tons Forecast, by Application 2020 & 2033
- Table 55: Global TiO2 Industry Revenue billion Forecast, by Country 2020 & 2033
- Table 56: Global TiO2 Industry Volume K Tons Forecast, by Country 2020 & 2033
- Table 57: Brazil TiO2 Industry Revenue (billion) Forecast, by Application 2020 & 2033
- Table 58: Brazil TiO2 Industry Volume (K Tons) Forecast, by Application 2020 & 2033
- Table 59: Argentina TiO2 Industry Revenue (billion) Forecast, by Application 2020 & 2033
- Table 60: Argentina TiO2 Industry Volume (K Tons) Forecast, by Application 2020 & 2033
- Table 61: Rest of South America TiO2 Industry Revenue (billion) Forecast, by Application 2020 & 2033
- Table 62: Rest of South America TiO2 Industry Volume (K Tons) Forecast, by Application 2020 & 2033
- Table 63: Global TiO2 Industry Revenue billion Forecast, by Grade 2020 & 2033
- Table 64: Global TiO2 Industry Volume K Tons Forecast, by Grade 2020 & 2033
- Table 65: Global TiO2 Industry Revenue billion Forecast, by Application 2020 & 2033
- Table 66: Global TiO2 Industry Volume K Tons Forecast, by Application 2020 & 2033
- Table 67: Global TiO2 Industry Revenue billion Forecast, by Country 2020 & 2033
- Table 68: Global TiO2 Industry Volume K Tons Forecast, by Country 2020 & 2033
- Table 69: Saudi Arabia TiO2 Industry Revenue (billion) Forecast, by Application 2020 & 2033
- Table 70: Saudi Arabia TiO2 Industry Volume (K Tons) Forecast, by Application 2020 & 2033
- Table 71: South Africa TiO2 Industry Revenue (billion) Forecast, by Application 2020 & 2033
- Table 72: South Africa TiO2 Industry Volume (K Tons) Forecast, by Application 2020 & 2033
- Table 73: Rest of Middle East and Africa TiO2 Industry Revenue (billion) Forecast, by Application 2020 & 2033
- Table 74: Rest of Middle East and Africa TiO2 Industry Volume (K Tons) Forecast, by Application 2020 & 2033
Frequently Asked Questions
1. What is the projected Compound Annual Growth Rate (CAGR) of the TiO2 Industry?
The projected CAGR is approximately 7.1%.
2. Which companies are prominent players in the TiO2 Industry?
Key companies in the market include INEOS, Evonik Industries AG, LB Group, Grupa Azoty, Argex Titanium Inc, Kemipex, Venator Materials PLC, TAYCA, The Chemours Company, Tronox Holdings PLC, Precheza, KRONOS Worldwide Inc, The Kish Company Inc.
3. What are the main segments of the TiO2 Industry?
The market segments include Grade, Application.
4. Can you provide details about the market size?
The market size is estimated to be USD 19.06 billion as of 2022.
5. What are some drivers contributing to market growth?
Rapidly Increasing Demand for Paints and Coatings; Other Drivers.
6. What are the notable trends driving market growth?
Paints and Coatings Segment is Expected to Dominate the Market.
7. Are there any restraints impacting market growth?
Toxicity and Stringent Environmental Policies of Titanium Dioxide; Other Restraints.
8. Can you provide examples of recent developments in the market?
In August 2022, Chemours started mining at its newest sand mine in Florida, which will increase the company's titanium oxide production. Chemours will get ilmenite from the mine, which will be used in their chloride-based TiO2 synthesis process. The site's mining life should be eight years.
9. What pricing options are available for accessing the report?
Pricing options include single-user, multi-user, and enterprise licenses priced at USD 4750, USD 5250, and USD 8750 respectively.
10. Is the market size provided in terms of value or volume?
The market size is provided in terms of value, measured in billion and volume, measured in K Tons.
11. Are there any specific market keywords associated with the report?
Yes, the market keyword associated with the report is "TiO2 Industry," which aids in identifying and referencing the specific market segment covered.
12. How do I determine which pricing option suits my needs best?
The pricing options vary based on user requirements and access needs. Individual users may opt for single-user licenses, while businesses requiring broader access may choose multi-user or enterprise licenses for cost-effective access to the report.
13. Are there any additional resources or data provided in the TiO2 Industry report?
While the report offers comprehensive insights, it's advisable to review the specific contents or supplementary materials provided to ascertain if additional resources or data are available.
14. How can I stay updated on further developments or reports in the TiO2 Industry?
To stay informed about further developments, trends, and reports in the TiO2 Industry, consider subscribing to industry newsletters, following relevant companies and organizations, or regularly checking reputable industry news sources and publications.
Methodology
Step 1 - Identification of Relevant Samples Size from Population Database


Step 2 - Approaches for Defining Global Market Size (Value, Volume* & Price*)

Note*: In applicable scenarios
Step 3 - Data Sources
Primary Research
- Web Analytics
- Survey Reports
- Research Institute
- Latest Research Reports
- Opinion Leaders
Secondary Research
- Annual Reports
- White Paper
- Latest Press Release
- Industry Association
- Paid Database
- Investor Presentations

Step 4 - Data Triangulation
Involves using different sources of information in order to increase the validity of a study
These sources are likely to be stakeholders in a program - participants, other researchers, program staff, other community members, and so on.
Then we put all data in single framework & apply various statistical tools to find out the dynamic on the market.
During the analysis stage, feedback from the stakeholder groups would be compared to determine areas of agreement as well as areas of divergence