

Key Insights
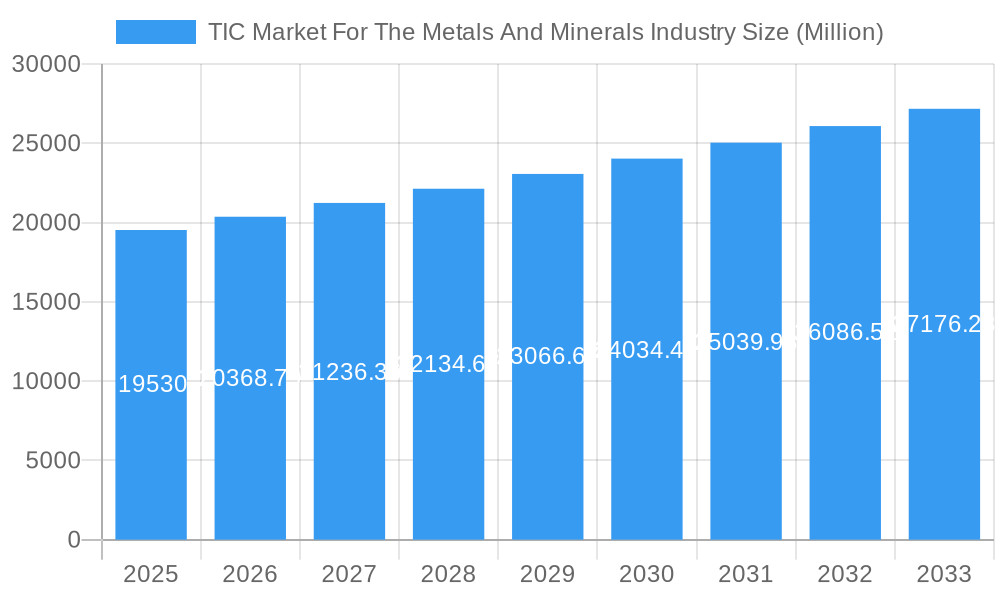
The global Testing, Inspection, and Certification (TIC) market for the metals and minerals industry is experiencing steady growth, projected to reach a market size of $19.53 billion in 2025 and maintain a Compound Annual Growth Rate (CAGR) of 4.30% from 2025 to 2033. This growth is driven by several factors. Increasing demand for high-quality and safety-compliant metals and minerals in various end-use industries like construction, automotive, and energy fuels the need for rigorous testing and certification. Furthermore, stringent government regulations regarding product safety and environmental impact are compelling manufacturers to invest more in TIC services. Advancements in testing technologies, including automation and sophisticated analytical techniques, also contribute to market expansion. The rising adoption of sustainable practices within the metals and minerals sector further fuels demand for TIC services, as companies seek to ensure compliance with environmental standards and improve their sustainability profiles. Competitive pressures are also driving market growth, as companies seek to differentiate their products through quality assurance and certification.
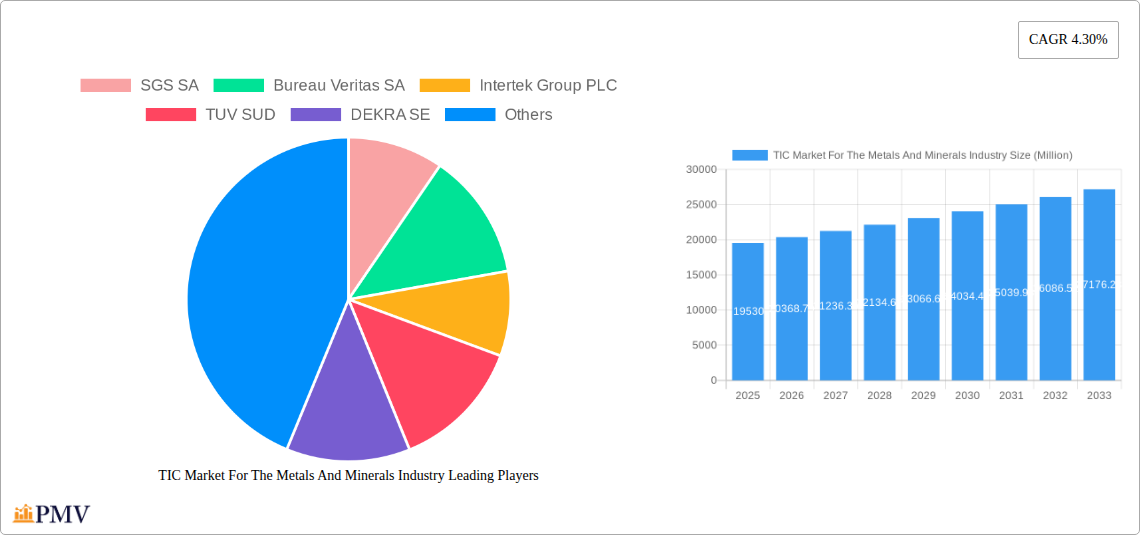
TIC Market For The Metals And Minerals Industry Market Size (In Billion)
The market is segmented based on various factors, including testing type (destructive, non-destructive), material type (iron ore, aluminum, copper, etc.), and service type (inspection, testing, certification). Key players in this market include SGS SA, Bureau Veritas SA, Intertek Group PLC, TÜV SÜD, DEKRA SE, and others. While the regional breakdown is not provided, it's reasonable to assume that regions with significant metals and minerals production and consumption, such as North America, Europe, Asia-Pacific, and parts of South America, will dominate the market share. Future growth will likely be shaped by technological innovation, evolving regulatory landscapes, and the continued demand for environmentally responsible mining and metal processing practices. The market's competitive landscape will remain dynamic, with existing players focusing on expanding their service offerings and geographical reach, while new entrants may emerge with specialized expertise or innovative solutions.
TIC Market For The Metals And Minerals Industry Company Market Share
TIC Market For The Metals And Minerals Industry: A Comprehensive Market Report (2019-2033)
This in-depth report provides a comprehensive analysis of the Third-Party Inspection (TIC) market for the metals and minerals industry, covering the period 2019-2033. It offers invaluable insights into market dynamics, competitive landscapes, and future growth opportunities, equipping stakeholders with the knowledge needed to make informed strategic decisions. The report analyzes key industry players, including SGS SA, Bureau Veritas SA, Intertek Group PLC, and others, examining their market share, M&A activities, and innovative strategies. With a detailed segmentation and rigorous forecasting, this report is a must-have resource for businesses, investors, and industry analysts seeking a clear understanding of this evolving market. The Base Year is 2025, with the Estimated Year also being 2025 and a Forecast Period of 2025-2033. The Historical Period covered is 2019-2024.
TIC Market For The Metals And Minerals Industry Market Structure & Competitive Dynamics
The TIC market for the metals and minerals industry is characterized by a moderately concentrated structure, with several multinational corporations holding significant market share. The market exhibits a dynamic interplay of innovation ecosystems, evolving regulatory frameworks, and the constant emergence of substitute products. End-user trends, shaped by factors such as increasing demand for sustainable and traceable materials, are significantly impacting market growth. Mergers and acquisitions (M&A) activity is frequent, driving consolidation and reshaping the competitive landscape.
Market Concentration: The top 5 players account for approximately xx% of the global market share in 2025. Market concentration is expected to increase slightly by 2033, reaching approximately xx%, driven by ongoing consolidation through M&A activities.
Innovation Ecosystems: Collaboration between TIC providers, research institutions, and technology companies is fostering the development of advanced testing methodologies and analytical tools, boosting efficiency and accuracy.
Regulatory Frameworks: Stringent environmental regulations and international standards are driving demand for reliable TIC services, ensuring compliance and enhancing product quality.
Product Substitutes: The emergence of advanced analytical techniques and digital technologies could potentially disrupt the traditional TIC market, although the adoption is gradual due to the high precision and reliability demanded by the industry.
End-User Trends: The increasing focus on sustainable sourcing and supply chain traceability is driving growth in areas like material certification and environmental impact assessments, impacting demand for specific TIC services.
M&A Activities: In recent years, the market has witnessed significant M&A activity, with deal values exceeding USD xx Million in 2024. These transactions are primarily driven by strategic expansion, enhanced service offerings, and geographic diversification.
TIC Market For The Metals And Minerals Industry Industry Trends & Insights
The global TIC market for the metals and minerals industry is experiencing robust growth, driven by several key factors. Technological advancements, including the adoption of automation and AI-powered analytical tools, are improving efficiency and reducing costs. Consumer preferences for sustainable and ethically sourced materials are increasing the demand for TIC services to verify compliance with environmental and social standards. The increasing complexity of supply chains also necessitates more stringent quality control and verification, boosting the demand for TIC services. Competitive dynamics, particularly the ongoing consolidation through mergers and acquisitions, are reshaping the market landscape. The market is expected to witness a Compound Annual Growth Rate (CAGR) of xx% during the forecast period (2025-2033), with market penetration steadily increasing across various segments and regions.
Dominant Markets & Segments in TIC Market For The Metals And Minerals Industry
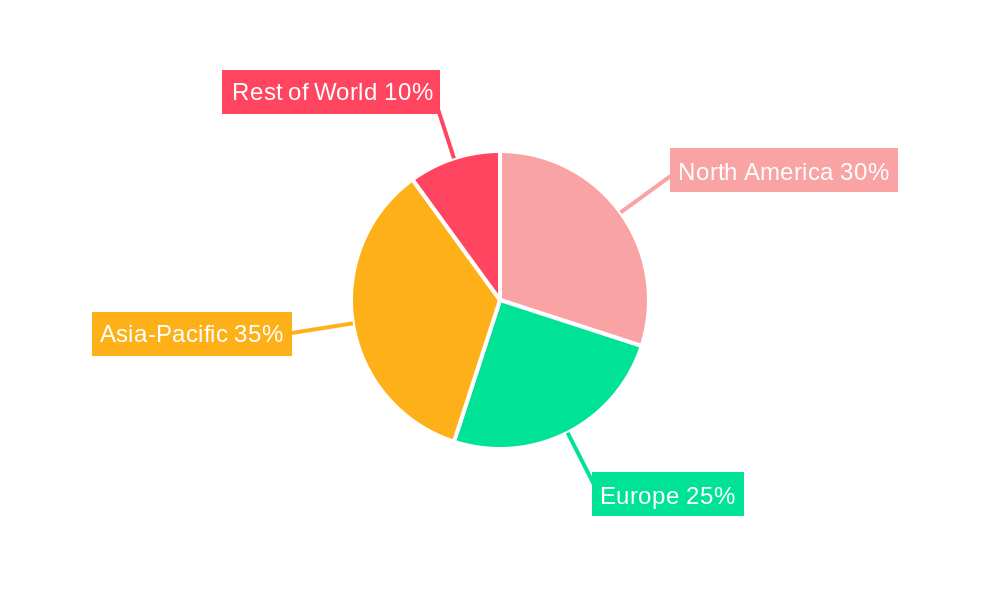
The global TIC (Testing, Inspection, and Certification) market for the metals and minerals industry is characterized by a dynamic regional landscape. Currently, North America stands as the largest market, driven by a mature industrial base, stringent regulatory requirements, and a high concentration of established TIC service providers. This dominance is further bolstered by significant investments in R&D and a strong emphasis on product quality and safety, leading to widespread adoption of advanced testing methodologies and technologies.
Key Drivers of North American Dominance:
- Robust and evolving regulatory frameworks mandating compliance and safety standards.
- High adoption rates of cutting-edge technologies, including AI and IoT, for enhanced testing and inspection efficiency.
- Well-developed industrial and logistical infrastructure supporting comprehensive testing, inspection, and certification activities.
- Substantial and ongoing investments in research and development across various metals and minerals sectors.
- Heightened consumer and industry awareness regarding product quality, safety, and ethical sourcing.
Emerging and Established Regional Markets: While North America leads, the Asia-Pacific region is exhibiting exceptional growth potential. This surge is fueled by rapid industrialization, substantial infrastructure development projects, and an increasing awareness and enforcement of quality control and environmental regulations. Europe maintains its position as a significant market, though its growth trajectory is more measured compared to the dynamic Asia-Pacific landscape. Other regions are also seeing increased demand as global supply chains diversify and sustainability concerns become paramount.
TIC Market For The Metals And Minerals Industry Product Innovations
Recent advancements in TIC technology focus on automation, AI-powered analysis, and advanced material characterization techniques. These innovations improve testing accuracy, speed, and cost-effectiveness, enabling more comprehensive and efficient quality control. The integration of blockchain technology for supply chain traceability also enhances the reliability of TIC services, addressing growing end-user concerns about product authenticity and sustainable sourcing. This market fit directly addresses industry demands for faster, more accurate, and transparent quality control, offering a significant competitive advantage.
Report Segmentation & Scope
This comprehensive report meticulously segments the TIC market within the metals and minerals industry. The segmentation is based on critical parameters including service type (encompassing extensive testing, rigorous inspection, and crucial certification), testing methodology (distinguishing between destructive and non-destructive approaches), application areas (covering mining operations, metallurgical processes, and construction materials), and geographical regions. The report provides detailed growth projections for each segment, alongside current market size estimations and in-depth competitive analysis. Each segment's growth is influenced by a confluence of factors, such as specific industry demands, the pace of technological innovation, and evolving regulatory landscapes. For instance, the burgeoning demand for advanced material characterization is a significant catalyst for growth in specialized testing services, while the intensified focus on sustainable mining practices is actively driving the demand for comprehensive environmental impact assessments and associated TIC services.
Key Drivers of TIC Market For The Metals And Minerals Industry Growth
Several factors are driving the growth of the TIC market for the metals and minerals industry. Technological advancements, such as the introduction of automated testing equipment and advanced analytical techniques, are enhancing efficiency and reducing costs. Growing environmental regulations and increased focus on sustainable sourcing are significantly driving demand for verification and compliance services. Stringent quality control requirements from end-users are further boosting the demand for reliable TIC services to ensure product quality and safety. The global expansion of infrastructure projects also contributes substantially to the growth of the market, leading to greater demand for inspection and testing services.
Challenges in the TIC Market For The Metals And Minerals Industry Sector
The TIC market for metals and minerals navigates a complex terrain marked by several significant challenges. Intense competition among established global players and emerging regional specialists can put pressure on pricing and profit margins. Navigating diverse and sometimes fragmented regulatory frameworks across different countries adds complexity and compliance burdens. Potential disruptions in global supply chains, whether due to geopolitical events, economic shifts, or logistical bottlenecks, can impact the timely delivery of essential services and materials. The escalating costs associated with acquiring and maintaining state-of-the-art specialized equipment, coupled with the ongoing need for highly skilled and certified personnel, present considerable financial challenges. Furthermore, the relentless evolution of industry standards and testing methodologies necessitates continuous investment in staff training, technological upgrades, and infrastructure modernization, creating potential barriers to entry for smaller, less-resourced organizations. The inherent exposure of the global metals and minerals industry to geopolitical risks and commodity price volatility also translates into an ongoing challenge for TIC providers, demanding agility and robust risk management strategies.
Leading Players in the TIC Market For The Metals And Minerals Industry Market
- SGS SA
- Bureau Veritas SA
- Intertek Group PLC
- TUV SUD
- DEKRA SE
- ALS Limited
- Applus+
- Eurofins Scientific SE
- DNV Group AS
- Element Materials Technology Group Limited
- Mistras Group Inc
- Kiwa NV
- UL Solutions Inc
- Rina SPA
- Qima
- Westmoreland Mechanical Testing and Research Inc
- Laboratory Testing Inc
- NSL Analytical Services Inc
- IMR Test Labs (Curtiss Wright Corporation)
- Applied Technical Services LLC *This list represents a significant portion of the market leaders but is not exhaustive.
Key Developments in TIC Market For The Metals And Minerals Industry Sector
- August 2024: Element Materials Technology significantly bolstered its presence in Canada by investing USD 13 million to establish two new state-of-the-art laboratories in Toronto. This strategic expansion is poised to enhance its capabilities in metals testing and advanced materials characterization, aligning with growth opportunities in sectors such as pharmaceuticals and biotechnology.
- June 2024: In a move to solidify its leadership in the electric vehicle (EV) supply chain, UL Solutions Inc. announced ambitious plans to construct an Advanced Automotive and Battery Testing Center in Korea. This development underscores the increasing demand for specialized EV component and battery testing services.
- March 2024: Applus+ demonstrated its critical role in major infrastructure development by providing comprehensive technical supervision for the construction of a vital 220 kV transmission line in Peru. This project highlights the growing reliance on TIC services for large-scale energy and infrastructure projects.
- Ongoing Trends: The sector is witnessing a continuous drive towards digital transformation, with increased adoption of AI-powered analytics, remote inspection technologies, and blockchain for supply chain transparency. Furthermore, there's a heightened focus on ESG (Environmental, Social, and Governance) compliance, driving demand for specialized testing and certification related to sustainability, ethical sourcing, and circular economy principles within the metals and minerals industries.
Strategic TIC Market For The Metals And Minerals Industry Market Outlook
The future of the TIC market for the metals and minerals industry is bright, with continued growth projected across various segments. The increasing adoption of advanced technologies, coupled with the growing focus on sustainable and responsible sourcing, will create significant opportunities for innovation and expansion. Strategic partnerships and collaborations will be crucial for TIC providers to enhance their service offerings and meet the evolving needs of the industry. The focus will be on delivering value-added services, integrating data analytics to offer deeper insights into material performance, and developing sustainable solutions to support the industry's drive toward environmental responsibility.
TIC Market For The Metals And Minerals Industry Segmentation
-
1. Operation Type
- 1.1. In-house
- 1.2. Outsourced
-
2. Service Type
- 2.1. Testing And Inspection
- 2.2. Certification
-
3. Material Type
- 3.1. Metals/Metal Powders
- 3.2. Composites
-
4. End-user Industry
- 4.1. Automotive
- 4.2. Aerospace and Defense
- 4.3. Energy and Power
- 4.4. Manufacturing
- 4.5. Construction
- 4.6. Oil and Gas
- 4.7. Other End-user Industries
TIC Market For The Metals And Minerals Industry Segmentation By Geography
-
1. North America
- 1.1. United States
- 1.2. Canada
-
2. Europe
- 2.1. United Kingdom
- 2.2. Germany
- 2.3. France
-
3. Asia
- 3.1. China
- 3.2. Japan
- 3.3. South Korea
- 3.4. South East Asia
- 3.5. India
- 4. Australia and New Zealand
- 5. Latin America
- 6. Middle East and Africa
TIC Market For The Metals And Minerals Industry Regional Market Share
Geographic Coverage of TIC Market For The Metals And Minerals Industry
TIC Market For The Metals And Minerals Industry REPORT HIGHLIGHTS
| Aspects | Details |
|---|---|
| Study Period | 2020-2034 |
| Base Year | 2025 |
| Estimated Year | 2026 |
| Forecast Period | 2026-2034 |
| Historical Period | 2020-2025 |
| Growth Rate | CAGR of 4.30% from 2020-2034 |
| Segmentation |
|
Table of Contents
- 1. Introduction
- 1.1. Research Scope
- 1.2. Market Segmentation
- 1.3. Research Objective
- 1.4. Definitions and Assumptions
- 2. Executive Summary
- 2.1. Market Snapshot
- 3. Market Dynamics
- 3.1. Market Drivers
- 3.2. Market Restrains
- 3.3. Market Trends
- 3.4. Market Opportunities
- 4. Market Factor Analysis
- 4.1. Porters Five Forces
- 4.1.1. Bargaining Power of Suppliers
- 4.1.2. Bargaining Power of Buyers
- 4.1.3. Threat of New Entrants
- 4.1.4. Threat of Substitutes
- 4.1.5. Competitive Rivalry
- 4.2. PESTEL analysis
- 4.3. BCG Analysis
- 4.3.1. Stars (High Growth, High Market Share)
- 4.3.2. Cash Cows (Low Growth, High Market Share)
- 4.3.3. Question Mark (High Growth, Low Market Share)
- 4.3.4. Dogs (Low Growth, Low Market Share)
- 4.4. Ansoff Matrix Analysis
- 4.5. Supply Chain Analysis
- 4.6. Regulatory Landscape
- 4.7. Current Market Potential and Opportunity Assessment (TAM–SAM–SOM Framework)
- 4.8. PMV Analyst Note
- 4.1. Porters Five Forces
- 5. Market Analysis, Insights and Forecast 2021-2033
- 5.1. Market Analysis, Insights and Forecast - by Operation Type
- 5.1.1. In-house
- 5.1.2. Outsourced
- 5.2. Market Analysis, Insights and Forecast - by Service Type
- 5.2.1. Testing And Inspection
- 5.2.2. Certification
- 5.3. Market Analysis, Insights and Forecast - by Material Type
- 5.3.1. Metals/Metal Powders
- 5.3.2. Composites
- 5.4. Market Analysis, Insights and Forecast - by End-user Industry
- 5.4.1. Automotive
- 5.4.2. Aerospace and Defense
- 5.4.3. Energy and Power
- 5.4.4. Manufacturing
- 5.4.5. Construction
- 5.4.6. Oil and Gas
- 5.4.7. Other End-user Industries
- 5.5. Market Analysis, Insights and Forecast - by Region
- 5.5.1. North America
- 5.5.2. Europe
- 5.5.3. Asia
- 5.5.4. Australia and New Zealand
- 5.5.5. Latin America
- 5.5.6. Middle East and Africa
- 5.1. Market Analysis, Insights and Forecast - by Operation Type
- 6. Global TIC Market For The Metals And Minerals Industry Analysis, Insights and Forecast, 2021-2033
- 6.1. Market Analysis, Insights and Forecast - by Operation Type
- 6.1.1. In-house
- 6.1.2. Outsourced
- 6.2. Market Analysis, Insights and Forecast - by Service Type
- 6.2.1. Testing And Inspection
- 6.2.2. Certification
- 6.3. Market Analysis, Insights and Forecast - by Material Type
- 6.3.1. Metals/Metal Powders
- 6.3.2. Composites
- 6.4. Market Analysis, Insights and Forecast - by End-user Industry
- 6.4.1. Automotive
- 6.4.2. Aerospace and Defense
- 6.4.3. Energy and Power
- 6.4.4. Manufacturing
- 6.4.5. Construction
- 6.4.6. Oil and Gas
- 6.4.7. Other End-user Industries
- 6.1. Market Analysis, Insights and Forecast - by Operation Type
- 7. North America TIC Market For The Metals And Minerals Industry Analysis, Insights and Forecast, 2020-2032
- 7.1. Market Analysis, Insights and Forecast - by Operation Type
- 7.1.1. In-house
- 7.1.2. Outsourced
- 7.2. Market Analysis, Insights and Forecast - by Service Type
- 7.2.1. Testing And Inspection
- 7.2.2. Certification
- 7.3. Market Analysis, Insights and Forecast - by Material Type
- 7.3.1. Metals/Metal Powders
- 7.3.2. Composites
- 7.4. Market Analysis, Insights and Forecast - by End-user Industry
- 7.4.1. Automotive
- 7.4.2. Aerospace and Defense
- 7.4.3. Energy and Power
- 7.4.4. Manufacturing
- 7.4.5. Construction
- 7.4.6. Oil and Gas
- 7.4.7. Other End-user Industries
- 7.1. Market Analysis, Insights and Forecast - by Operation Type
- 8. Europe TIC Market For The Metals And Minerals Industry Analysis, Insights and Forecast, 2020-2032
- 8.1. Market Analysis, Insights and Forecast - by Operation Type
- 8.1.1. In-house
- 8.1.2. Outsourced
- 8.2. Market Analysis, Insights and Forecast - by Service Type
- 8.2.1. Testing And Inspection
- 8.2.2. Certification
- 8.3. Market Analysis, Insights and Forecast - by Material Type
- 8.3.1. Metals/Metal Powders
- 8.3.2. Composites
- 8.4. Market Analysis, Insights and Forecast - by End-user Industry
- 8.4.1. Automotive
- 8.4.2. Aerospace and Defense
- 8.4.3. Energy and Power
- 8.4.4. Manufacturing
- 8.4.5. Construction
- 8.4.6. Oil and Gas
- 8.4.7. Other End-user Industries
- 8.1. Market Analysis, Insights and Forecast - by Operation Type
- 9. Asia TIC Market For The Metals And Minerals Industry Analysis, Insights and Forecast, 2020-2032
- 9.1. Market Analysis, Insights and Forecast - by Operation Type
- 9.1.1. In-house
- 9.1.2. Outsourced
- 9.2. Market Analysis, Insights and Forecast - by Service Type
- 9.2.1. Testing And Inspection
- 9.2.2. Certification
- 9.3. Market Analysis, Insights and Forecast - by Material Type
- 9.3.1. Metals/Metal Powders
- 9.3.2. Composites
- 9.4. Market Analysis, Insights and Forecast - by End-user Industry
- 9.4.1. Automotive
- 9.4.2. Aerospace and Defense
- 9.4.3. Energy and Power
- 9.4.4. Manufacturing
- 9.4.5. Construction
- 9.4.6. Oil and Gas
- 9.4.7. Other End-user Industries
- 9.1. Market Analysis, Insights and Forecast - by Operation Type
- 10. Australia and New Zealand TIC Market For The Metals And Minerals Industry Analysis, Insights and Forecast, 2020-2032
- 10.1. Market Analysis, Insights and Forecast - by Operation Type
- 10.1.1. In-house
- 10.1.2. Outsourced
- 10.2. Market Analysis, Insights and Forecast - by Service Type
- 10.2.1. Testing And Inspection
- 10.2.2. Certification
- 10.3. Market Analysis, Insights and Forecast - by Material Type
- 10.3.1. Metals/Metal Powders
- 10.3.2. Composites
- 10.4. Market Analysis, Insights and Forecast - by End-user Industry
- 10.4.1. Automotive
- 10.4.2. Aerospace and Defense
- 10.4.3. Energy and Power
- 10.4.4. Manufacturing
- 10.4.5. Construction
- 10.4.6. Oil and Gas
- 10.4.7. Other End-user Industries
- 10.1. Market Analysis, Insights and Forecast - by Operation Type
- 11. Latin America TIC Market For The Metals And Minerals Industry Analysis, Insights and Forecast, 2020-2032
- 11.1. Market Analysis, Insights and Forecast - by Operation Type
- 11.1.1. In-house
- 11.1.2. Outsourced
- 11.2. Market Analysis, Insights and Forecast - by Service Type
- 11.2.1. Testing And Inspection
- 11.2.2. Certification
- 11.3. Market Analysis, Insights and Forecast - by Material Type
- 11.3.1. Metals/Metal Powders
- 11.3.2. Composites
- 11.4. Market Analysis, Insights and Forecast - by End-user Industry
- 11.4.1. Automotive
- 11.4.2. Aerospace and Defense
- 11.4.3. Energy and Power
- 11.4.4. Manufacturing
- 11.4.5. Construction
- 11.4.6. Oil and Gas
- 11.4.7. Other End-user Industries
- 11.1. Market Analysis, Insights and Forecast - by Operation Type
- 12. Middle East and Africa TIC Market For The Metals And Minerals Industry Analysis, Insights and Forecast, 2020-2032
- 12.1. Market Analysis, Insights and Forecast - by Operation Type
- 12.1.1. In-house
- 12.1.2. Outsourced
- 12.2. Market Analysis, Insights and Forecast - by Service Type
- 12.2.1. Testing And Inspection
- 12.2.2. Certification
- 12.3. Market Analysis, Insights and Forecast - by Material Type
- 12.3.1. Metals/Metal Powders
- 12.3.2. Composites
- 12.4. Market Analysis, Insights and Forecast - by End-user Industry
- 12.4.1. Automotive
- 12.4.2. Aerospace and Defense
- 12.4.3. Energy and Power
- 12.4.4. Manufacturing
- 12.4.5. Construction
- 12.4.6. Oil and Gas
- 12.4.7. Other End-user Industries
- 12.1. Market Analysis, Insights and Forecast - by Operation Type
- 13. Competitive Analysis
- 13.1. Company Profiles
- 13.1.1 SGS SA
- 13.1.1.1. Company Overview
- 13.1.1.2. Products
- 13.1.1.3. Company Financials
- 13.1.1.4. SWOT Analysis
- 13.1.2 Bureau Veritas SA
- 13.1.2.1. Company Overview
- 13.1.2.2. Products
- 13.1.2.3. Company Financials
- 13.1.2.4. SWOT Analysis
- 13.1.3 Intertek Group PLC
- 13.1.3.1. Company Overview
- 13.1.3.2. Products
- 13.1.3.3. Company Financials
- 13.1.3.4. SWOT Analysis
- 13.1.4 TUV SUD
- 13.1.4.1. Company Overview
- 13.1.4.2. Products
- 13.1.4.3. Company Financials
- 13.1.4.4. SWOT Analysis
- 13.1.5 DEKRA SE
- 13.1.5.1. Company Overview
- 13.1.5.2. Products
- 13.1.5.3. Company Financials
- 13.1.5.4. SWOT Analysis
- 13.1.6 ALS Limited
- 13.1.6.1. Company Overview
- 13.1.6.2. Products
- 13.1.6.3. Company Financials
- 13.1.6.4. SWOT Analysis
- 13.1.7 Applus+
- 13.1.7.1. Company Overview
- 13.1.7.2. Products
- 13.1.7.3. Company Financials
- 13.1.7.4. SWOT Analysis
- 13.1.8 Eurofins Scientific SE
- 13.1.8.1. Company Overview
- 13.1.8.2. Products
- 13.1.8.3. Company Financials
- 13.1.8.4. SWOT Analysis
- 13.1.9 DNV Group AS
- 13.1.9.1. Company Overview
- 13.1.9.2. Products
- 13.1.9.3. Company Financials
- 13.1.9.4. SWOT Analysis
- 13.1.10 Element Materials Technology Group Limited
- 13.1.10.1. Company Overview
- 13.1.10.2. Products
- 13.1.10.3. Company Financials
- 13.1.10.4. SWOT Analysis
- 13.1.11 Mistras Group Inc
- 13.1.11.1. Company Overview
- 13.1.11.2. Products
- 13.1.11.3. Company Financials
- 13.1.11.4. SWOT Analysis
- 13.1.12 Kiwa NV
- 13.1.12.1. Company Overview
- 13.1.12.2. Products
- 13.1.12.3. Company Financials
- 13.1.12.4. SWOT Analysis
- 13.1.13 UL Solutions Inc
- 13.1.13.1. Company Overview
- 13.1.13.2. Products
- 13.1.13.3. Company Financials
- 13.1.13.4. SWOT Analysis
- 13.1.14 Rina SPA
- 13.1.14.1. Company Overview
- 13.1.14.2. Products
- 13.1.14.3. Company Financials
- 13.1.14.4. SWOT Analysis
- 13.1.15 Qima
- 13.1.15.1. Company Overview
- 13.1.15.2. Products
- 13.1.15.3. Company Financials
- 13.1.15.4. SWOT Analysis
- 13.1.16 Westmoreland Mechanical Testing and Research Inc
- 13.1.16.1. Company Overview
- 13.1.16.2. Products
- 13.1.16.3. Company Financials
- 13.1.16.4. SWOT Analysis
- 13.1.17 Laboratory Testing Inc
- 13.1.17.1. Company Overview
- 13.1.17.2. Products
- 13.1.17.3. Company Financials
- 13.1.17.4. SWOT Analysis
- 13.1.18 NSL Analytical Services Inc
- 13.1.18.1. Company Overview
- 13.1.18.2. Products
- 13.1.18.3. Company Financials
- 13.1.18.4. SWOT Analysis
- 13.1.19 IMR Test Labs (Curtiss Wright Corporation)
- 13.1.19.1. Company Overview
- 13.1.19.2. Products
- 13.1.19.3. Company Financials
- 13.1.19.4. SWOT Analysis
- 13.1.20 Applied Technical Services LLC*List Not Exhaustive
- 13.1.20.1. Company Overview
- 13.1.20.2. Products
- 13.1.20.3. Company Financials
- 13.1.20.4. SWOT Analysis
- 13.1.1 SGS SA
- 13.2. Market Entropy
- 13.2.1 Company's Key Areas Served
- 13.2.2 Recent Developments
- 13.3. Company Market Share Analysis 2025
- 13.3.1 Top 5 Companies Market Share Analysis
- 13.3.2 Top 3 Companies Market Share Analysis
- 13.4. List of Potential Customers
- 14. Research Methodology
List of Figures
- Figure 1: Global TIC Market For The Metals And Minerals Industry Revenue Breakdown (Million, %) by Region 2025 & 2033
- Figure 2: Global TIC Market For The Metals And Minerals Industry Volume Breakdown (Billion, %) by Region 2025 & 2033
- Figure 3: North America TIC Market For The Metals And Minerals Industry Revenue (Million), by Operation Type 2025 & 2033
- Figure 4: North America TIC Market For The Metals And Minerals Industry Volume (Billion), by Operation Type 2025 & 2033
- Figure 5: North America TIC Market For The Metals And Minerals Industry Revenue Share (%), by Operation Type 2025 & 2033
- Figure 6: North America TIC Market For The Metals And Minerals Industry Volume Share (%), by Operation Type 2025 & 2033
- Figure 7: North America TIC Market For The Metals And Minerals Industry Revenue (Million), by Service Type 2025 & 2033
- Figure 8: North America TIC Market For The Metals And Minerals Industry Volume (Billion), by Service Type 2025 & 2033
- Figure 9: North America TIC Market For The Metals And Minerals Industry Revenue Share (%), by Service Type 2025 & 2033
- Figure 10: North America TIC Market For The Metals And Minerals Industry Volume Share (%), by Service Type 2025 & 2033
- Figure 11: North America TIC Market For The Metals And Minerals Industry Revenue (Million), by Material Type 2025 & 2033
- Figure 12: North America TIC Market For The Metals And Minerals Industry Volume (Billion), by Material Type 2025 & 2033
- Figure 13: North America TIC Market For The Metals And Minerals Industry Revenue Share (%), by Material Type 2025 & 2033
- Figure 14: North America TIC Market For The Metals And Minerals Industry Volume Share (%), by Material Type 2025 & 2033
- Figure 15: North America TIC Market For The Metals And Minerals Industry Revenue (Million), by End-user Industry 2025 & 2033
- Figure 16: North America TIC Market For The Metals And Minerals Industry Volume (Billion), by End-user Industry 2025 & 2033
- Figure 17: North America TIC Market For The Metals And Minerals Industry Revenue Share (%), by End-user Industry 2025 & 2033
- Figure 18: North America TIC Market For The Metals And Minerals Industry Volume Share (%), by End-user Industry 2025 & 2033
- Figure 19: North America TIC Market For The Metals And Minerals Industry Revenue (Million), by Country 2025 & 2033
- Figure 20: North America TIC Market For The Metals And Minerals Industry Volume (Billion), by Country 2025 & 2033
- Figure 21: North America TIC Market For The Metals And Minerals Industry Revenue Share (%), by Country 2025 & 2033
- Figure 22: North America TIC Market For The Metals And Minerals Industry Volume Share (%), by Country 2025 & 2033
- Figure 23: Europe TIC Market For The Metals And Minerals Industry Revenue (Million), by Operation Type 2025 & 2033
- Figure 24: Europe TIC Market For The Metals And Minerals Industry Volume (Billion), by Operation Type 2025 & 2033
- Figure 25: Europe TIC Market For The Metals And Minerals Industry Revenue Share (%), by Operation Type 2025 & 2033
- Figure 26: Europe TIC Market For The Metals And Minerals Industry Volume Share (%), by Operation Type 2025 & 2033
- Figure 27: Europe TIC Market For The Metals And Minerals Industry Revenue (Million), by Service Type 2025 & 2033
- Figure 28: Europe TIC Market For The Metals And Minerals Industry Volume (Billion), by Service Type 2025 & 2033
- Figure 29: Europe TIC Market For The Metals And Minerals Industry Revenue Share (%), by Service Type 2025 & 2033
- Figure 30: Europe TIC Market For The Metals And Minerals Industry Volume Share (%), by Service Type 2025 & 2033
- Figure 31: Europe TIC Market For The Metals And Minerals Industry Revenue (Million), by Material Type 2025 & 2033
- Figure 32: Europe TIC Market For The Metals And Minerals Industry Volume (Billion), by Material Type 2025 & 2033
- Figure 33: Europe TIC Market For The Metals And Minerals Industry Revenue Share (%), by Material Type 2025 & 2033
- Figure 34: Europe TIC Market For The Metals And Minerals Industry Volume Share (%), by Material Type 2025 & 2033
- Figure 35: Europe TIC Market For The Metals And Minerals Industry Revenue (Million), by End-user Industry 2025 & 2033
- Figure 36: Europe TIC Market For The Metals And Minerals Industry Volume (Billion), by End-user Industry 2025 & 2033
- Figure 37: Europe TIC Market For The Metals And Minerals Industry Revenue Share (%), by End-user Industry 2025 & 2033
- Figure 38: Europe TIC Market For The Metals And Minerals Industry Volume Share (%), by End-user Industry 2025 & 2033
- Figure 39: Europe TIC Market For The Metals And Minerals Industry Revenue (Million), by Country 2025 & 2033
- Figure 40: Europe TIC Market For The Metals And Minerals Industry Volume (Billion), by Country 2025 & 2033
- Figure 41: Europe TIC Market For The Metals And Minerals Industry Revenue Share (%), by Country 2025 & 2033
- Figure 42: Europe TIC Market For The Metals And Minerals Industry Volume Share (%), by Country 2025 & 2033
- Figure 43: Asia TIC Market For The Metals And Minerals Industry Revenue (Million), by Operation Type 2025 & 2033
- Figure 44: Asia TIC Market For The Metals And Minerals Industry Volume (Billion), by Operation Type 2025 & 2033
- Figure 45: Asia TIC Market For The Metals And Minerals Industry Revenue Share (%), by Operation Type 2025 & 2033
- Figure 46: Asia TIC Market For The Metals And Minerals Industry Volume Share (%), by Operation Type 2025 & 2033
- Figure 47: Asia TIC Market For The Metals And Minerals Industry Revenue (Million), by Service Type 2025 & 2033
- Figure 48: Asia TIC Market For The Metals And Minerals Industry Volume (Billion), by Service Type 2025 & 2033
- Figure 49: Asia TIC Market For The Metals And Minerals Industry Revenue Share (%), by Service Type 2025 & 2033
- Figure 50: Asia TIC Market For The Metals And Minerals Industry Volume Share (%), by Service Type 2025 & 2033
- Figure 51: Asia TIC Market For The Metals And Minerals Industry Revenue (Million), by Material Type 2025 & 2033
- Figure 52: Asia TIC Market For The Metals And Minerals Industry Volume (Billion), by Material Type 2025 & 2033
- Figure 53: Asia TIC Market For The Metals And Minerals Industry Revenue Share (%), by Material Type 2025 & 2033
- Figure 54: Asia TIC Market For The Metals And Minerals Industry Volume Share (%), by Material Type 2025 & 2033
- Figure 55: Asia TIC Market For The Metals And Minerals Industry Revenue (Million), by End-user Industry 2025 & 2033
- Figure 56: Asia TIC Market For The Metals And Minerals Industry Volume (Billion), by End-user Industry 2025 & 2033
- Figure 57: Asia TIC Market For The Metals And Minerals Industry Revenue Share (%), by End-user Industry 2025 & 2033
- Figure 58: Asia TIC Market For The Metals And Minerals Industry Volume Share (%), by End-user Industry 2025 & 2033
- Figure 59: Asia TIC Market For The Metals And Minerals Industry Revenue (Million), by Country 2025 & 2033
- Figure 60: Asia TIC Market For The Metals And Minerals Industry Volume (Billion), by Country 2025 & 2033
- Figure 61: Asia TIC Market For The Metals And Minerals Industry Revenue Share (%), by Country 2025 & 2033
- Figure 62: Asia TIC Market For The Metals And Minerals Industry Volume Share (%), by Country 2025 & 2033
- Figure 63: Australia and New Zealand TIC Market For The Metals And Minerals Industry Revenue (Million), by Operation Type 2025 & 2033
- Figure 64: Australia and New Zealand TIC Market For The Metals And Minerals Industry Volume (Billion), by Operation Type 2025 & 2033
- Figure 65: Australia and New Zealand TIC Market For The Metals And Minerals Industry Revenue Share (%), by Operation Type 2025 & 2033
- Figure 66: Australia and New Zealand TIC Market For The Metals And Minerals Industry Volume Share (%), by Operation Type 2025 & 2033
- Figure 67: Australia and New Zealand TIC Market For The Metals And Minerals Industry Revenue (Million), by Service Type 2025 & 2033
- Figure 68: Australia and New Zealand TIC Market For The Metals And Minerals Industry Volume (Billion), by Service Type 2025 & 2033
- Figure 69: Australia and New Zealand TIC Market For The Metals And Minerals Industry Revenue Share (%), by Service Type 2025 & 2033
- Figure 70: Australia and New Zealand TIC Market For The Metals And Minerals Industry Volume Share (%), by Service Type 2025 & 2033
- Figure 71: Australia and New Zealand TIC Market For The Metals And Minerals Industry Revenue (Million), by Material Type 2025 & 2033
- Figure 72: Australia and New Zealand TIC Market For The Metals And Minerals Industry Volume (Billion), by Material Type 2025 & 2033
- Figure 73: Australia and New Zealand TIC Market For The Metals And Minerals Industry Revenue Share (%), by Material Type 2025 & 2033
- Figure 74: Australia and New Zealand TIC Market For The Metals And Minerals Industry Volume Share (%), by Material Type 2025 & 2033
- Figure 75: Australia and New Zealand TIC Market For The Metals And Minerals Industry Revenue (Million), by End-user Industry 2025 & 2033
- Figure 76: Australia and New Zealand TIC Market For The Metals And Minerals Industry Volume (Billion), by End-user Industry 2025 & 2033
- Figure 77: Australia and New Zealand TIC Market For The Metals And Minerals Industry Revenue Share (%), by End-user Industry 2025 & 2033
- Figure 78: Australia and New Zealand TIC Market For The Metals And Minerals Industry Volume Share (%), by End-user Industry 2025 & 2033
- Figure 79: Australia and New Zealand TIC Market For The Metals And Minerals Industry Revenue (Million), by Country 2025 & 2033
- Figure 80: Australia and New Zealand TIC Market For The Metals And Minerals Industry Volume (Billion), by Country 2025 & 2033
- Figure 81: Australia and New Zealand TIC Market For The Metals And Minerals Industry Revenue Share (%), by Country 2025 & 2033
- Figure 82: Australia and New Zealand TIC Market For The Metals And Minerals Industry Volume Share (%), by Country 2025 & 2033
- Figure 83: Latin America TIC Market For The Metals And Minerals Industry Revenue (Million), by Operation Type 2025 & 2033
- Figure 84: Latin America TIC Market For The Metals And Minerals Industry Volume (Billion), by Operation Type 2025 & 2033
- Figure 85: Latin America TIC Market For The Metals And Minerals Industry Revenue Share (%), by Operation Type 2025 & 2033
- Figure 86: Latin America TIC Market For The Metals And Minerals Industry Volume Share (%), by Operation Type 2025 & 2033
- Figure 87: Latin America TIC Market For The Metals And Minerals Industry Revenue (Million), by Service Type 2025 & 2033
- Figure 88: Latin America TIC Market For The Metals And Minerals Industry Volume (Billion), by Service Type 2025 & 2033
- Figure 89: Latin America TIC Market For The Metals And Minerals Industry Revenue Share (%), by Service Type 2025 & 2033
- Figure 90: Latin America TIC Market For The Metals And Minerals Industry Volume Share (%), by Service Type 2025 & 2033
- Figure 91: Latin America TIC Market For The Metals And Minerals Industry Revenue (Million), by Material Type 2025 & 2033
- Figure 92: Latin America TIC Market For The Metals And Minerals Industry Volume (Billion), by Material Type 2025 & 2033
- Figure 93: Latin America TIC Market For The Metals And Minerals Industry Revenue Share (%), by Material Type 2025 & 2033
- Figure 94: Latin America TIC Market For The Metals And Minerals Industry Volume Share (%), by Material Type 2025 & 2033
- Figure 95: Latin America TIC Market For The Metals And Minerals Industry Revenue (Million), by End-user Industry 2025 & 2033
- Figure 96: Latin America TIC Market For The Metals And Minerals Industry Volume (Billion), by End-user Industry 2025 & 2033
- Figure 97: Latin America TIC Market For The Metals And Minerals Industry Revenue Share (%), by End-user Industry 2025 & 2033
- Figure 98: Latin America TIC Market For The Metals And Minerals Industry Volume Share (%), by End-user Industry 2025 & 2033
- Figure 99: Latin America TIC Market For The Metals And Minerals Industry Revenue (Million), by Country 2025 & 2033
- Figure 100: Latin America TIC Market For The Metals And Minerals Industry Volume (Billion), by Country 2025 & 2033
- Figure 101: Latin America TIC Market For The Metals And Minerals Industry Revenue Share (%), by Country 2025 & 2033
- Figure 102: Latin America TIC Market For The Metals And Minerals Industry Volume Share (%), by Country 2025 & 2033
- Figure 103: Middle East and Africa TIC Market For The Metals And Minerals Industry Revenue (Million), by Operation Type 2025 & 2033
- Figure 104: Middle East and Africa TIC Market For The Metals And Minerals Industry Volume (Billion), by Operation Type 2025 & 2033
- Figure 105: Middle East and Africa TIC Market For The Metals And Minerals Industry Revenue Share (%), by Operation Type 2025 & 2033
- Figure 106: Middle East and Africa TIC Market For The Metals And Minerals Industry Volume Share (%), by Operation Type 2025 & 2033
- Figure 107: Middle East and Africa TIC Market For The Metals And Minerals Industry Revenue (Million), by Service Type 2025 & 2033
- Figure 108: Middle East and Africa TIC Market For The Metals And Minerals Industry Volume (Billion), by Service Type 2025 & 2033
- Figure 109: Middle East and Africa TIC Market For The Metals And Minerals Industry Revenue Share (%), by Service Type 2025 & 2033
- Figure 110: Middle East and Africa TIC Market For The Metals And Minerals Industry Volume Share (%), by Service Type 2025 & 2033
- Figure 111: Middle East and Africa TIC Market For The Metals And Minerals Industry Revenue (Million), by Material Type 2025 & 2033
- Figure 112: Middle East and Africa TIC Market For The Metals And Minerals Industry Volume (Billion), by Material Type 2025 & 2033
- Figure 113: Middle East and Africa TIC Market For The Metals And Minerals Industry Revenue Share (%), by Material Type 2025 & 2033
- Figure 114: Middle East and Africa TIC Market For The Metals And Minerals Industry Volume Share (%), by Material Type 2025 & 2033
- Figure 115: Middle East and Africa TIC Market For The Metals And Minerals Industry Revenue (Million), by End-user Industry 2025 & 2033
- Figure 116: Middle East and Africa TIC Market For The Metals And Minerals Industry Volume (Billion), by End-user Industry 2025 & 2033
- Figure 117: Middle East and Africa TIC Market For The Metals And Minerals Industry Revenue Share (%), by End-user Industry 2025 & 2033
- Figure 118: Middle East and Africa TIC Market For The Metals And Minerals Industry Volume Share (%), by End-user Industry 2025 & 2033
- Figure 119: Middle East and Africa TIC Market For The Metals And Minerals Industry Revenue (Million), by Country 2025 & 2033
- Figure 120: Middle East and Africa TIC Market For The Metals And Minerals Industry Volume (Billion), by Country 2025 & 2033
- Figure 121: Middle East and Africa TIC Market For The Metals And Minerals Industry Revenue Share (%), by Country 2025 & 2033
- Figure 122: Middle East and Africa TIC Market For The Metals And Minerals Industry Volume Share (%), by Country 2025 & 2033
List of Tables
- Table 1: Global TIC Market For The Metals And Minerals Industry Revenue Million Forecast, by Operation Type 2020 & 2033
- Table 2: Global TIC Market For The Metals And Minerals Industry Volume Billion Forecast, by Operation Type 2020 & 2033
- Table 3: Global TIC Market For The Metals And Minerals Industry Revenue Million Forecast, by Service Type 2020 & 2033
- Table 4: Global TIC Market For The Metals And Minerals Industry Volume Billion Forecast, by Service Type 2020 & 2033
- Table 5: Global TIC Market For The Metals And Minerals Industry Revenue Million Forecast, by Material Type 2020 & 2033
- Table 6: Global TIC Market For The Metals And Minerals Industry Volume Billion Forecast, by Material Type 2020 & 2033
- Table 7: Global TIC Market For The Metals And Minerals Industry Revenue Million Forecast, by End-user Industry 2020 & 2033
- Table 8: Global TIC Market For The Metals And Minerals Industry Volume Billion Forecast, by End-user Industry 2020 & 2033
- Table 9: Global TIC Market For The Metals And Minerals Industry Revenue Million Forecast, by Region 2020 & 2033
- Table 10: Global TIC Market For The Metals And Minerals Industry Volume Billion Forecast, by Region 2020 & 2033
- Table 11: Global TIC Market For The Metals And Minerals Industry Revenue Million Forecast, by Operation Type 2020 & 2033
- Table 12: Global TIC Market For The Metals And Minerals Industry Volume Billion Forecast, by Operation Type 2020 & 2033
- Table 13: Global TIC Market For The Metals And Minerals Industry Revenue Million Forecast, by Service Type 2020 & 2033
- Table 14: Global TIC Market For The Metals And Minerals Industry Volume Billion Forecast, by Service Type 2020 & 2033
- Table 15: Global TIC Market For The Metals And Minerals Industry Revenue Million Forecast, by Material Type 2020 & 2033
- Table 16: Global TIC Market For The Metals And Minerals Industry Volume Billion Forecast, by Material Type 2020 & 2033
- Table 17: Global TIC Market For The Metals And Minerals Industry Revenue Million Forecast, by End-user Industry 2020 & 2033
- Table 18: Global TIC Market For The Metals And Minerals Industry Volume Billion Forecast, by End-user Industry 2020 & 2033
- Table 19: Global TIC Market For The Metals And Minerals Industry Revenue Million Forecast, by Country 2020 & 2033
- Table 20: Global TIC Market For The Metals And Minerals Industry Volume Billion Forecast, by Country 2020 & 2033
- Table 21: United States TIC Market For The Metals And Minerals Industry Revenue (Million) Forecast, by Application 2020 & 2033
- Table 22: United States TIC Market For The Metals And Minerals Industry Volume (Billion) Forecast, by Application 2020 & 2033
- Table 23: Canada TIC Market For The Metals And Minerals Industry Revenue (Million) Forecast, by Application 2020 & 2033
- Table 24: Canada TIC Market For The Metals And Minerals Industry Volume (Billion) Forecast, by Application 2020 & 2033
- Table 25: Global TIC Market For The Metals And Minerals Industry Revenue Million Forecast, by Operation Type 2020 & 2033
- Table 26: Global TIC Market For The Metals And Minerals Industry Volume Billion Forecast, by Operation Type 2020 & 2033
- Table 27: Global TIC Market For The Metals And Minerals Industry Revenue Million Forecast, by Service Type 2020 & 2033
- Table 28: Global TIC Market For The Metals And Minerals Industry Volume Billion Forecast, by Service Type 2020 & 2033
- Table 29: Global TIC Market For The Metals And Minerals Industry Revenue Million Forecast, by Material Type 2020 & 2033
- Table 30: Global TIC Market For The Metals And Minerals Industry Volume Billion Forecast, by Material Type 2020 & 2033
- Table 31: Global TIC Market For The Metals And Minerals Industry Revenue Million Forecast, by End-user Industry 2020 & 2033
- Table 32: Global TIC Market For The Metals And Minerals Industry Volume Billion Forecast, by End-user Industry 2020 & 2033
- Table 33: Global TIC Market For The Metals And Minerals Industry Revenue Million Forecast, by Country 2020 & 2033
- Table 34: Global TIC Market For The Metals And Minerals Industry Volume Billion Forecast, by Country 2020 & 2033
- Table 35: United Kingdom TIC Market For The Metals And Minerals Industry Revenue (Million) Forecast, by Application 2020 & 2033
- Table 36: United Kingdom TIC Market For The Metals And Minerals Industry Volume (Billion) Forecast, by Application 2020 & 2033
- Table 37: Germany TIC Market For The Metals And Minerals Industry Revenue (Million) Forecast, by Application 2020 & 2033
- Table 38: Germany TIC Market For The Metals And Minerals Industry Volume (Billion) Forecast, by Application 2020 & 2033
- Table 39: France TIC Market For The Metals And Minerals Industry Revenue (Million) Forecast, by Application 2020 & 2033
- Table 40: France TIC Market For The Metals And Minerals Industry Volume (Billion) Forecast, by Application 2020 & 2033
- Table 41: Global TIC Market For The Metals And Minerals Industry Revenue Million Forecast, by Operation Type 2020 & 2033
- Table 42: Global TIC Market For The Metals And Minerals Industry Volume Billion Forecast, by Operation Type 2020 & 2033
- Table 43: Global TIC Market For The Metals And Minerals Industry Revenue Million Forecast, by Service Type 2020 & 2033
- Table 44: Global TIC Market For The Metals And Minerals Industry Volume Billion Forecast, by Service Type 2020 & 2033
- Table 45: Global TIC Market For The Metals And Minerals Industry Revenue Million Forecast, by Material Type 2020 & 2033
- Table 46: Global TIC Market For The Metals And Minerals Industry Volume Billion Forecast, by Material Type 2020 & 2033
- Table 47: Global TIC Market For The Metals And Minerals Industry Revenue Million Forecast, by End-user Industry 2020 & 2033
- Table 48: Global TIC Market For The Metals And Minerals Industry Volume Billion Forecast, by End-user Industry 2020 & 2033
- Table 49: Global TIC Market For The Metals And Minerals Industry Revenue Million Forecast, by Country 2020 & 2033
- Table 50: Global TIC Market For The Metals And Minerals Industry Volume Billion Forecast, by Country 2020 & 2033
- Table 51: China TIC Market For The Metals And Minerals Industry Revenue (Million) Forecast, by Application 2020 & 2033
- Table 52: China TIC Market For The Metals And Minerals Industry Volume (Billion) Forecast, by Application 2020 & 2033
- Table 53: Japan TIC Market For The Metals And Minerals Industry Revenue (Million) Forecast, by Application 2020 & 2033
- Table 54: Japan TIC Market For The Metals And Minerals Industry Volume (Billion) Forecast, by Application 2020 & 2033
- Table 55: South Korea TIC Market For The Metals And Minerals Industry Revenue (Million) Forecast, by Application 2020 & 2033
- Table 56: South Korea TIC Market For The Metals And Minerals Industry Volume (Billion) Forecast, by Application 2020 & 2033
- Table 57: South East Asia TIC Market For The Metals And Minerals Industry Revenue (Million) Forecast, by Application 2020 & 2033
- Table 58: South East Asia TIC Market For The Metals And Minerals Industry Volume (Billion) Forecast, by Application 2020 & 2033
- Table 59: India TIC Market For The Metals And Minerals Industry Revenue (Million) Forecast, by Application 2020 & 2033
- Table 60: India TIC Market For The Metals And Minerals Industry Volume (Billion) Forecast, by Application 2020 & 2033
- Table 61: Global TIC Market For The Metals And Minerals Industry Revenue Million Forecast, by Operation Type 2020 & 2033
- Table 62: Global TIC Market For The Metals And Minerals Industry Volume Billion Forecast, by Operation Type 2020 & 2033
- Table 63: Global TIC Market For The Metals And Minerals Industry Revenue Million Forecast, by Service Type 2020 & 2033
- Table 64: Global TIC Market For The Metals And Minerals Industry Volume Billion Forecast, by Service Type 2020 & 2033
- Table 65: Global TIC Market For The Metals And Minerals Industry Revenue Million Forecast, by Material Type 2020 & 2033
- Table 66: Global TIC Market For The Metals And Minerals Industry Volume Billion Forecast, by Material Type 2020 & 2033
- Table 67: Global TIC Market For The Metals And Minerals Industry Revenue Million Forecast, by End-user Industry 2020 & 2033
- Table 68: Global TIC Market For The Metals And Minerals Industry Volume Billion Forecast, by End-user Industry 2020 & 2033
- Table 69: Global TIC Market For The Metals And Minerals Industry Revenue Million Forecast, by Country 2020 & 2033
- Table 70: Global TIC Market For The Metals And Minerals Industry Volume Billion Forecast, by Country 2020 & 2033
- Table 71: Global TIC Market For The Metals And Minerals Industry Revenue Million Forecast, by Operation Type 2020 & 2033
- Table 72: Global TIC Market For The Metals And Minerals Industry Volume Billion Forecast, by Operation Type 2020 & 2033
- Table 73: Global TIC Market For The Metals And Minerals Industry Revenue Million Forecast, by Service Type 2020 & 2033
- Table 74: Global TIC Market For The Metals And Minerals Industry Volume Billion Forecast, by Service Type 2020 & 2033
- Table 75: Global TIC Market For The Metals And Minerals Industry Revenue Million Forecast, by Material Type 2020 & 2033
- Table 76: Global TIC Market For The Metals And Minerals Industry Volume Billion Forecast, by Material Type 2020 & 2033
- Table 77: Global TIC Market For The Metals And Minerals Industry Revenue Million Forecast, by End-user Industry 2020 & 2033
- Table 78: Global TIC Market For The Metals And Minerals Industry Volume Billion Forecast, by End-user Industry 2020 & 2033
- Table 79: Global TIC Market For The Metals And Minerals Industry Revenue Million Forecast, by Country 2020 & 2033
- Table 80: Global TIC Market For The Metals And Minerals Industry Volume Billion Forecast, by Country 2020 & 2033
- Table 81: Global TIC Market For The Metals And Minerals Industry Revenue Million Forecast, by Operation Type 2020 & 2033
- Table 82: Global TIC Market For The Metals And Minerals Industry Volume Billion Forecast, by Operation Type 2020 & 2033
- Table 83: Global TIC Market For The Metals And Minerals Industry Revenue Million Forecast, by Service Type 2020 & 2033
- Table 84: Global TIC Market For The Metals And Minerals Industry Volume Billion Forecast, by Service Type 2020 & 2033
- Table 85: Global TIC Market For The Metals And Minerals Industry Revenue Million Forecast, by Material Type 2020 & 2033
- Table 86: Global TIC Market For The Metals And Minerals Industry Volume Billion Forecast, by Material Type 2020 & 2033
- Table 87: Global TIC Market For The Metals And Minerals Industry Revenue Million Forecast, by End-user Industry 2020 & 2033
- Table 88: Global TIC Market For The Metals And Minerals Industry Volume Billion Forecast, by End-user Industry 2020 & 2033
- Table 89: Global TIC Market For The Metals And Minerals Industry Revenue Million Forecast, by Country 2020 & 2033
- Table 90: Global TIC Market For The Metals And Minerals Industry Volume Billion Forecast, by Country 2020 & 2033
Frequently Asked Questions
1. What is the projected Compound Annual Growth Rate (CAGR) of the TIC Market For The Metals And Minerals Industry?
The projected CAGR is approximately 4.30%.
2. Which companies are prominent players in the TIC Market For The Metals And Minerals Industry?
Key companies in the market include SGS SA, Bureau Veritas SA, Intertek Group PLC, TUV SUD, DEKRA SE, ALS Limited, Applus+, Eurofins Scientific SE, DNV Group AS, Element Materials Technology Group Limited, Mistras Group Inc, Kiwa NV, UL Solutions Inc, Rina SPA, Qima, Westmoreland Mechanical Testing and Research Inc, Laboratory Testing Inc, NSL Analytical Services Inc, IMR Test Labs (Curtiss Wright Corporation), Applied Technical Services LLC*List Not Exhaustive.
3. What are the main segments of the TIC Market For The Metals And Minerals Industry?
The market segments include Operation Type, Service Type, Material Type, End-user Industry.
4. Can you provide details about the market size?
The market size is estimated to be USD 19.53 Million as of 2022.
5. What are some drivers contributing to market growth?
Rising Demand For Critical Minerals; Government Regulations and Mandates to Ensure Product Safety and Environmental Protection.
6. What are the notable trends driving market growth?
Construction Industry to be the Largest End User.
7. Are there any restraints impacting market growth?
Rising Demand For Critical Minerals; Government Regulations and Mandates to Ensure Product Safety and Environmental Protection.
8. Can you provide examples of recent developments in the market?
August 2024: Element Materials Technology has invested USD 13 million to bolster its Canadian operations. This investment will launch of two new laboratories in Toronto, Ontario. One of these is an advanced life sciences laboratory focusing on pharmaceutical testing. The upgraded facility boasts enhancements across various departments, such as metals testing and materials characterization, positioning Element to better cater to the surging demands of the pharmaceutical and biotechnology sectors.June 2024: UL Solutions Inc. announced plans to build a new facility called the Advanced Automotive and Battery Testing Center in Pyeongtaek, Gyeonggi-do, Korea. This initiative aims to enhance the existing battery testing capacity of UL Solutions in the region while also incorporating EV charger testing and various other capabilities. It is projected to commence operations in the latter part of 2025. The primary goals of this venture include bolstering Korea's EV industry, addressing the growing demand from both new and current clients, and streamlining the process of safety and performance testing as well as other related services.March 2024: Applus+ played a prominent role in the technical supervision of the project for the construction of the 220 kV Transmission Line Derivation L-2264 between the Ishcayucro and Raurapata substations. This project's scope encompassed the construction of a single-circuit 220 kV transmission line and a new GIS 220/33/22.9 kV substation in Raurapata. The line, with a length of 28.3 km, uses ACSR 591mm2 conductor and lattice steel structures.
9. What pricing options are available for accessing the report?
Pricing options include single-user, multi-user, and enterprise licenses priced at USD 4750, USD 5250, and USD 8750 respectively.
10. Is the market size provided in terms of value or volume?
The market size is provided in terms of value, measured in Million and volume, measured in Billion.
11. Are there any specific market keywords associated with the report?
Yes, the market keyword associated with the report is "TIC Market For The Metals And Minerals Industry," which aids in identifying and referencing the specific market segment covered.
12. How do I determine which pricing option suits my needs best?
The pricing options vary based on user requirements and access needs. Individual users may opt for single-user licenses, while businesses requiring broader access may choose multi-user or enterprise licenses for cost-effective access to the report.
13. Are there any additional resources or data provided in the TIC Market For The Metals And Minerals Industry report?
While the report offers comprehensive insights, it's advisable to review the specific contents or supplementary materials provided to ascertain if additional resources or data are available.
14. How can I stay updated on further developments or reports in the TIC Market For The Metals And Minerals Industry?
To stay informed about further developments, trends, and reports in the TIC Market For The Metals And Minerals Industry, consider subscribing to industry newsletters, following relevant companies and organizations, or regularly checking reputable industry news sources and publications.
Methodology
Step 1 - Identification of Relevant Samples Size from Population Database


Step 2 - Approaches for Defining Global Market Size (Value, Volume* & Price*)

Note*: In applicable scenarios
Step 3 - Data Sources
Primary Research
- Web Analytics
- Survey Reports
- Research Institute
- Latest Research Reports
- Opinion Leaders
Secondary Research
- Annual Reports
- White Paper
- Latest Press Release
- Industry Association
- Paid Database
- Investor Presentations

Step 4 - Data Triangulation
Involves using different sources of information in order to increase the validity of a study
These sources are likely to be stakeholders in a program - participants, other researchers, program staff, other community members, and so on.
Then we put all data in single framework & apply various statistical tools to find out the dynamic on the market.
During the analysis stage, feedback from the stakeholder groups would be compared to determine areas of agreement as well as areas of divergence