
Key Insights
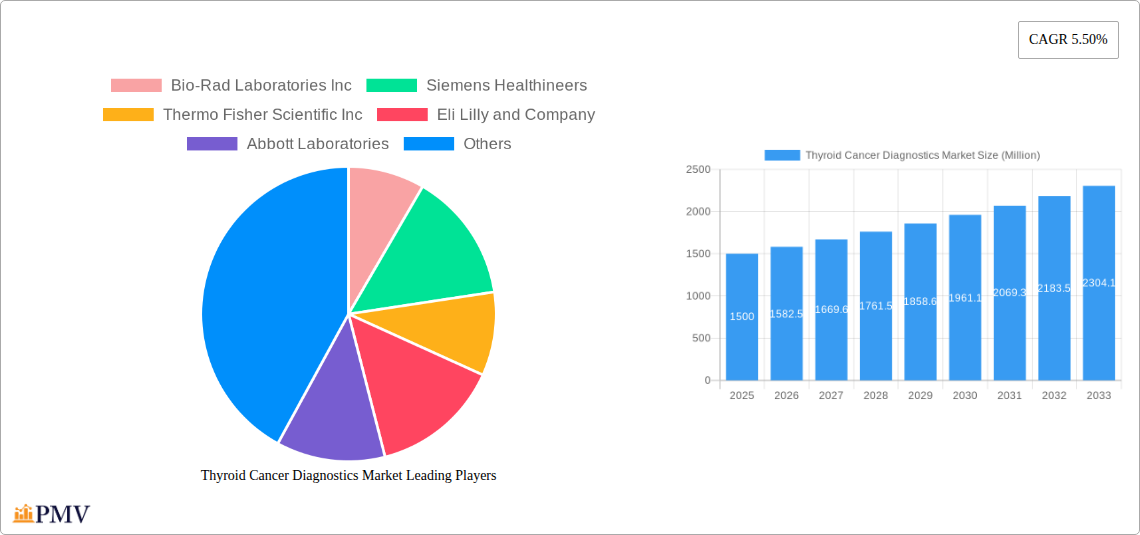
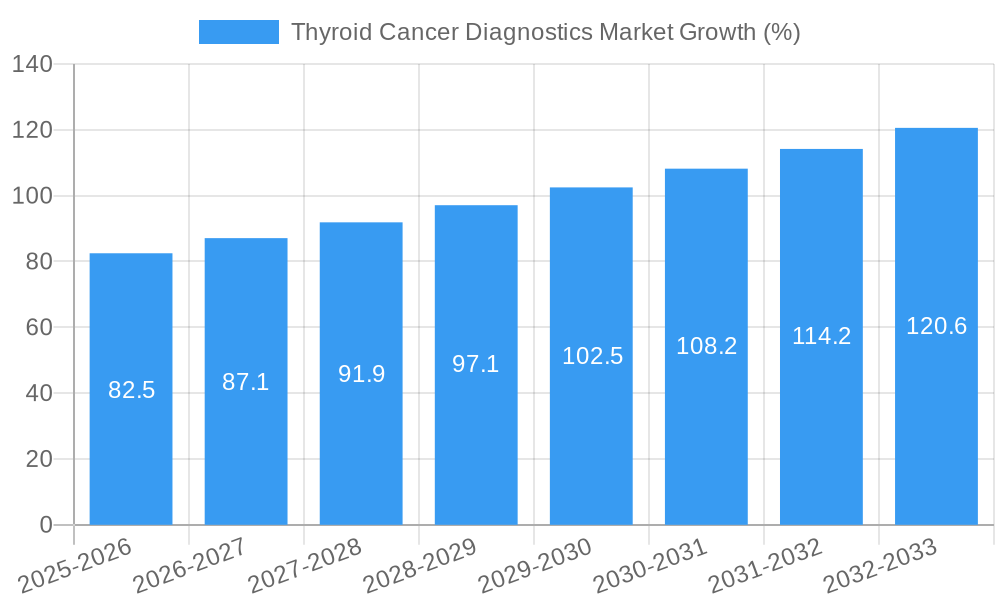
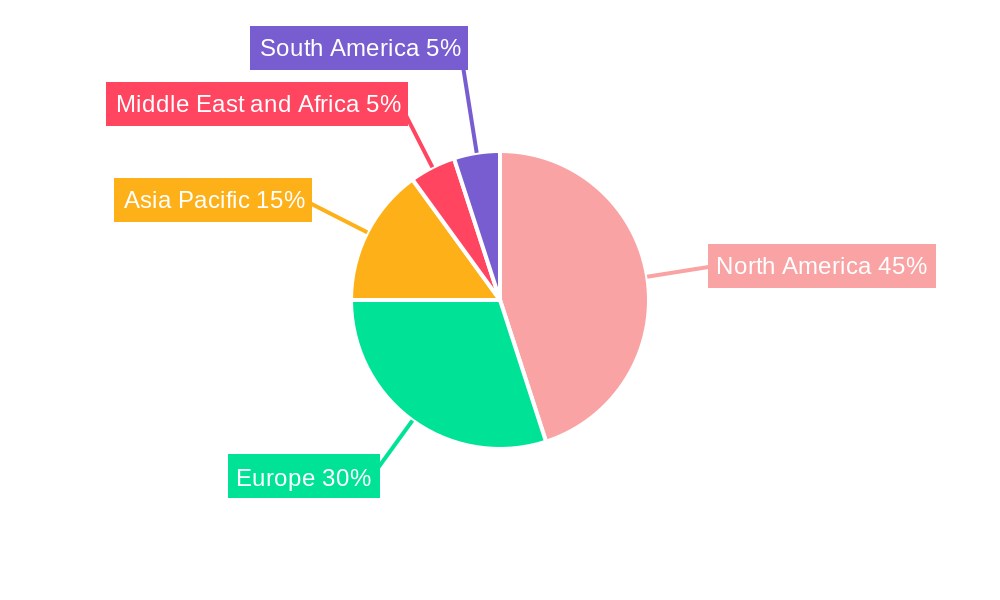
The Thyroid Cancer Diagnostics Market is experiencing robust growth, projected to reach a substantial size by 2033. A Compound Annual Growth Rate (CAGR) of 5.50% from 2025 to 2033 indicates a consistently expanding market driven by several key factors. Rising prevalence of thyroid cancer, particularly papillary and follicular carcinomas, is a primary driver. Technological advancements in diagnostic techniques, such as more sensitive blood tests and advanced imaging modalities (like ultrasound and PET scans), are improving early detection rates and contributing to market expansion. Furthermore, the increasing awareness of thyroid cancer among the general population and healthcare professionals is leading to greater screening rates and earlier diagnosis. The market is segmented by disease type, diagnostic technique, and end-user, with hospital laboratories and cancer diagnostic centers representing significant market shares. The North American region, particularly the United States, currently holds a dominant position, driven by advanced healthcare infrastructure and high disposable incomes. However, Asia Pacific is expected to witness significant growth in the coming years due to rising healthcare expenditure and increasing awareness campaigns. Competition among established players like Bio-Rad Laboratories Inc., Siemens Healthineers, and Thermo Fisher Scientific Inc., alongside emerging companies, is fostering innovation and driving down costs, making diagnostic testing more accessible. Despite these positive trends, certain challenges such as the high cost of advanced diagnostic technologies and limited access to healthcare in some regions might act as restraints.
The future of the Thyroid Cancer Diagnostics Market appears promising, with continued growth predicted throughout the forecast period. The integration of artificial intelligence and machine learning in diagnostic imaging and analysis is expected to revolutionize the field, leading to more accurate and efficient diagnoses. The development of novel biomarkers and liquid biopsies holds the potential to further improve early detection capabilities and personalized treatment strategies. The increasing demand for point-of-care diagnostics could also create new market opportunities. However, regulatory hurdles and reimbursement policies will play a crucial role in shaping the market's trajectory in different geographical regions. Companies are focusing on strategic partnerships, acquisitions, and research and development activities to stay competitive and capitalize on future growth prospects. This necessitates a robust understanding of market dynamics to leverage strategic opportunities and navigate market challenges effectively.
Thyroid Cancer Diagnostics Market: A Comprehensive Report (2019-2033)
This detailed report provides a comprehensive analysis of the Thyroid Cancer Diagnostics Market, offering invaluable insights for stakeholders across the industry. The study period covers 2019-2033, with 2025 serving as the base and estimated year. The forecast period spans 2025-2033, building upon the historical period of 2019-2024. The market is segmented by disease type (Papillary Carcinoma, Follicular Carcinoma, Other Disease Types), diagnostic technique (Blood Tests, Imaging, Biopsy, Other Diagnostic Techniques), and end-user (Hospital Laboratories, Cancer Diagnostic Centers, Other End Users). Key players analyzed include Bio-Rad Laboratories Inc, Siemens Healthineers, Thermo Fisher Scientific Inc, Eli Lilly and Company, Abbott Laboratories, Agilent Technologies Inc, Daiichi Sanyoo, Koninklijke Philips NV, Illumina Inc, General Electric Company, and Hoffmann-La Roche Ltd.
Thyroid Cancer Diagnostics Market Market Structure & Competitive Dynamics
The Thyroid Cancer Diagnostics market exhibits a moderately concentrated structure, with several large multinational corporations holding significant market share. The market share of the top five players in 2025 is estimated at xx%. Innovation within the sector is driven by advancements in molecular diagnostics, imaging technologies, and AI-powered diagnostic tools. Regulatory frameworks, varying across geographies, significantly influence market access and product approval timelines. Stringent regulatory requirements for diagnostic devices and associated costs pose challenges. Substitutes, such as alternative diagnostic approaches or treatment strategies, exert competitive pressure. End-user trends, particularly the increasing adoption of minimally invasive procedures and the preference for rapid diagnostic techniques, are shaping market growth. M&A activity within the market has been moderate in recent years, with deal values averaging approximately xx Million annually during the historical period. Notable mergers focused on expanding product portfolios and geographical reach.
- Market Concentration: Moderately concentrated, with top 5 players holding xx% market share in 2025.
- Innovation: Advancements in molecular diagnostics, imaging, and AI-driven tools.
- Regulatory Landscape: Stringent regulations impacting market access and approval timelines.
- M&A Activity: Moderate activity, with average annual deal values of approximately xx Million (2019-2024).
Thyroid Cancer Diagnostics Market Industry Trends & Insights
The global Thyroid Cancer Diagnostics market is experiencing robust growth, driven by increasing prevalence of thyroid cancer, rising healthcare expenditure, and technological advancements in diagnostic techniques. The market is projected to register a CAGR of xx% during the forecast period (2025-2033). Technological disruptions, such as the integration of artificial intelligence (AI) and machine learning (ML) in image analysis and biomarker detection, are significantly enhancing diagnostic accuracy and efficiency. Consumer preferences are shifting towards minimally invasive procedures and rapid diagnostic tests, fueling demand for advanced technologies. Competitive dynamics are characterized by ongoing innovation, strategic partnerships, and a focus on product differentiation. Market penetration of novel diagnostic techniques, particularly liquid biopsies and advanced imaging modalities, is increasing steadily.
Dominant Markets & Segments in Thyroid Cancer Diagnostics Market
The North American region currently holds the largest market share in the Thyroid Cancer Diagnostics market, driven by high healthcare expenditure, advanced healthcare infrastructure, and increasing prevalence of thyroid cancer. Within disease types, Papillary Carcinoma accounts for the largest segment, followed by Follicular Carcinoma. Imaging techniques dominate the diagnostic methods segment due to high sensitivity and specificity. Hospital laboratories constitute the largest end-user segment due to their established infrastructure and capacity.
- Leading Region: North America
- Key Drivers for North America: High healthcare expenditure, advanced infrastructure, high prevalence of thyroid cancer.
- Dominant Disease Type: Papillary Carcinoma (due to high prevalence).
- Dominant Diagnostic Technique: Imaging (high sensitivity and specificity)
- Dominant End-User: Hospital Laboratories (established infrastructure and capacity).
Thyroid Cancer Diagnostics Market Product Innovations
Recent product innovations in the Thyroid Cancer Diagnostics market focus on improving diagnostic accuracy, reducing invasiveness, and shortening turnaround times. This includes advancements in molecular diagnostics, such as next-generation sequencing (NGS) and liquid biopsies, as well as improved imaging techniques like PET/CT scans with advanced contrast agents. These innovations offer enhanced sensitivity and specificity, enabling earlier diagnosis and personalized treatment plans. The market is also witnessing the integration of AI-powered image analysis tools for faster and more accurate interpretation of diagnostic images. These advancements are expected to further accelerate market growth in the coming years.
Report Segmentation & Scope
This report segments the Thyroid Cancer Diagnostics market by disease type (Papillary Carcinoma, Follicular Carcinoma, Other Disease Types), diagnostic technique (Blood Tests, Imaging, Biopsy, Other Diagnostic Techniques), and end-user (Hospital Laboratories, Cancer Diagnostic Centers, Other End Users). Each segment’s growth projections, market size, and competitive dynamics are analyzed in detail. The Papillary Carcinoma segment is expected to show significant growth due to its high prevalence. Imaging techniques are expected to maintain market dominance due to advancements and accuracy. Hospital laboratories will continue to be the leading end-user due to their established infrastructure.
Key Drivers of Thyroid Cancer Diagnostics Market Growth
Several factors are driving the growth of the Thyroid Cancer Diagnostics market, including the rising prevalence of thyroid cancer globally, increased awareness and early detection initiatives, technological advancements leading to more accurate and efficient diagnostic tools, and growing healthcare expenditure. Favorable regulatory policies promoting innovation in medical devices also contribute to the market expansion.
Challenges in the Thyroid Cancer Diagnostics Market Sector
The Thyroid Cancer Diagnostics market faces challenges such as high costs associated with advanced diagnostic technologies, stringent regulatory approvals for new devices, and the potential for reimbursement issues. Competition among established players and the entry of new players could also lead to price pressures, impacting profitability. Furthermore, maintaining the integrity of the supply chain amidst potential disruptions is also a concern.
Leading Players in the Thyroid Cancer Diagnostics Market Market
- Bio-Rad Laboratories Inc
- Siemens Healthineers
- Thermo Fisher Scientific Inc
- Eli Lilly and Company
- Abbott Laboratories
- Agilent Technologies Inc
- Daiichi Sanyoo
- Koninklijke Philips NV
- Illumina Inc
- General Electric Company
- Hoffmann-La Roche Ltd
Key Developments in Thyroid Cancer Diagnostics Market Sector
- 2022 Q4: Abbott Laboratories launched a new rapid diagnostic test for thyroid cancer.
- 2023 Q1: Siemens Healthineers announced a strategic partnership with a biotech company to develop AI-powered diagnostic tools.
- 2023 Q3: Thermo Fisher Scientific Inc. acquired a smaller company specializing in liquid biopsy technology. (Further details on other developments will be added to the full report)
Strategic Thyroid Cancer Diagnostics Market Market Outlook
The Thyroid Cancer Diagnostics market presents significant growth potential driven by continuous technological advancements, rising healthcare expenditure, and an increasing focus on early disease detection. Strategic opportunities exist for companies to invest in innovative diagnostic technologies, expand their geographical reach, and establish strategic partnerships to enhance market penetration. Furthermore, focusing on personalized medicine approaches and integrating AI-driven tools offers substantial growth opportunities in the years to come.
Thyroid Cancer Diagnostics Market Segmentation
-
1. Disease Type
- 1.1. Papillary Carcinoma
- 1.2. Follicular Carcinoma
- 1.3. Other Disease Types
-
2. Diagnostic Technique
- 2.1. Blood Tests
- 2.2. Imaging
- 2.3. Biopsy
- 2.4. Other Diagnostic Techniques
-
3. End User
- 3.1. Hospital Laboratories
- 3.2. Cancer Diagnostic Centers
- 3.3. Other End Users
Thyroid Cancer Diagnostics Market Segmentation By Geography
-
1. North America
- 1.1. United States
- 1.2. Canada
- 1.3. Mexico
-
2. Europe
- 2.1. Germany
- 2.2. United Kingdom
- 2.3. France
- 2.4. Spain
- 2.5. Italy
- 2.6. Rest of Europe
-
3. Asia Pacific
- 3.1. China
- 3.2. Japan
- 3.3. India
- 3.4. Austalia
- 3.5. South Korea
- 3.6. Rest of Asia Pacific
-
4. Middle East and Africa
- 4.1. GCC
- 4.2. South Africa
- 4.3. Rest of Middle East and Africa
-
5. South America
- 5.1. Brazil
- 5.2. Argentina
- 5.3. Rest of South America
Thyroid Cancer Diagnostics Market REPORT HIGHLIGHTS
| Aspects | Details |
|---|---|
| Study Period | 2019-2033 |
| Base Year | 2024 |
| Estimated Year | 2025 |
| Forecast Period | 2025-2033 |
| Historical Period | 2019-2024 |
| Growth Rate | CAGR of 5.50% from 2019-2033 |
| Segmentation |
|
Table of Contents
- 1. Introduction
- 1.1. Research Scope
- 1.2. Market Segmentation
- 1.3. Research Methodology
- 1.4. Definitions and Assumptions
- 2. Executive Summary
- 2.1. Introduction
- 3. Market Dynamics
- 3.1. Introduction
- 3.2. Market Drivers
- 3.2.1. Increase in Government Spending on Creating Awareness; Rise in Detection of Thyroid Cancer Cases
- 3.3. Market Restrains
- 3.3.1. Lack of Knowledge and Awareness
- 3.4. Market Trends
- 3.4.1. The Papillary Carcinoma Segment is Expected to Hold a Major Share in the Market During the Forecast Period
- 4. Market Factor Analysis
- 4.1. Porters Five Forces
- 4.2. Supply/Value Chain
- 4.3. PESTEL analysis
- 4.4. Market Entropy
- 4.5. Patent/Trademark Analysis
- 5. Global Thyroid Cancer Diagnostics Market Analysis, Insights and Forecast, 2019-2031
- 5.1. Market Analysis, Insights and Forecast - by Disease Type
- 5.1.1. Papillary Carcinoma
- 5.1.2. Follicular Carcinoma
- 5.1.3. Other Disease Types
- 5.2. Market Analysis, Insights and Forecast - by Diagnostic Technique
- 5.2.1. Blood Tests
- 5.2.2. Imaging
- 5.2.3. Biopsy
- 5.2.4. Other Diagnostic Techniques
- 5.3. Market Analysis, Insights and Forecast - by End User
- 5.3.1. Hospital Laboratories
- 5.3.2. Cancer Diagnostic Centers
- 5.3.3. Other End Users
- 5.4. Market Analysis, Insights and Forecast - by Region
- 5.4.1. North America
- 5.4.2. Europe
- 5.4.3. Asia Pacific
- 5.4.4. Middle East and Africa
- 5.4.5. South America
- 5.1. Market Analysis, Insights and Forecast - by Disease Type
- 6. North America Thyroid Cancer Diagnostics Market Analysis, Insights and Forecast, 2019-2031
- 6.1. Market Analysis, Insights and Forecast - by Disease Type
- 6.1.1. Papillary Carcinoma
- 6.1.2. Follicular Carcinoma
- 6.1.3. Other Disease Types
- 6.2. Market Analysis, Insights and Forecast - by Diagnostic Technique
- 6.2.1. Blood Tests
- 6.2.2. Imaging
- 6.2.3. Biopsy
- 6.2.4. Other Diagnostic Techniques
- 6.3. Market Analysis, Insights and Forecast - by End User
- 6.3.1. Hospital Laboratories
- 6.3.2. Cancer Diagnostic Centers
- 6.3.3. Other End Users
- 6.1. Market Analysis, Insights and Forecast - by Disease Type
- 7. Europe Thyroid Cancer Diagnostics Market Analysis, Insights and Forecast, 2019-2031
- 7.1. Market Analysis, Insights and Forecast - by Disease Type
- 7.1.1. Papillary Carcinoma
- 7.1.2. Follicular Carcinoma
- 7.1.3. Other Disease Types
- 7.2. Market Analysis, Insights and Forecast - by Diagnostic Technique
- 7.2.1. Blood Tests
- 7.2.2. Imaging
- 7.2.3. Biopsy
- 7.2.4. Other Diagnostic Techniques
- 7.3. Market Analysis, Insights and Forecast - by End User
- 7.3.1. Hospital Laboratories
- 7.3.2. Cancer Diagnostic Centers
- 7.3.3. Other End Users
- 7.1. Market Analysis, Insights and Forecast - by Disease Type
- 8. Asia Pacific Thyroid Cancer Diagnostics Market Analysis, Insights and Forecast, 2019-2031
- 8.1. Market Analysis, Insights and Forecast - by Disease Type
- 8.1.1. Papillary Carcinoma
- 8.1.2. Follicular Carcinoma
- 8.1.3. Other Disease Types
- 8.2. Market Analysis, Insights and Forecast - by Diagnostic Technique
- 8.2.1. Blood Tests
- 8.2.2. Imaging
- 8.2.3. Biopsy
- 8.2.4. Other Diagnostic Techniques
- 8.3. Market Analysis, Insights and Forecast - by End User
- 8.3.1. Hospital Laboratories
- 8.3.2. Cancer Diagnostic Centers
- 8.3.3. Other End Users
- 8.1. Market Analysis, Insights and Forecast - by Disease Type
- 9. Middle East and Africa Thyroid Cancer Diagnostics Market Analysis, Insights and Forecast, 2019-2031
- 9.1. Market Analysis, Insights and Forecast - by Disease Type
- 9.1.1. Papillary Carcinoma
- 9.1.2. Follicular Carcinoma
- 9.1.3. Other Disease Types
- 9.2. Market Analysis, Insights and Forecast - by Diagnostic Technique
- 9.2.1. Blood Tests
- 9.2.2. Imaging
- 9.2.3. Biopsy
- 9.2.4. Other Diagnostic Techniques
- 9.3. Market Analysis, Insights and Forecast - by End User
- 9.3.1. Hospital Laboratories
- 9.3.2. Cancer Diagnostic Centers
- 9.3.3. Other End Users
- 9.1. Market Analysis, Insights and Forecast - by Disease Type
- 10. South America Thyroid Cancer Diagnostics Market Analysis, Insights and Forecast, 2019-2031
- 10.1. Market Analysis, Insights and Forecast - by Disease Type
- 10.1.1. Papillary Carcinoma
- 10.1.2. Follicular Carcinoma
- 10.1.3. Other Disease Types
- 10.2. Market Analysis, Insights and Forecast - by Diagnostic Technique
- 10.2.1. Blood Tests
- 10.2.2. Imaging
- 10.2.3. Biopsy
- 10.2.4. Other Diagnostic Techniques
- 10.3. Market Analysis, Insights and Forecast - by End User
- 10.3.1. Hospital Laboratories
- 10.3.2. Cancer Diagnostic Centers
- 10.3.3. Other End Users
- 10.1. Market Analysis, Insights and Forecast - by Disease Type
- 11. North America Thyroid Cancer Diagnostics Market Analysis, Insights and Forecast, 2019-2031
- 11.1. Market Analysis, Insights and Forecast - By Country/Sub-region
- 11.1.1 United States
- 11.1.2 Canada
- 11.1.3 Mexico
- 12. Europe Thyroid Cancer Diagnostics Market Analysis, Insights and Forecast, 2019-2031
- 12.1. Market Analysis, Insights and Forecast - By Country/Sub-region
- 12.1.1 Germany
- 12.1.2 United Kingdom
- 12.1.3 France
- 12.1.4 Spain
- 12.1.5 Italy
- 12.1.6 Rest of Europe
- 13. Asia Pacific Thyroid Cancer Diagnostics Market Analysis, Insights and Forecast, 2019-2031
- 13.1. Market Analysis, Insights and Forecast - By Country/Sub-region
- 13.1.1 China
- 13.1.2 Japan
- 13.1.3 India
- 13.1.4 Austalia
- 13.1.5 South Korea
- 13.1.6 Rest of Asia Pacific
- 14. Middle East and Africa Thyroid Cancer Diagnostics Market Analysis, Insights and Forecast, 2019-2031
- 14.1. Market Analysis, Insights and Forecast - By Country/Sub-region
- 14.1.1 GCC
- 14.1.2 South Africa
- 14.1.3 Rest of Middle East and Africa
- 15. South America Thyroid Cancer Diagnostics Market Analysis, Insights and Forecast, 2019-2031
- 15.1. Market Analysis, Insights and Forecast - By Country/Sub-region
- 15.1.1 Brazil
- 15.1.2 Argentina
- 15.1.3 Rest of South America
- 16. Competitive Analysis
- 16.1. Global Market Share Analysis 2024
- 16.2. Company Profiles
- 16.2.1 Bio-Rad Laboratories Inc
- 16.2.1.1. Overview
- 16.2.1.2. Products
- 16.2.1.3. SWOT Analysis
- 16.2.1.4. Recent Developments
- 16.2.1.5. Financials (Based on Availability)
- 16.2.2 Siemens Healthineers
- 16.2.2.1. Overview
- 16.2.2.2. Products
- 16.2.2.3. SWOT Analysis
- 16.2.2.4. Recent Developments
- 16.2.2.5. Financials (Based on Availability)
- 16.2.3 Thermo Fisher Scientific Inc
- 16.2.3.1. Overview
- 16.2.3.2. Products
- 16.2.3.3. SWOT Analysis
- 16.2.3.4. Recent Developments
- 16.2.3.5. Financials (Based on Availability)
- 16.2.4 Eli Lilly and Company
- 16.2.4.1. Overview
- 16.2.4.2. Products
- 16.2.4.3. SWOT Analysis
- 16.2.4.4. Recent Developments
- 16.2.4.5. Financials (Based on Availability)
- 16.2.5 Abbott Laboratories
- 16.2.5.1. Overview
- 16.2.5.2. Products
- 16.2.5.3. SWOT Analysis
- 16.2.5.4. Recent Developments
- 16.2.5.5. Financials (Based on Availability)
- 16.2.6 Agilent Technologies Inc
- 16.2.6.1. Overview
- 16.2.6.2. Products
- 16.2.6.3. SWOT Analysis
- 16.2.6.4. Recent Developments
- 16.2.6.5. Financials (Based on Availability)
- 16.2.7 Daiichi Sanyoo
- 16.2.7.1. Overview
- 16.2.7.2. Products
- 16.2.7.3. SWOT Analysis
- 16.2.7.4. Recent Developments
- 16.2.7.5. Financials (Based on Availability)
- 16.2.8 Koninklijke Philips NV
- 16.2.8.1. Overview
- 16.2.8.2. Products
- 16.2.8.3. SWOT Analysis
- 16.2.8.4. Recent Developments
- 16.2.8.5. Financials (Based on Availability)
- 16.2.9 Illumina Inc
- 16.2.9.1. Overview
- 16.2.9.2. Products
- 16.2.9.3. SWOT Analysis
- 16.2.9.4. Recent Developments
- 16.2.9.5. Financials (Based on Availability)
- 16.2.10 General Electric Company
- 16.2.10.1. Overview
- 16.2.10.2. Products
- 16.2.10.3. SWOT Analysis
- 16.2.10.4. Recent Developments
- 16.2.10.5. Financials (Based on Availability)
- 16.2.11 Hoffmann-La Roche Ltd
- 16.2.11.1. Overview
- 16.2.11.2. Products
- 16.2.11.3. SWOT Analysis
- 16.2.11.4. Recent Developments
- 16.2.11.5. Financials (Based on Availability)
- 16.2.1 Bio-Rad Laboratories Inc
List of Figures
- Figure 1: Global Thyroid Cancer Diagnostics Market Revenue Breakdown (Million, %) by Region 2024 & 2032
- Figure 2: Global Thyroid Cancer Diagnostics Market Volume Breakdown (K Unit, %) by Region 2024 & 2032
- Figure 3: North America Thyroid Cancer Diagnostics Market Revenue (Million), by Country 2024 & 2032
- Figure 4: North America Thyroid Cancer Diagnostics Market Volume (K Unit), by Country 2024 & 2032
- Figure 5: North America Thyroid Cancer Diagnostics Market Revenue Share (%), by Country 2024 & 2032
- Figure 6: North America Thyroid Cancer Diagnostics Market Volume Share (%), by Country 2024 & 2032
- Figure 7: Europe Thyroid Cancer Diagnostics Market Revenue (Million), by Country 2024 & 2032
- Figure 8: Europe Thyroid Cancer Diagnostics Market Volume (K Unit), by Country 2024 & 2032
- Figure 9: Europe Thyroid Cancer Diagnostics Market Revenue Share (%), by Country 2024 & 2032
- Figure 10: Europe Thyroid Cancer Diagnostics Market Volume Share (%), by Country 2024 & 2032
- Figure 11: Asia Pacific Thyroid Cancer Diagnostics Market Revenue (Million), by Country 2024 & 2032
- Figure 12: Asia Pacific Thyroid Cancer Diagnostics Market Volume (K Unit), by Country 2024 & 2032
- Figure 13: Asia Pacific Thyroid Cancer Diagnostics Market Revenue Share (%), by Country 2024 & 2032
- Figure 14: Asia Pacific Thyroid Cancer Diagnostics Market Volume Share (%), by Country 2024 & 2032
- Figure 15: Middle East and Africa Thyroid Cancer Diagnostics Market Revenue (Million), by Country 2024 & 2032
- Figure 16: Middle East and Africa Thyroid Cancer Diagnostics Market Volume (K Unit), by Country 2024 & 2032
- Figure 17: Middle East and Africa Thyroid Cancer Diagnostics Market Revenue Share (%), by Country 2024 & 2032
- Figure 18: Middle East and Africa Thyroid Cancer Diagnostics Market Volume Share (%), by Country 2024 & 2032
- Figure 19: South America Thyroid Cancer Diagnostics Market Revenue (Million), by Country 2024 & 2032
- Figure 20: South America Thyroid Cancer Diagnostics Market Volume (K Unit), by Country 2024 & 2032
- Figure 21: South America Thyroid Cancer Diagnostics Market Revenue Share (%), by Country 2024 & 2032
- Figure 22: South America Thyroid Cancer Diagnostics Market Volume Share (%), by Country 2024 & 2032
- Figure 23: North America Thyroid Cancer Diagnostics Market Revenue (Million), by Disease Type 2024 & 2032
- Figure 24: North America Thyroid Cancer Diagnostics Market Volume (K Unit), by Disease Type 2024 & 2032
- Figure 25: North America Thyroid Cancer Diagnostics Market Revenue Share (%), by Disease Type 2024 & 2032
- Figure 26: North America Thyroid Cancer Diagnostics Market Volume Share (%), by Disease Type 2024 & 2032
- Figure 27: North America Thyroid Cancer Diagnostics Market Revenue (Million), by Diagnostic Technique 2024 & 2032
- Figure 28: North America Thyroid Cancer Diagnostics Market Volume (K Unit), by Diagnostic Technique 2024 & 2032
- Figure 29: North America Thyroid Cancer Diagnostics Market Revenue Share (%), by Diagnostic Technique 2024 & 2032
- Figure 30: North America Thyroid Cancer Diagnostics Market Volume Share (%), by Diagnostic Technique 2024 & 2032
- Figure 31: North America Thyroid Cancer Diagnostics Market Revenue (Million), by End User 2024 & 2032
- Figure 32: North America Thyroid Cancer Diagnostics Market Volume (K Unit), by End User 2024 & 2032
- Figure 33: North America Thyroid Cancer Diagnostics Market Revenue Share (%), by End User 2024 & 2032
- Figure 34: North America Thyroid Cancer Diagnostics Market Volume Share (%), by End User 2024 & 2032
- Figure 35: North America Thyroid Cancer Diagnostics Market Revenue (Million), by Country 2024 & 2032
- Figure 36: North America Thyroid Cancer Diagnostics Market Volume (K Unit), by Country 2024 & 2032
- Figure 37: North America Thyroid Cancer Diagnostics Market Revenue Share (%), by Country 2024 & 2032
- Figure 38: North America Thyroid Cancer Diagnostics Market Volume Share (%), by Country 2024 & 2032
- Figure 39: Europe Thyroid Cancer Diagnostics Market Revenue (Million), by Disease Type 2024 & 2032
- Figure 40: Europe Thyroid Cancer Diagnostics Market Volume (K Unit), by Disease Type 2024 & 2032
- Figure 41: Europe Thyroid Cancer Diagnostics Market Revenue Share (%), by Disease Type 2024 & 2032
- Figure 42: Europe Thyroid Cancer Diagnostics Market Volume Share (%), by Disease Type 2024 & 2032
- Figure 43: Europe Thyroid Cancer Diagnostics Market Revenue (Million), by Diagnostic Technique 2024 & 2032
- Figure 44: Europe Thyroid Cancer Diagnostics Market Volume (K Unit), by Diagnostic Technique 2024 & 2032
- Figure 45: Europe Thyroid Cancer Diagnostics Market Revenue Share (%), by Diagnostic Technique 2024 & 2032
- Figure 46: Europe Thyroid Cancer Diagnostics Market Volume Share (%), by Diagnostic Technique 2024 & 2032
- Figure 47: Europe Thyroid Cancer Diagnostics Market Revenue (Million), by End User 2024 & 2032
- Figure 48: Europe Thyroid Cancer Diagnostics Market Volume (K Unit), by End User 2024 & 2032
- Figure 49: Europe Thyroid Cancer Diagnostics Market Revenue Share (%), by End User 2024 & 2032
- Figure 50: Europe Thyroid Cancer Diagnostics Market Volume Share (%), by End User 2024 & 2032
- Figure 51: Europe Thyroid Cancer Diagnostics Market Revenue (Million), by Country 2024 & 2032
- Figure 52: Europe Thyroid Cancer Diagnostics Market Volume (K Unit), by Country 2024 & 2032
- Figure 53: Europe Thyroid Cancer Diagnostics Market Revenue Share (%), by Country 2024 & 2032
- Figure 54: Europe Thyroid Cancer Diagnostics Market Volume Share (%), by Country 2024 & 2032
- Figure 55: Asia Pacific Thyroid Cancer Diagnostics Market Revenue (Million), by Disease Type 2024 & 2032
- Figure 56: Asia Pacific Thyroid Cancer Diagnostics Market Volume (K Unit), by Disease Type 2024 & 2032
- Figure 57: Asia Pacific Thyroid Cancer Diagnostics Market Revenue Share (%), by Disease Type 2024 & 2032
- Figure 58: Asia Pacific Thyroid Cancer Diagnostics Market Volume Share (%), by Disease Type 2024 & 2032
- Figure 59: Asia Pacific Thyroid Cancer Diagnostics Market Revenue (Million), by Diagnostic Technique 2024 & 2032
- Figure 60: Asia Pacific Thyroid Cancer Diagnostics Market Volume (K Unit), by Diagnostic Technique 2024 & 2032
- Figure 61: Asia Pacific Thyroid Cancer Diagnostics Market Revenue Share (%), by Diagnostic Technique 2024 & 2032
- Figure 62: Asia Pacific Thyroid Cancer Diagnostics Market Volume Share (%), by Diagnostic Technique 2024 & 2032
- Figure 63: Asia Pacific Thyroid Cancer Diagnostics Market Revenue (Million), by End User 2024 & 2032
- Figure 64: Asia Pacific Thyroid Cancer Diagnostics Market Volume (K Unit), by End User 2024 & 2032
- Figure 65: Asia Pacific Thyroid Cancer Diagnostics Market Revenue Share (%), by End User 2024 & 2032
- Figure 66: Asia Pacific Thyroid Cancer Diagnostics Market Volume Share (%), by End User 2024 & 2032
- Figure 67: Asia Pacific Thyroid Cancer Diagnostics Market Revenue (Million), by Country 2024 & 2032
- Figure 68: Asia Pacific Thyroid Cancer Diagnostics Market Volume (K Unit), by Country 2024 & 2032
- Figure 69: Asia Pacific Thyroid Cancer Diagnostics Market Revenue Share (%), by Country 2024 & 2032
- Figure 70: Asia Pacific Thyroid Cancer Diagnostics Market Volume Share (%), by Country 2024 & 2032
- Figure 71: Middle East and Africa Thyroid Cancer Diagnostics Market Revenue (Million), by Disease Type 2024 & 2032
- Figure 72: Middle East and Africa Thyroid Cancer Diagnostics Market Volume (K Unit), by Disease Type 2024 & 2032
- Figure 73: Middle East and Africa Thyroid Cancer Diagnostics Market Revenue Share (%), by Disease Type 2024 & 2032
- Figure 74: Middle East and Africa Thyroid Cancer Diagnostics Market Volume Share (%), by Disease Type 2024 & 2032
- Figure 75: Middle East and Africa Thyroid Cancer Diagnostics Market Revenue (Million), by Diagnostic Technique 2024 & 2032
- Figure 76: Middle East and Africa Thyroid Cancer Diagnostics Market Volume (K Unit), by Diagnostic Technique 2024 & 2032
- Figure 77: Middle East and Africa Thyroid Cancer Diagnostics Market Revenue Share (%), by Diagnostic Technique 2024 & 2032
- Figure 78: Middle East and Africa Thyroid Cancer Diagnostics Market Volume Share (%), by Diagnostic Technique 2024 & 2032
- Figure 79: Middle East and Africa Thyroid Cancer Diagnostics Market Revenue (Million), by End User 2024 & 2032
- Figure 80: Middle East and Africa Thyroid Cancer Diagnostics Market Volume (K Unit), by End User 2024 & 2032
- Figure 81: Middle East and Africa Thyroid Cancer Diagnostics Market Revenue Share (%), by End User 2024 & 2032
- Figure 82: Middle East and Africa Thyroid Cancer Diagnostics Market Volume Share (%), by End User 2024 & 2032
- Figure 83: Middle East and Africa Thyroid Cancer Diagnostics Market Revenue (Million), by Country 2024 & 2032
- Figure 84: Middle East and Africa Thyroid Cancer Diagnostics Market Volume (K Unit), by Country 2024 & 2032
- Figure 85: Middle East and Africa Thyroid Cancer Diagnostics Market Revenue Share (%), by Country 2024 & 2032
- Figure 86: Middle East and Africa Thyroid Cancer Diagnostics Market Volume Share (%), by Country 2024 & 2032
- Figure 87: South America Thyroid Cancer Diagnostics Market Revenue (Million), by Disease Type 2024 & 2032
- Figure 88: South America Thyroid Cancer Diagnostics Market Volume (K Unit), by Disease Type 2024 & 2032
- Figure 89: South America Thyroid Cancer Diagnostics Market Revenue Share (%), by Disease Type 2024 & 2032
- Figure 90: South America Thyroid Cancer Diagnostics Market Volume Share (%), by Disease Type 2024 & 2032
- Figure 91: South America Thyroid Cancer Diagnostics Market Revenue (Million), by Diagnostic Technique 2024 & 2032
- Figure 92: South America Thyroid Cancer Diagnostics Market Volume (K Unit), by Diagnostic Technique 2024 & 2032
- Figure 93: South America Thyroid Cancer Diagnostics Market Revenue Share (%), by Diagnostic Technique 2024 & 2032
- Figure 94: South America Thyroid Cancer Diagnostics Market Volume Share (%), by Diagnostic Technique 2024 & 2032
- Figure 95: South America Thyroid Cancer Diagnostics Market Revenue (Million), by End User 2024 & 2032
- Figure 96: South America Thyroid Cancer Diagnostics Market Volume (K Unit), by End User 2024 & 2032
- Figure 97: South America Thyroid Cancer Diagnostics Market Revenue Share (%), by End User 2024 & 2032
- Figure 98: South America Thyroid Cancer Diagnostics Market Volume Share (%), by End User 2024 & 2032
- Figure 99: South America Thyroid Cancer Diagnostics Market Revenue (Million), by Country 2024 & 2032
- Figure 100: South America Thyroid Cancer Diagnostics Market Volume (K Unit), by Country 2024 & 2032
- Figure 101: South America Thyroid Cancer Diagnostics Market Revenue Share (%), by Country 2024 & 2032
- Figure 102: South America Thyroid Cancer Diagnostics Market Volume Share (%), by Country 2024 & 2032
List of Tables
- Table 1: Global Thyroid Cancer Diagnostics Market Revenue Million Forecast, by Region 2019 & 2032
- Table 2: Global Thyroid Cancer Diagnostics Market Volume K Unit Forecast, by Region 2019 & 2032
- Table 3: Global Thyroid Cancer Diagnostics Market Revenue Million Forecast, by Disease Type 2019 & 2032
- Table 4: Global Thyroid Cancer Diagnostics Market Volume K Unit Forecast, by Disease Type 2019 & 2032
- Table 5: Global Thyroid Cancer Diagnostics Market Revenue Million Forecast, by Diagnostic Technique 2019 & 2032
- Table 6: Global Thyroid Cancer Diagnostics Market Volume K Unit Forecast, by Diagnostic Technique 2019 & 2032
- Table 7: Global Thyroid Cancer Diagnostics Market Revenue Million Forecast, by End User 2019 & 2032
- Table 8: Global Thyroid Cancer Diagnostics Market Volume K Unit Forecast, by End User 2019 & 2032
- Table 9: Global Thyroid Cancer Diagnostics Market Revenue Million Forecast, by Region 2019 & 2032
- Table 10: Global Thyroid Cancer Diagnostics Market Volume K Unit Forecast, by Region 2019 & 2032
- Table 11: Global Thyroid Cancer Diagnostics Market Revenue Million Forecast, by Country 2019 & 2032
- Table 12: Global Thyroid Cancer Diagnostics Market Volume K Unit Forecast, by Country 2019 & 2032
- Table 13: United States Thyroid Cancer Diagnostics Market Revenue (Million) Forecast, by Application 2019 & 2032
- Table 14: United States Thyroid Cancer Diagnostics Market Volume (K Unit) Forecast, by Application 2019 & 2032
- Table 15: Canada Thyroid Cancer Diagnostics Market Revenue (Million) Forecast, by Application 2019 & 2032
- Table 16: Canada Thyroid Cancer Diagnostics Market Volume (K Unit) Forecast, by Application 2019 & 2032
- Table 17: Mexico Thyroid Cancer Diagnostics Market Revenue (Million) Forecast, by Application 2019 & 2032
- Table 18: Mexico Thyroid Cancer Diagnostics Market Volume (K Unit) Forecast, by Application 2019 & 2032
- Table 19: Global Thyroid Cancer Diagnostics Market Revenue Million Forecast, by Country 2019 & 2032
- Table 20: Global Thyroid Cancer Diagnostics Market Volume K Unit Forecast, by Country 2019 & 2032
- Table 21: Germany Thyroid Cancer Diagnostics Market Revenue (Million) Forecast, by Application 2019 & 2032
- Table 22: Germany Thyroid Cancer Diagnostics Market Volume (K Unit) Forecast, by Application 2019 & 2032
- Table 23: United Kingdom Thyroid Cancer Diagnostics Market Revenue (Million) Forecast, by Application 2019 & 2032
- Table 24: United Kingdom Thyroid Cancer Diagnostics Market Volume (K Unit) Forecast, by Application 2019 & 2032
- Table 25: France Thyroid Cancer Diagnostics Market Revenue (Million) Forecast, by Application 2019 & 2032
- Table 26: France Thyroid Cancer Diagnostics Market Volume (K Unit) Forecast, by Application 2019 & 2032
- Table 27: Spain Thyroid Cancer Diagnostics Market Revenue (Million) Forecast, by Application 2019 & 2032
- Table 28: Spain Thyroid Cancer Diagnostics Market Volume (K Unit) Forecast, by Application 2019 & 2032
- Table 29: Italy Thyroid Cancer Diagnostics Market Revenue (Million) Forecast, by Application 2019 & 2032
- Table 30: Italy Thyroid Cancer Diagnostics Market Volume (K Unit) Forecast, by Application 2019 & 2032
- Table 31: Rest of Europe Thyroid Cancer Diagnostics Market Revenue (Million) Forecast, by Application 2019 & 2032
- Table 32: Rest of Europe Thyroid Cancer Diagnostics Market Volume (K Unit) Forecast, by Application 2019 & 2032
- Table 33: Global Thyroid Cancer Diagnostics Market Revenue Million Forecast, by Country 2019 & 2032
- Table 34: Global Thyroid Cancer Diagnostics Market Volume K Unit Forecast, by Country 2019 & 2032
- Table 35: China Thyroid Cancer Diagnostics Market Revenue (Million) Forecast, by Application 2019 & 2032
- Table 36: China Thyroid Cancer Diagnostics Market Volume (K Unit) Forecast, by Application 2019 & 2032
- Table 37: Japan Thyroid Cancer Diagnostics Market Revenue (Million) Forecast, by Application 2019 & 2032
- Table 38: Japan Thyroid Cancer Diagnostics Market Volume (K Unit) Forecast, by Application 2019 & 2032
- Table 39: India Thyroid Cancer Diagnostics Market Revenue (Million) Forecast, by Application 2019 & 2032
- Table 40: India Thyroid Cancer Diagnostics Market Volume (K Unit) Forecast, by Application 2019 & 2032
- Table 41: Austalia Thyroid Cancer Diagnostics Market Revenue (Million) Forecast, by Application 2019 & 2032
- Table 42: Austalia Thyroid Cancer Diagnostics Market Volume (K Unit) Forecast, by Application 2019 & 2032
- Table 43: South Korea Thyroid Cancer Diagnostics Market Revenue (Million) Forecast, by Application 2019 & 2032
- Table 44: South Korea Thyroid Cancer Diagnostics Market Volume (K Unit) Forecast, by Application 2019 & 2032
- Table 45: Rest of Asia Pacific Thyroid Cancer Diagnostics Market Revenue (Million) Forecast, by Application 2019 & 2032
- Table 46: Rest of Asia Pacific Thyroid Cancer Diagnostics Market Volume (K Unit) Forecast, by Application 2019 & 2032
- Table 47: Global Thyroid Cancer Diagnostics Market Revenue Million Forecast, by Country 2019 & 2032
- Table 48: Global Thyroid Cancer Diagnostics Market Volume K Unit Forecast, by Country 2019 & 2032
- Table 49: GCC Thyroid Cancer Diagnostics Market Revenue (Million) Forecast, by Application 2019 & 2032
- Table 50: GCC Thyroid Cancer Diagnostics Market Volume (K Unit) Forecast, by Application 2019 & 2032
- Table 51: South Africa Thyroid Cancer Diagnostics Market Revenue (Million) Forecast, by Application 2019 & 2032
- Table 52: South Africa Thyroid Cancer Diagnostics Market Volume (K Unit) Forecast, by Application 2019 & 2032
- Table 53: Rest of Middle East and Africa Thyroid Cancer Diagnostics Market Revenue (Million) Forecast, by Application 2019 & 2032
- Table 54: Rest of Middle East and Africa Thyroid Cancer Diagnostics Market Volume (K Unit) Forecast, by Application 2019 & 2032
- Table 55: Global Thyroid Cancer Diagnostics Market Revenue Million Forecast, by Country 2019 & 2032
- Table 56: Global Thyroid Cancer Diagnostics Market Volume K Unit Forecast, by Country 2019 & 2032
- Table 57: Brazil Thyroid Cancer Diagnostics Market Revenue (Million) Forecast, by Application 2019 & 2032
- Table 58: Brazil Thyroid Cancer Diagnostics Market Volume (K Unit) Forecast, by Application 2019 & 2032
- Table 59: Argentina Thyroid Cancer Diagnostics Market Revenue (Million) Forecast, by Application 2019 & 2032
- Table 60: Argentina Thyroid Cancer Diagnostics Market Volume (K Unit) Forecast, by Application 2019 & 2032
- Table 61: Rest of South America Thyroid Cancer Diagnostics Market Revenue (Million) Forecast, by Application 2019 & 2032
- Table 62: Rest of South America Thyroid Cancer Diagnostics Market Volume (K Unit) Forecast, by Application 2019 & 2032
- Table 63: Global Thyroid Cancer Diagnostics Market Revenue Million Forecast, by Disease Type 2019 & 2032
- Table 64: Global Thyroid Cancer Diagnostics Market Volume K Unit Forecast, by Disease Type 2019 & 2032
- Table 65: Global Thyroid Cancer Diagnostics Market Revenue Million Forecast, by Diagnostic Technique 2019 & 2032
- Table 66: Global Thyroid Cancer Diagnostics Market Volume K Unit Forecast, by Diagnostic Technique 2019 & 2032
- Table 67: Global Thyroid Cancer Diagnostics Market Revenue Million Forecast, by End User 2019 & 2032
- Table 68: Global Thyroid Cancer Diagnostics Market Volume K Unit Forecast, by End User 2019 & 2032
- Table 69: Global Thyroid Cancer Diagnostics Market Revenue Million Forecast, by Country 2019 & 2032
- Table 70: Global Thyroid Cancer Diagnostics Market Volume K Unit Forecast, by Country 2019 & 2032
- Table 71: United States Thyroid Cancer Diagnostics Market Revenue (Million) Forecast, by Application 2019 & 2032
- Table 72: United States Thyroid Cancer Diagnostics Market Volume (K Unit) Forecast, by Application 2019 & 2032
- Table 73: Canada Thyroid Cancer Diagnostics Market Revenue (Million) Forecast, by Application 2019 & 2032
- Table 74: Canada Thyroid Cancer Diagnostics Market Volume (K Unit) Forecast, by Application 2019 & 2032
- Table 75: Mexico Thyroid Cancer Diagnostics Market Revenue (Million) Forecast, by Application 2019 & 2032
- Table 76: Mexico Thyroid Cancer Diagnostics Market Volume (K Unit) Forecast, by Application 2019 & 2032
- Table 77: Global Thyroid Cancer Diagnostics Market Revenue Million Forecast, by Disease Type 2019 & 2032
- Table 78: Global Thyroid Cancer Diagnostics Market Volume K Unit Forecast, by Disease Type 2019 & 2032
- Table 79: Global Thyroid Cancer Diagnostics Market Revenue Million Forecast, by Diagnostic Technique 2019 & 2032
- Table 80: Global Thyroid Cancer Diagnostics Market Volume K Unit Forecast, by Diagnostic Technique 2019 & 2032
- Table 81: Global Thyroid Cancer Diagnostics Market Revenue Million Forecast, by End User 2019 & 2032
- Table 82: Global Thyroid Cancer Diagnostics Market Volume K Unit Forecast, by End User 2019 & 2032
- Table 83: Global Thyroid Cancer Diagnostics Market Revenue Million Forecast, by Country 2019 & 2032
- Table 84: Global Thyroid Cancer Diagnostics Market Volume K Unit Forecast, by Country 2019 & 2032
- Table 85: Germany Thyroid Cancer Diagnostics Market Revenue (Million) Forecast, by Application 2019 & 2032
- Table 86: Germany Thyroid Cancer Diagnostics Market Volume (K Unit) Forecast, by Application 2019 & 2032
- Table 87: United Kingdom Thyroid Cancer Diagnostics Market Revenue (Million) Forecast, by Application 2019 & 2032
- Table 88: United Kingdom Thyroid Cancer Diagnostics Market Volume (K Unit) Forecast, by Application 2019 & 2032
- Table 89: France Thyroid Cancer Diagnostics Market Revenue (Million) Forecast, by Application 2019 & 2032
- Table 90: France Thyroid Cancer Diagnostics Market Volume (K Unit) Forecast, by Application 2019 & 2032
- Table 91: Spain Thyroid Cancer Diagnostics Market Revenue (Million) Forecast, by Application 2019 & 2032
- Table 92: Spain Thyroid Cancer Diagnostics Market Volume (K Unit) Forecast, by Application 2019 & 2032
- Table 93: Italy Thyroid Cancer Diagnostics Market Revenue (Million) Forecast, by Application 2019 & 2032
- Table 94: Italy Thyroid Cancer Diagnostics Market Volume (K Unit) Forecast, by Application 2019 & 2032
- Table 95: Rest of Europe Thyroid Cancer Diagnostics Market Revenue (Million) Forecast, by Application 2019 & 2032
- Table 96: Rest of Europe Thyroid Cancer Diagnostics Market Volume (K Unit) Forecast, by Application 2019 & 2032
- Table 97: Global Thyroid Cancer Diagnostics Market Revenue Million Forecast, by Disease Type 2019 & 2032
- Table 98: Global Thyroid Cancer Diagnostics Market Volume K Unit Forecast, by Disease Type 2019 & 2032
- Table 99: Global Thyroid Cancer Diagnostics Market Revenue Million Forecast, by Diagnostic Technique 2019 & 2032
- Table 100: Global Thyroid Cancer Diagnostics Market Volume K Unit Forecast, by Diagnostic Technique 2019 & 2032
- Table 101: Global Thyroid Cancer Diagnostics Market Revenue Million Forecast, by End User 2019 & 2032
- Table 102: Global Thyroid Cancer Diagnostics Market Volume K Unit Forecast, by End User 2019 & 2032
- Table 103: Global Thyroid Cancer Diagnostics Market Revenue Million Forecast, by Country 2019 & 2032
- Table 104: Global Thyroid Cancer Diagnostics Market Volume K Unit Forecast, by Country 2019 & 2032
- Table 105: China Thyroid Cancer Diagnostics Market Revenue (Million) Forecast, by Application 2019 & 2032
- Table 106: China Thyroid Cancer Diagnostics Market Volume (K Unit) Forecast, by Application 2019 & 2032
- Table 107: Japan Thyroid Cancer Diagnostics Market Revenue (Million) Forecast, by Application 2019 & 2032
- Table 108: Japan Thyroid Cancer Diagnostics Market Volume (K Unit) Forecast, by Application 2019 & 2032
- Table 109: India Thyroid Cancer Diagnostics Market Revenue (Million) Forecast, by Application 2019 & 2032
- Table 110: India Thyroid Cancer Diagnostics Market Volume (K Unit) Forecast, by Application 2019 & 2032
- Table 111: Austalia Thyroid Cancer Diagnostics Market Revenue (Million) Forecast, by Application 2019 & 2032
- Table 112: Austalia Thyroid Cancer Diagnostics Market Volume (K Unit) Forecast, by Application 2019 & 2032
- Table 113: South Korea Thyroid Cancer Diagnostics Market Revenue (Million) Forecast, by Application 2019 & 2032
- Table 114: South Korea Thyroid Cancer Diagnostics Market Volume (K Unit) Forecast, by Application 2019 & 2032
- Table 115: Rest of Asia Pacific Thyroid Cancer Diagnostics Market Revenue (Million) Forecast, by Application 2019 & 2032
- Table 116: Rest of Asia Pacific Thyroid Cancer Diagnostics Market Volume (K Unit) Forecast, by Application 2019 & 2032
- Table 117: Global Thyroid Cancer Diagnostics Market Revenue Million Forecast, by Disease Type 2019 & 2032
- Table 118: Global Thyroid Cancer Diagnostics Market Volume K Unit Forecast, by Disease Type 2019 & 2032
- Table 119: Global Thyroid Cancer Diagnostics Market Revenue Million Forecast, by Diagnostic Technique 2019 & 2032
- Table 120: Global Thyroid Cancer Diagnostics Market Volume K Unit Forecast, by Diagnostic Technique 2019 & 2032
- Table 121: Global Thyroid Cancer Diagnostics Market Revenue Million Forecast, by End User 2019 & 2032
- Table 122: Global Thyroid Cancer Diagnostics Market Volume K Unit Forecast, by End User 2019 & 2032
- Table 123: Global Thyroid Cancer Diagnostics Market Revenue Million Forecast, by Country 2019 & 2032
- Table 124: Global Thyroid Cancer Diagnostics Market Volume K Unit Forecast, by Country 2019 & 2032
- Table 125: GCC Thyroid Cancer Diagnostics Market Revenue (Million) Forecast, by Application 2019 & 2032
- Table 126: GCC Thyroid Cancer Diagnostics Market Volume (K Unit) Forecast, by Application 2019 & 2032
- Table 127: South Africa Thyroid Cancer Diagnostics Market Revenue (Million) Forecast, by Application 2019 & 2032
- Table 128: South Africa Thyroid Cancer Diagnostics Market Volume (K Unit) Forecast, by Application 2019 & 2032
- Table 129: Rest of Middle East and Africa Thyroid Cancer Diagnostics Market Revenue (Million) Forecast, by Application 2019 & 2032
- Table 130: Rest of Middle East and Africa Thyroid Cancer Diagnostics Market Volume (K Unit) Forecast, by Application 2019 & 2032
- Table 131: Global Thyroid Cancer Diagnostics Market Revenue Million Forecast, by Disease Type 2019 & 2032
- Table 132: Global Thyroid Cancer Diagnostics Market Volume K Unit Forecast, by Disease Type 2019 & 2032
- Table 133: Global Thyroid Cancer Diagnostics Market Revenue Million Forecast, by Diagnostic Technique 2019 & 2032
- Table 134: Global Thyroid Cancer Diagnostics Market Volume K Unit Forecast, by Diagnostic Technique 2019 & 2032
- Table 135: Global Thyroid Cancer Diagnostics Market Revenue Million Forecast, by End User 2019 & 2032
- Table 136: Global Thyroid Cancer Diagnostics Market Volume K Unit Forecast, by End User 2019 & 2032
- Table 137: Global Thyroid Cancer Diagnostics Market Revenue Million Forecast, by Country 2019 & 2032
- Table 138: Global Thyroid Cancer Diagnostics Market Volume K Unit Forecast, by Country 2019 & 2032
- Table 139: Brazil Thyroid Cancer Diagnostics Market Revenue (Million) Forecast, by Application 2019 & 2032
- Table 140: Brazil Thyroid Cancer Diagnostics Market Volume (K Unit) Forecast, by Application 2019 & 2032
- Table 141: Argentina Thyroid Cancer Diagnostics Market Revenue (Million) Forecast, by Application 2019 & 2032
- Table 142: Argentina Thyroid Cancer Diagnostics Market Volume (K Unit) Forecast, by Application 2019 & 2032
- Table 143: Rest of South America Thyroid Cancer Diagnostics Market Revenue (Million) Forecast, by Application 2019 & 2032
- Table 144: Rest of South America Thyroid Cancer Diagnostics Market Volume (K Unit) Forecast, by Application 2019 & 2032
Frequently Asked Questions
1. What is the projected Compound Annual Growth Rate (CAGR) of the Thyroid Cancer Diagnostics Market?
The projected CAGR is approximately 5.50%.
2. Which companies are prominent players in the Thyroid Cancer Diagnostics Market?
Key companies in the market include Bio-Rad Laboratories Inc, Siemens Healthineers, Thermo Fisher Scientific Inc, Eli Lilly and Company, Abbott Laboratories, Agilent Technologies Inc, Daiichi Sanyoo, Koninklijke Philips NV, Illumina Inc, General Electric Company, Hoffmann-La Roche Ltd.
3. What are the main segments of the Thyroid Cancer Diagnostics Market?
The market segments include Disease Type, Diagnostic Technique, End User.
4. Can you provide details about the market size?
The market size is estimated to be USD XX Million as of 2022.
5. What are some drivers contributing to market growth?
Increase in Government Spending on Creating Awareness; Rise in Detection of Thyroid Cancer Cases.
6. What are the notable trends driving market growth?
The Papillary Carcinoma Segment is Expected to Hold a Major Share in the Market During the Forecast Period.
7. Are there any restraints impacting market growth?
Lack of Knowledge and Awareness.
8. Can you provide examples of recent developments in the market?
N/A
9. What pricing options are available for accessing the report?
Pricing options include single-user, multi-user, and enterprise licenses priced at USD 4750, USD 5250, and USD 8750 respectively.
10. Is the market size provided in terms of value or volume?
The market size is provided in terms of value, measured in Million and volume, measured in K Unit.
11. Are there any specific market keywords associated with the report?
Yes, the market keyword associated with the report is "Thyroid Cancer Diagnostics Market," which aids in identifying and referencing the specific market segment covered.
12. How do I determine which pricing option suits my needs best?
The pricing options vary based on user requirements and access needs. Individual users may opt for single-user licenses, while businesses requiring broader access may choose multi-user or enterprise licenses for cost-effective access to the report.
13. Are there any additional resources or data provided in the Thyroid Cancer Diagnostics Market report?
While the report offers comprehensive insights, it's advisable to review the specific contents or supplementary materials provided to ascertain if additional resources or data are available.
14. How can I stay updated on further developments or reports in the Thyroid Cancer Diagnostics Market?
To stay informed about further developments, trends, and reports in the Thyroid Cancer Diagnostics Market, consider subscribing to industry newsletters, following relevant companies and organizations, or regularly checking reputable industry news sources and publications.
Methodology
Step 1 - Identification of Relevant Samples Size from Population Database


Step 2 - Approaches for Defining Global Market Size (Value, Volume* & Price*)

Note*: In applicable scenarios
Step 3 - Data Sources
Primary Research
- Web Analytics
- Survey Reports
- Research Institute
- Latest Research Reports
- Opinion Leaders
Secondary Research
- Annual Reports
- White Paper
- Latest Press Release
- Industry Association
- Paid Database
- Investor Presentations

Step 4 - Data Triangulation
Involves using different sources of information in order to increase the validity of a study
These sources are likely to be stakeholders in a program - participants, other researchers, program staff, other community members, and so on.
Then we put all data in single framework & apply various statistical tools to find out the dynamic on the market.
During the analysis stage, feedback from the stakeholder groups would be compared to determine areas of agreement as well as areas of divergence


