


Key Insights
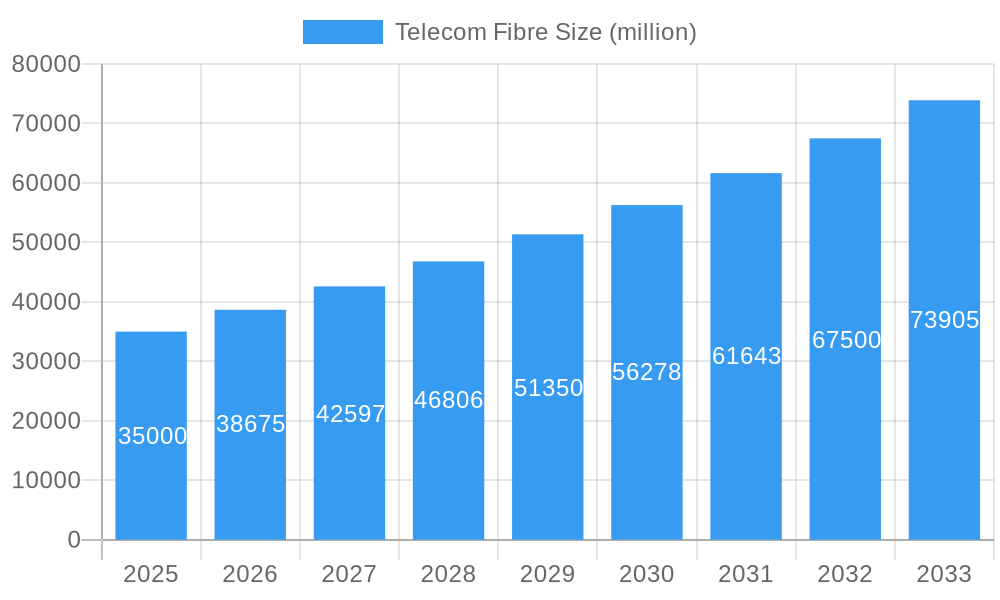
The global Telecom Fibre market is projected to experience robust growth, reaching an estimated market size of $35,000 million by 2025. This expansion is fueled by a confluence of factors, most notably the insatiable demand for higher bandwidth and faster internet speeds driven by the proliferation of data-intensive applications like 5G deployment, cloud computing, and the Internet of Things (IoT). The increasing need for reliable and efficient data transmission for everything from teleconferencing to high-definition streaming and immersive gaming is a primary driver. Furthermore, government initiatives worldwide focused on expanding broadband infrastructure, particularly in underserved rural areas, are significantly contributing to market momentum. This investment in future-proof connectivity is a critical catalyst for the widespread adoption of fiber optic technology.
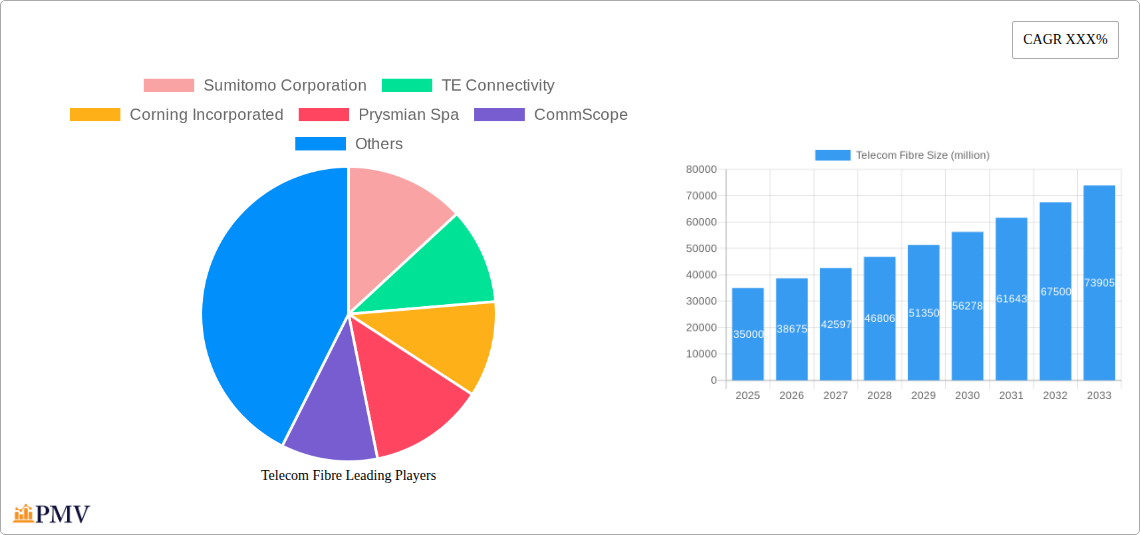
Telecom Fibre Market Size (In Billion)

The market is anticipated to witness a Compound Annual Growth Rate (CAGR) of approximately 10.5% during the forecast period of 2025-2033, underscoring its dynamic trajectory. This sustained growth is expected to be propelled by technological advancements, such as the development of higher-capacity optical fibers and more efficient deployment techniques. Key applications segmenting the market include Telephone Signals, Internet Communication, and Cable Television Signals, with Internet Communication dominating due to its multifaceted utility. Within the type segment, both Multimode and Singlemode fibers will see significant demand, each catering to specific network requirements. Despite the promising outlook, certain restraints, such as the high initial installation costs and the complex deployment process in certain geographies, might pose challenges. However, the overarching trend towards digital transformation and the continuous evolution of telecommunication networks suggest a consistently upward market trajectory.
Telecom Fibre Company Market Share
Comprehensive Telecom Fibre Market Report: 2019-2033
Unlock the future of global connectivity with this in-depth Telecom Fibre market analysis. This report provides unparalleled insights into the evolving landscape of fibre optic infrastructure, crucial for delivering high-speed internet, telephone signals, and cable television services worldwide. Examine market dynamics, technological advancements, and strategic opportunities to stay ahead in this rapidly growing sector.
Study Period: 2019–2033 | Base Year: 2025 | Estimated Year: 2025 | Forecast Period: 2025–2033 | Historical Period: 2019–2024
Telecom Fibre Market Structure & Competitive Dynamics
The global telecom fibre market is characterized by a moderate to high level of concentration, with a significant portion of the market share held by a few dominant players. Innovation ecosystems are thriving, driven by continuous research and development in areas such as higher bandwidth fibres, advanced optical components, and energy-efficient deployment technologies. Regulatory frameworks play a critical role, influencing deployment standards, spectrum allocation, and government subsidies aimed at expanding broadband access. Product substitutes, while present in the form of older copper technologies or fixed wireless access, are increasingly being outpaced by the superior performance of fibre optics for core networking and high-demand applications. End-user trends are overwhelmingly favouring faster, more reliable internet connectivity for remote work, streaming services, and emerging technologies like 5G and the Internet of Things (IoT). Mergers and Acquisitions (M&A) activities are strategically shaping the competitive landscape, with companies seeking to expand their geographical reach, integrate supply chains, and acquire cutting-edge technologies. For instance, M&A deals in the sector have been valued in the hundreds of millions, facilitating consolidation and market expansion. Key market share data indicates that top players command up to 30% of specific regional markets.
Telecom Fibre Industry Trends & Insights
The telecom fibre industry is experiencing robust growth, propelled by an insatiable demand for high-speed, reliable internet connectivity across residential, commercial, and industrial sectors. The foundational driver of this expansion is the escalating adoption of digital services, including cloud computing, high-definition video streaming, online gaming, and the burgeoning Internet of Things (IoT). The ongoing global rollout of 5G networks is a significant catalyst, requiring extensive fibre backhaul to support its increased capacity and reduced latency. Governments worldwide are actively investing in broadband infrastructure development through substantial subsidies and supportive policies, aiming to bridge the digital divide and foster economic growth. The average annual growth rate (CAGR) for the telecom fibre market is projected to be around 8-10% over the forecast period. Market penetration of fibre-to-the-home (FTTH) is rapidly increasing, especially in developed economies, with estimates suggesting it will surpass 60% of broadband connections by 2030. Technological disruptions are also shaping the industry, with advancements in optical fibre manufacturing processes leading to lower costs and enhanced performance, such as ultra-low loss fibres and bend-insensitive fibres. Furthermore, innovations in optical networking equipment, including coherent optics and advanced wavelength division multiplexing (WDM) technologies, are enabling higher data transmission rates over existing fibre infrastructure, delaying the need for complete network overhauls. The competitive dynamics are characterized by intense competition among established players and emerging manufacturers, leading to price optimizations and a focus on differentiated product offerings. Consumer preferences are increasingly dictating network upgrades, with users demanding seamless connectivity and the capacity to support multiple devices and bandwidth-intensive applications simultaneously. The residential sector, driven by remote work and entertainment, is a major contributor, while enterprise adoption for data centres, cloud connectivity, and business operations also fuels substantial demand. The industrial segment is also seeing increased adoption for automation, real-time data analytics, and smart manufacturing processes. The expansion of data centres, crucial for hosting cloud services and AI applications, directly translates to a higher demand for high-capacity fibre optic cables.
Dominant Markets & Segments in Telecom Fibre
The Internet Communication application segment is demonstrably dominant within the global telecom fibre market, driven by the ubiquitous need for high-speed, reliable internet access. This dominance is further amplified by the surge in online activities, including remote work, e-learning, entertainment streaming, and the proliferation of cloud-based services. Economic policies globally are increasingly focused on digital infrastructure development, with significant government investments aimed at expanding broadband networks, particularly fibre-to-the-home (FTTH) and fibre-to-the-premises (FTTP) initiatives. These policies often include tax incentives, grants, and public-private partnerships, directly stimulating demand for fibre optic cables. For instance, national broadband plans in countries like the United States, Germany, and South Korea are allocating billions to fibre deployment.
Within the Type segmentation, Singlemode fibre commands a significant market share and is poised for continued dominance. This is primarily due to its superior performance characteristics, including its ability to transmit data over longer distances with minimal signal loss and at higher bandwidths, making it the preferred choice for long-haul networks, backbone infrastructure, and high-speed internet services. The ongoing 5G network deployments heavily rely on singlemode fibre for its backhaul requirements, further solidifying its leading position. The market penetration of singlemode fibre is estimated to be over 85% for core network infrastructure.
The leading region for telecom fibre adoption is North America, closely followed by Europe and Asia-Pacific.
Key Drivers in North America:
- Government Initiatives: Significant federal and state funding for rural broadband expansion and urban network upgrades, such as the Broadband Equity, Access, and Deployment (BEAD) program.
- High Consumer Demand: Strong demand for high-speed internet driven by a large population accustomed to digital services and a robust remote work culture.
- Technological Advancements: Early adoption and rapid deployment of 5G technologies, requiring substantial fibre optic infrastructure.
- Telco Investment: Major telecommunications companies are undertaking aggressive fibre deployment projects to maintain competitive advantage.
Key Drivers in Europe:
- EU Digital Agenda: Strong policy support from the European Union to achieve universal broadband coverage with high-speed internet.
- Economic Competitiveness: Recognition of advanced digital infrastructure as a key driver for economic competitiveness and innovation.
- Infrastructure Upgrades: Extensive investment in upgrading aging copper networks to modern fibre optic infrastructure.
Key Drivers in Asia-Pacific:
- Rapid Urbanization & Population Growth: Large and growing populations, particularly in countries like China and India, necessitate massive infrastructure development.
- Government Mandates: Proactive government policies and investment in nationwide fibre optic networks.
- Technological Adoption: High adoption rates for smartphones and digital services, driving demand for robust connectivity.
- Cost-Effectiveness: Increasing efficiency and economies of scale in fibre optic cable manufacturing in the region.
The Telephone Signals application, while historically foundational, is gradually seeing its market share shift towards internet-based communication solutions. However, it remains a significant segment, particularly in regions where traditional telephony is still prevalent or integrated with VoIP services. Cable Television Signals are also a crucial application, with fibre optic technology enabling higher channel capacities and better picture quality, often delivered through hybrid fibre-coaxial (HFC) networks that increasingly rely on fibre for their backbone. The Others segment, encompassing diverse applications like industrial automation, smart grids, and data centre interconnectivity, is a rapidly growing niche, demonstrating the versatility of fibre optics beyond traditional telecommunications.
Telecom Fibre Product Innovations
Telecom fibre product innovations are rapidly advancing, focusing on enhanced performance, cost-effectiveness, and specialized applications. Key developments include the introduction of ultra-low loss fibres that enable longer transmission distances, significantly reducing the need for signal repeaters and lowering operational costs. Bend-insensitive fibres are also gaining traction, simplifying installation and reducing signal degradation in confined spaces within buildings and dense urban environments. Furthermore, advancements in fibre coatings and jacketing materials are improving durability and resistance to environmental factors, extending the lifespan of deployed infrastructure. The competitive advantage of these innovations lies in their ability to meet the ever-increasing bandwidth demands driven by 5G, AI, and IoT, while also facilitating more efficient and cost-effective network deployments for telecom operators and service providers.
Report Segmentation & Scope
This report segments the telecom fibre market by Application and Type.
The Application segments include:
- Internet Communication: This segment encompasses the core of modern connectivity, including broadband internet access for residential and enterprise users, data centre interconnectivity, and cloud services. Projections indicate substantial growth, with market sizes expected to reach several hundred million dollars in the forecast period, driven by escalating data consumption and digital transformation initiatives. Competitive dynamics here are intense, focusing on speed, reliability, and capacity.
- Telephone Signals: While traditional, this segment remains relevant, particularly for legacy systems and VoIP services. Its market size is expected to stabilize or see moderate growth, with competition focused on cost-efficiency and integration with newer communication platforms.
- Cable Television Signals: This segment involves fibre deployment for enhanced television broadcasting, including HD and 4K content delivery. Market sizes are projected to show steady growth as operators upgrade HFC networks. Competition centres on providing higher channel density and superior viewing experiences.
- Others: This broad category includes specialized applications such as industrial Ethernet, smart grid communications, and military/aerospace uses. This segment is anticipated to exhibit the highest growth rates, with market sizes expanding rapidly due to the increasing demand for high-bandwidth, low-latency solutions in diverse sectors.
The Type segments include:
- Multimode Fibre: Primarily used for shorter-distance applications within buildings or campuses, multimode fibre is essential for data centres and local area networks. Growth in this segment is steady, driven by data centre expansion. Market sizes are in the tens of millions.
- Singlemode Fibre: The backbone of long-haul telecommunications, including inter-city and international networks, as well as 5G backhaul. This segment is experiencing robust growth, with market sizes in the hundreds of millions, driven by the ongoing global build-out of high-speed internet infrastructure. Competition is fierce, focusing on performance and cost-effectiveness for large-scale deployments.
Key Drivers of Telecom Fibre Growth
The telecom fibre sector is experiencing substantial growth fueled by several key drivers. The relentless demand for higher internet speeds and bandwidth, driven by the proliferation of streaming services, cloud computing, and the Internet of Things (IoT), is a primary catalyst. Governments worldwide are actively promoting digital inclusion through substantial investments in broadband infrastructure, offering financial incentives and favourable policies for fibre deployment, particularly in underserved rural areas. The global rollout of 5G networks necessitates extensive fibre backhaul to support its high capacity and low latency requirements, making fibre a critical enabler. Furthermore, technological advancements in fibre optic manufacturing are leading to more cost-effective and higher-performing cables, increasing their attractiveness for large-scale deployments.
Challenges in the Telecom Fibre Sector
Despite its rapid growth, the telecom fibre sector faces several challenges. The high upfront cost of deploying fibre optic infrastructure, especially in difficult terrains or sparsely populated regions, remains a significant barrier. Regulatory hurdles, including lengthy permitting processes and complex right-of-way negotiations, can cause substantial delays and increase project costs. Supply chain disruptions, exacerbated by geopolitical factors and global demand fluctuations, can impact the availability and pricing of essential raw materials and components. Moreover, intense competition among numerous players, both established and emerging, can lead to price wars and pressure on profit margins, particularly for commoditized products.
Leading Players in the Telecom Fibre Market
- Sumitomo Corporation
- TE Connectivity
- Corning Incorporated
- Prysmian Spa
- CommScope
- Zhongtian Technologies Co., Ltd.
- Hengtong Optic-Electric Co., Ltd.
- Furukawa Electric Co., Ltd.
- Fujikura Ltd.
- Fiberhome Telecommunication Technologies Co., Ltd.
- Belden Incorporated
- Yangtze Optical Fiber and Cable JSC Ltd.
- Futong Technology Development Hldgs Ltd.
- Sterlite Technologies Limited
- Tongding Interconnection Information Co., Ltd.
Key Developments in Telecom Fibre Sector
- 2023/Q4: Corning Incorporated announced a new generation of ultra-low loss fibre, promising significantly improved signal transmission over longer distances, impacting network architecture and cost efficiencies for operators.
- 2024/Q1: Prysmian Spa secured a significant contract valued at over xx million for submarine fibre optic cable supply, highlighting the growing importance of subsea connectivity for global data transfer.
- 2024/Q2: TE Connectivity launched an innovative fibre optic connector designed for enhanced durability and faster deployment in harsh industrial environments, expanding its reach into new market segments.
- 2024/Q3: Sumitomo Corporation announced a strategic partnership to accelerate fibre deployment in emerging markets, focusing on public-private collaborations to enhance broadband access.
- 2024/Q4: CommScope unveiled a new range of fibre optic cables optimized for 5G small cell deployments, addressing the increased density and capacity needs of mobile networks.
Strategic Telecom Fibre Market Outlook
The strategic outlook for the telecom fibre market remains exceptionally positive, driven by the ongoing digital transformation and the indispensable role of high-speed connectivity. Growth accelerators include the continued expansion of 5G networks, the increasing adoption of fibre-to-the-home (FTTH) across residential markets, and the burgeoning demand from data centres and enterprise cloud services. Strategic opportunities lie in emerging markets with significant untapped potential for broadband deployment and in specialized applications such as industrial IoT and smart city initiatives. Companies that focus on innovation in fibre technology, cost-effective manufacturing, and agile supply chain management will be best positioned to capitalize on this robust market growth and shape the future of global connectivity. The projected market size is estimated to reach over xx billion by 2033, with a consistent upward trajectory.
Telecom Fibre Segmentation
-
1. Application
- 1.1. Telephone Signals
- 1.2. Internet Communication
- 1.3. Cable Television Signals
- 1.4. Others
-
2. Type
- 2.1. Multimode
- 2.2. Singlemode
Telecom Fibre Segmentation By Geography
-
1. North America
- 1.1. United States
- 1.2. Canada
- 1.3. Mexico
-
2. South America
- 2.1. Brazil
- 2.2. Argentina
- 2.3. Rest of South America
-
3. Europe
- 3.1. United Kingdom
- 3.2. Germany
- 3.3. France
- 3.4. Italy
- 3.5. Spain
- 3.6. Russia
- 3.7. Benelux
- 3.8. Nordics
- 3.9. Rest of Europe
-
4. Middle East & Africa
- 4.1. Turkey
- 4.2. Israel
- 4.3. GCC
- 4.4. North Africa
- 4.5. South Africa
- 4.6. Rest of Middle East & Africa
-
5. Asia Pacific
- 5.1. China
- 5.2. India
- 5.3. Japan
- 5.4. South Korea
- 5.5. ASEAN
- 5.6. Oceania
- 5.7. Rest of Asia Pacific
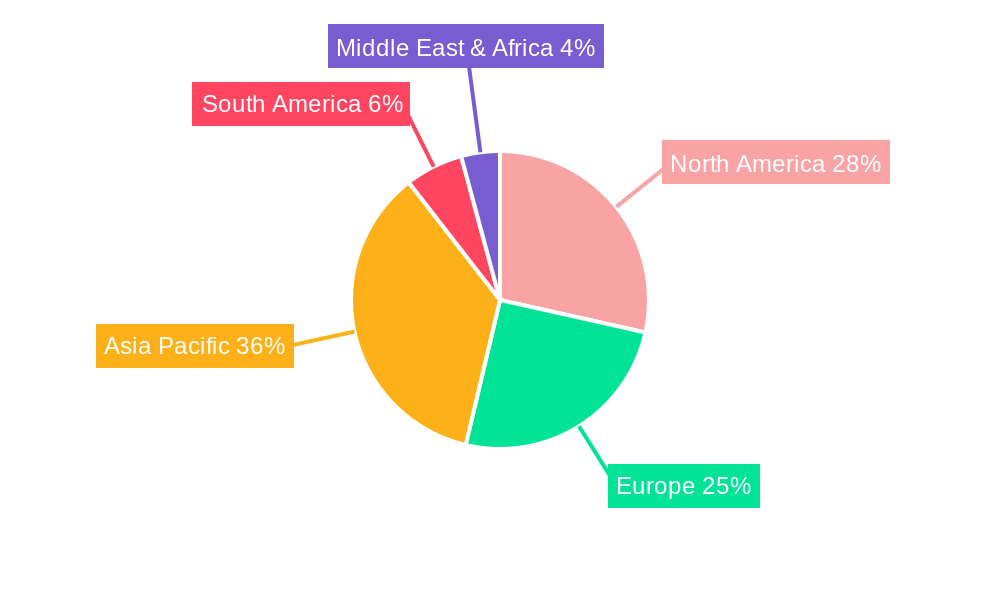
Telecom Fibre Regional Market Share
Geographic Coverage of Telecom Fibre
Telecom Fibre REPORT HIGHLIGHTS
| Aspects | Details |
|---|---|
| Study Period | 2020-2034 |
| Base Year | 2025 |
| Estimated Year | 2026 |
| Forecast Period | 2026-2034 |
| Historical Period | 2020-2025 |
| Growth Rate | CAGR of 6.15% from 2020-2034 |
| Segmentation |
|
Table of Contents
- 1. Introduction
- 1.1. Research Scope
- 1.2. Market Segmentation
- 1.3. Research Methodology
- 1.4. Definitions and Assumptions
- 2. Executive Summary
- 2.1. Introduction
- 3. Market Dynamics
- 3.1. Introduction
- 3.2. Market Drivers
- 3.3. Market Restrains
- 3.4. Market Trends
- 4. Market Factor Analysis
- 4.1. Porters Five Forces
- 4.2. Supply/Value Chain
- 4.3. PESTEL analysis
- 4.4. Market Entropy
- 4.5. Patent/Trademark Analysis
- 5. Global Telecom Fibre Analysis, Insights and Forecast, 2020-2032
- 5.1. Market Analysis, Insights and Forecast - by Application
- 5.1.1. Telephone Signals
- 5.1.2. Internet Communication
- 5.1.3. Cable Television Signals
- 5.1.4. Others
- 5.2. Market Analysis, Insights and Forecast - by Type
- 5.2.1. Multimode
- 5.2.2. Singlemode
- 5.3. Market Analysis, Insights and Forecast - by Region
- 5.3.1. North America
- 5.3.2. South America
- 5.3.3. Europe
- 5.3.4. Middle East & Africa
- 5.3.5. Asia Pacific
- 5.1. Market Analysis, Insights and Forecast - by Application
- 6. North America Telecom Fibre Analysis, Insights and Forecast, 2020-2032
- 6.1. Market Analysis, Insights and Forecast - by Application
- 6.1.1. Telephone Signals
- 6.1.2. Internet Communication
- 6.1.3. Cable Television Signals
- 6.1.4. Others
- 6.2. Market Analysis, Insights and Forecast - by Type
- 6.2.1. Multimode
- 6.2.2. Singlemode
- 6.1. Market Analysis, Insights and Forecast - by Application
- 7. South America Telecom Fibre Analysis, Insights and Forecast, 2020-2032
- 7.1. Market Analysis, Insights and Forecast - by Application
- 7.1.1. Telephone Signals
- 7.1.2. Internet Communication
- 7.1.3. Cable Television Signals
- 7.1.4. Others
- 7.2. Market Analysis, Insights and Forecast - by Type
- 7.2.1. Multimode
- 7.2.2. Singlemode
- 7.1. Market Analysis, Insights and Forecast - by Application
- 8. Europe Telecom Fibre Analysis, Insights and Forecast, 2020-2032
- 8.1. Market Analysis, Insights and Forecast - by Application
- 8.1.1. Telephone Signals
- 8.1.2. Internet Communication
- 8.1.3. Cable Television Signals
- 8.1.4. Others
- 8.2. Market Analysis, Insights and Forecast - by Type
- 8.2.1. Multimode
- 8.2.2. Singlemode
- 8.1. Market Analysis, Insights and Forecast - by Application
- 9. Middle East & Africa Telecom Fibre Analysis, Insights and Forecast, 2020-2032
- 9.1. Market Analysis, Insights and Forecast - by Application
- 9.1.1. Telephone Signals
- 9.1.2. Internet Communication
- 9.1.3. Cable Television Signals
- 9.1.4. Others
- 9.2. Market Analysis, Insights and Forecast - by Type
- 9.2.1. Multimode
- 9.2.2. Singlemode
- 9.1. Market Analysis, Insights and Forecast - by Application
- 10. Asia Pacific Telecom Fibre Analysis, Insights and Forecast, 2020-2032
- 10.1. Market Analysis, Insights and Forecast - by Application
- 10.1.1. Telephone Signals
- 10.1.2. Internet Communication
- 10.1.3. Cable Television Signals
- 10.1.4. Others
- 10.2. Market Analysis, Insights and Forecast - by Type
- 10.2.1. Multimode
- 10.2.2. Singlemode
- 10.1. Market Analysis, Insights and Forecast - by Application
- 11. Competitive Analysis
- 11.1. Global Market Share Analysis 2025
- 11.2. Company Profiles
- 11.2.1 Sumitomo Corporation
- 11.2.1.1. Overview
- 11.2.1.2. Products
- 11.2.1.3. SWOT Analysis
- 11.2.1.4. Recent Developments
- 11.2.1.5. Financials (Based on Availability)
- 11.2.2 TE Connectivity
- 11.2.2.1. Overview
- 11.2.2.2. Products
- 11.2.2.3. SWOT Analysis
- 11.2.2.4. Recent Developments
- 11.2.2.5. Financials (Based on Availability)
- 11.2.3 Corning Incorporated
- 11.2.3.1. Overview
- 11.2.3.2. Products
- 11.2.3.3. SWOT Analysis
- 11.2.3.4. Recent Developments
- 11.2.3.5. Financials (Based on Availability)
- 11.2.4 Prysmian Spa
- 11.2.4.1. Overview
- 11.2.4.2. Products
- 11.2.4.3. SWOT Analysis
- 11.2.4.4. Recent Developments
- 11.2.4.5. Financials (Based on Availability)
- 11.2.5 CommScope
- 11.2.5.1. Overview
- 11.2.5.2. Products
- 11.2.5.3. SWOT Analysis
- 11.2.5.4. Recent Developments
- 11.2.5.5. Financials (Based on Availability)
- 11.2.6 Zhongtian Technologies Co. Ltd.
- 11.2.6.1. Overview
- 11.2.6.2. Products
- 11.2.6.3. SWOT Analysis
- 11.2.6.4. Recent Developments
- 11.2.6.5. Financials (Based on Availability)
- 11.2.7 Hengtong Optic-Electric Co. Ltd.
- 11.2.7.1. Overview
- 11.2.7.2. Products
- 11.2.7.3. SWOT Analysis
- 11.2.7.4. Recent Developments
- 11.2.7.5. Financials (Based on Availability)
- 11.2.8 Furukawa Electric Co. Ltd.
- 11.2.8.1. Overview
- 11.2.8.2. Products
- 11.2.8.3. SWOT Analysis
- 11.2.8.4. Recent Developments
- 11.2.8.5. Financials (Based on Availability)
- 11.2.9 Fujikura Ltd.
- 11.2.9.1. Overview
- 11.2.9.2. Products
- 11.2.9.3. SWOT Analysis
- 11.2.9.4. Recent Developments
- 11.2.9.5. Financials (Based on Availability)
- 11.2.10 Fiberhome Telecommunication Technologies Co. Ltd.
- 11.2.10.1. Overview
- 11.2.10.2. Products
- 11.2.10.3. SWOT Analysis
- 11.2.10.4. Recent Developments
- 11.2.10.5. Financials (Based on Availability)
- 11.2.11 Belden Incorporated
- 11.2.11.1. Overview
- 11.2.11.2. Products
- 11.2.11.3. SWOT Analysis
- 11.2.11.4. Recent Developments
- 11.2.11.5. Financials (Based on Availability)
- 11.2.12 Yangtze Optical Fiber and Cable JSC Ltd.
- 11.2.12.1. Overview
- 11.2.12.2. Products
- 11.2.12.3. SWOT Analysis
- 11.2.12.4. Recent Developments
- 11.2.12.5. Financials (Based on Availability)
- 11.2.13 Futong Technology Development Hldgs Ltd.
- 11.2.13.1. Overview
- 11.2.13.2. Products
- 11.2.13.3. SWOT Analysis
- 11.2.13.4. Recent Developments
- 11.2.13.5. Financials (Based on Availability)
- 11.2.14 Sterlite Technologies Limited
- 11.2.14.1. Overview
- 11.2.14.2. Products
- 11.2.14.3. SWOT Analysis
- 11.2.14.4. Recent Developments
- 11.2.14.5. Financials (Based on Availability)
- 11.2.15 Tongding Interconnection Information Co. Ltd.
- 11.2.15.1. Overview
- 11.2.15.2. Products
- 11.2.15.3. SWOT Analysis
- 11.2.15.4. Recent Developments
- 11.2.15.5. Financials (Based on Availability)
- 11.2.1 Sumitomo Corporation
List of Figures
- Figure 1: Global Telecom Fibre Revenue Breakdown (undefined, %) by Region 2025 & 2033
- Figure 2: North America Telecom Fibre Revenue (undefined), by Application 2025 & 2033
- Figure 3: North America Telecom Fibre Revenue Share (%), by Application 2025 & 2033
- Figure 4: North America Telecom Fibre Revenue (undefined), by Type 2025 & 2033
- Figure 5: North America Telecom Fibre Revenue Share (%), by Type 2025 & 2033
- Figure 6: North America Telecom Fibre Revenue (undefined), by Country 2025 & 2033
- Figure 7: North America Telecom Fibre Revenue Share (%), by Country 2025 & 2033
- Figure 8: South America Telecom Fibre Revenue (undefined), by Application 2025 & 2033
- Figure 9: South America Telecom Fibre Revenue Share (%), by Application 2025 & 2033
- Figure 10: South America Telecom Fibre Revenue (undefined), by Type 2025 & 2033
- Figure 11: South America Telecom Fibre Revenue Share (%), by Type 2025 & 2033
- Figure 12: South America Telecom Fibre Revenue (undefined), by Country 2025 & 2033
- Figure 13: South America Telecom Fibre Revenue Share (%), by Country 2025 & 2033
- Figure 14: Europe Telecom Fibre Revenue (undefined), by Application 2025 & 2033
- Figure 15: Europe Telecom Fibre Revenue Share (%), by Application 2025 & 2033
- Figure 16: Europe Telecom Fibre Revenue (undefined), by Type 2025 & 2033
- Figure 17: Europe Telecom Fibre Revenue Share (%), by Type 2025 & 2033
- Figure 18: Europe Telecom Fibre Revenue (undefined), by Country 2025 & 2033
- Figure 19: Europe Telecom Fibre Revenue Share (%), by Country 2025 & 2033
- Figure 20: Middle East & Africa Telecom Fibre Revenue (undefined), by Application 2025 & 2033
- Figure 21: Middle East & Africa Telecom Fibre Revenue Share (%), by Application 2025 & 2033
- Figure 22: Middle East & Africa Telecom Fibre Revenue (undefined), by Type 2025 & 2033
- Figure 23: Middle East & Africa Telecom Fibre Revenue Share (%), by Type 2025 & 2033
- Figure 24: Middle East & Africa Telecom Fibre Revenue (undefined), by Country 2025 & 2033
- Figure 25: Middle East & Africa Telecom Fibre Revenue Share (%), by Country 2025 & 2033
- Figure 26: Asia Pacific Telecom Fibre Revenue (undefined), by Application 2025 & 2033
- Figure 27: Asia Pacific Telecom Fibre Revenue Share (%), by Application 2025 & 2033
- Figure 28: Asia Pacific Telecom Fibre Revenue (undefined), by Type 2025 & 2033
- Figure 29: Asia Pacific Telecom Fibre Revenue Share (%), by Type 2025 & 2033
- Figure 30: Asia Pacific Telecom Fibre Revenue (undefined), by Country 2025 & 2033
- Figure 31: Asia Pacific Telecom Fibre Revenue Share (%), by Country 2025 & 2033
List of Tables
- Table 1: Global Telecom Fibre Revenue undefined Forecast, by Application 2020 & 2033
- Table 2: Global Telecom Fibre Revenue undefined Forecast, by Type 2020 & 2033
- Table 3: Global Telecom Fibre Revenue undefined Forecast, by Region 2020 & 2033
- Table 4: Global Telecom Fibre Revenue undefined Forecast, by Application 2020 & 2033
- Table 5: Global Telecom Fibre Revenue undefined Forecast, by Type 2020 & 2033
- Table 6: Global Telecom Fibre Revenue undefined Forecast, by Country 2020 & 2033
- Table 7: United States Telecom Fibre Revenue (undefined) Forecast, by Application 2020 & 2033
- Table 8: Canada Telecom Fibre Revenue (undefined) Forecast, by Application 2020 & 2033
- Table 9: Mexico Telecom Fibre Revenue (undefined) Forecast, by Application 2020 & 2033
- Table 10: Global Telecom Fibre Revenue undefined Forecast, by Application 2020 & 2033
- Table 11: Global Telecom Fibre Revenue undefined Forecast, by Type 2020 & 2033
- Table 12: Global Telecom Fibre Revenue undefined Forecast, by Country 2020 & 2033
- Table 13: Brazil Telecom Fibre Revenue (undefined) Forecast, by Application 2020 & 2033
- Table 14: Argentina Telecom Fibre Revenue (undefined) Forecast, by Application 2020 & 2033
- Table 15: Rest of South America Telecom Fibre Revenue (undefined) Forecast, by Application 2020 & 2033
- Table 16: Global Telecom Fibre Revenue undefined Forecast, by Application 2020 & 2033
- Table 17: Global Telecom Fibre Revenue undefined Forecast, by Type 2020 & 2033
- Table 18: Global Telecom Fibre Revenue undefined Forecast, by Country 2020 & 2033
- Table 19: United Kingdom Telecom Fibre Revenue (undefined) Forecast, by Application 2020 & 2033
- Table 20: Germany Telecom Fibre Revenue (undefined) Forecast, by Application 2020 & 2033
- Table 21: France Telecom Fibre Revenue (undefined) Forecast, by Application 2020 & 2033
- Table 22: Italy Telecom Fibre Revenue (undefined) Forecast, by Application 2020 & 2033
- Table 23: Spain Telecom Fibre Revenue (undefined) Forecast, by Application 2020 & 2033
- Table 24: Russia Telecom Fibre Revenue (undefined) Forecast, by Application 2020 & 2033
- Table 25: Benelux Telecom Fibre Revenue (undefined) Forecast, by Application 2020 & 2033
- Table 26: Nordics Telecom Fibre Revenue (undefined) Forecast, by Application 2020 & 2033
- Table 27: Rest of Europe Telecom Fibre Revenue (undefined) Forecast, by Application 2020 & 2033
- Table 28: Global Telecom Fibre Revenue undefined Forecast, by Application 2020 & 2033
- Table 29: Global Telecom Fibre Revenue undefined Forecast, by Type 2020 & 2033
- Table 30: Global Telecom Fibre Revenue undefined Forecast, by Country 2020 & 2033
- Table 31: Turkey Telecom Fibre Revenue (undefined) Forecast, by Application 2020 & 2033
- Table 32: Israel Telecom Fibre Revenue (undefined) Forecast, by Application 2020 & 2033
- Table 33: GCC Telecom Fibre Revenue (undefined) Forecast, by Application 2020 & 2033
- Table 34: North Africa Telecom Fibre Revenue (undefined) Forecast, by Application 2020 & 2033
- Table 35: South Africa Telecom Fibre Revenue (undefined) Forecast, by Application 2020 & 2033
- Table 36: Rest of Middle East & Africa Telecom Fibre Revenue (undefined) Forecast, by Application 2020 & 2033
- Table 37: Global Telecom Fibre Revenue undefined Forecast, by Application 2020 & 2033
- Table 38: Global Telecom Fibre Revenue undefined Forecast, by Type 2020 & 2033
- Table 39: Global Telecom Fibre Revenue undefined Forecast, by Country 2020 & 2033
- Table 40: China Telecom Fibre Revenue (undefined) Forecast, by Application 2020 & 2033
- Table 41: India Telecom Fibre Revenue (undefined) Forecast, by Application 2020 & 2033
- Table 42: Japan Telecom Fibre Revenue (undefined) Forecast, by Application 2020 & 2033
- Table 43: South Korea Telecom Fibre Revenue (undefined) Forecast, by Application 2020 & 2033
- Table 44: ASEAN Telecom Fibre Revenue (undefined) Forecast, by Application 2020 & 2033
- Table 45: Oceania Telecom Fibre Revenue (undefined) Forecast, by Application 2020 & 2033
- Table 46: Rest of Asia Pacific Telecom Fibre Revenue (undefined) Forecast, by Application 2020 & 2033
Frequently Asked Questions
1. What is the projected Compound Annual Growth Rate (CAGR) of the Telecom Fibre?
The projected CAGR is approximately 6.15%.
2. Which companies are prominent players in the Telecom Fibre?
Key companies in the market include Sumitomo Corporation, TE Connectivity, Corning Incorporated, Prysmian Spa, CommScope, Zhongtian Technologies Co., Ltd., Hengtong Optic-Electric Co., Ltd., Furukawa Electric Co., Ltd., Fujikura Ltd., Fiberhome Telecommunication Technologies Co., Ltd., Belden Incorporated, Yangtze Optical Fiber and Cable JSC Ltd., Futong Technology Development Hldgs Ltd., Sterlite Technologies Limited, Tongding Interconnection Information Co., Ltd..
3. What are the main segments of the Telecom Fibre?
The market segments include Application, Type.
4. Can you provide details about the market size?
The market size is estimated to be USD XXX N/A as of 2022.
5. What are some drivers contributing to market growth?
N/A
6. What are the notable trends driving market growth?
N/A
7. Are there any restraints impacting market growth?
N/A
8. Can you provide examples of recent developments in the market?
N/A
9. What pricing options are available for accessing the report?
Pricing options include single-user, multi-user, and enterprise licenses priced at USD 4250.00, USD 6375.00, and USD 8500.00 respectively.
10. Is the market size provided in terms of value or volume?
The market size is provided in terms of value, measured in N/A.
11. Are there any specific market keywords associated with the report?
Yes, the market keyword associated with the report is "Telecom Fibre," which aids in identifying and referencing the specific market segment covered.
12. How do I determine which pricing option suits my needs best?
The pricing options vary based on user requirements and access needs. Individual users may opt for single-user licenses, while businesses requiring broader access may choose multi-user or enterprise licenses for cost-effective access to the report.
13. Are there any additional resources or data provided in the Telecom Fibre report?
While the report offers comprehensive insights, it's advisable to review the specific contents or supplementary materials provided to ascertain if additional resources or data are available.
14. How can I stay updated on further developments or reports in the Telecom Fibre?
To stay informed about further developments, trends, and reports in the Telecom Fibre, consider subscribing to industry newsletters, following relevant companies and organizations, or regularly checking reputable industry news sources and publications.
Methodology
Step 1 - Identification of Relevant Samples Size from Population Database


Step 2 - Approaches for Defining Global Market Size (Value, Volume* & Price*)

Note*: In applicable scenarios
Step 3 - Data Sources
Primary Research
- Web Analytics
- Survey Reports
- Research Institute
- Latest Research Reports
- Opinion Leaders
Secondary Research
- Annual Reports
- White Paper
- Latest Press Release
- Industry Association
- Paid Database
- Investor Presentations

Step 4 - Data Triangulation
Involves using different sources of information in order to increase the validity of a study
These sources are likely to be stakeholders in a program - participants, other researchers, program staff, other community members, and so on.
Then we put all data in single framework & apply various statistical tools to find out the dynamic on the market.
During the analysis stage, feedback from the stakeholder groups would be compared to determine areas of agreement as well as areas of divergence