

Key Insights
The global Tall Oil Rosin (TOR) market is projected for substantial growth, driven by escalating demand from adhesive, ink, coating, and rubber industries. Forecasted to reach a market size of $709.2 million by 2025, the market is expected to expand at a Compound Annual Growth Rate (CAGR) of 4.1% from 2025 to 2033. This expansion reflects the increasing adoption of TOR as a sustainable and versatile bio-based raw material, presenting an attractive alternative to petroleum-based products. Innovations in processing and product development are further broadening TOR's application scope and market penetration.
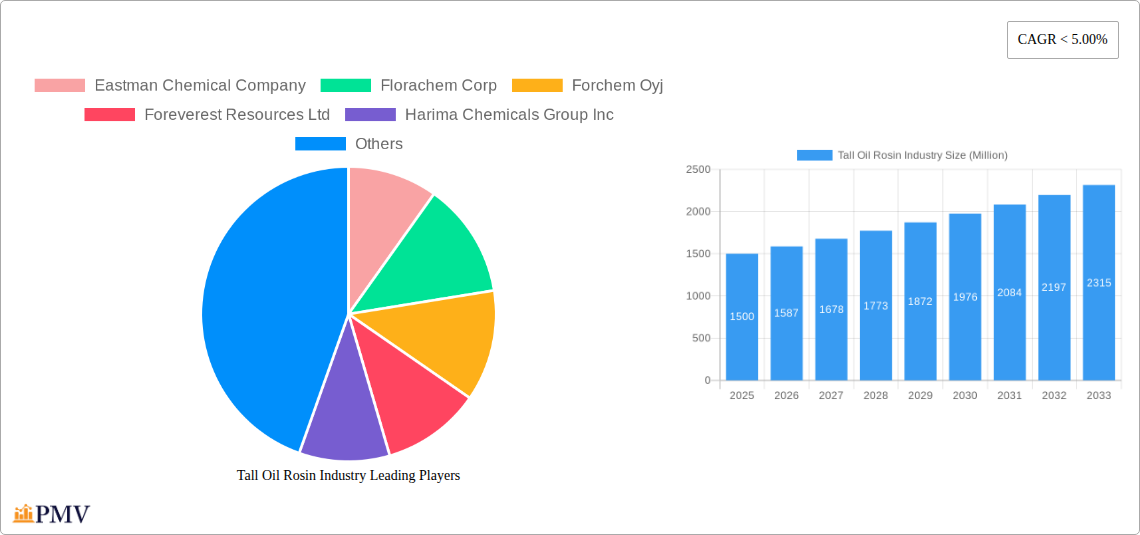
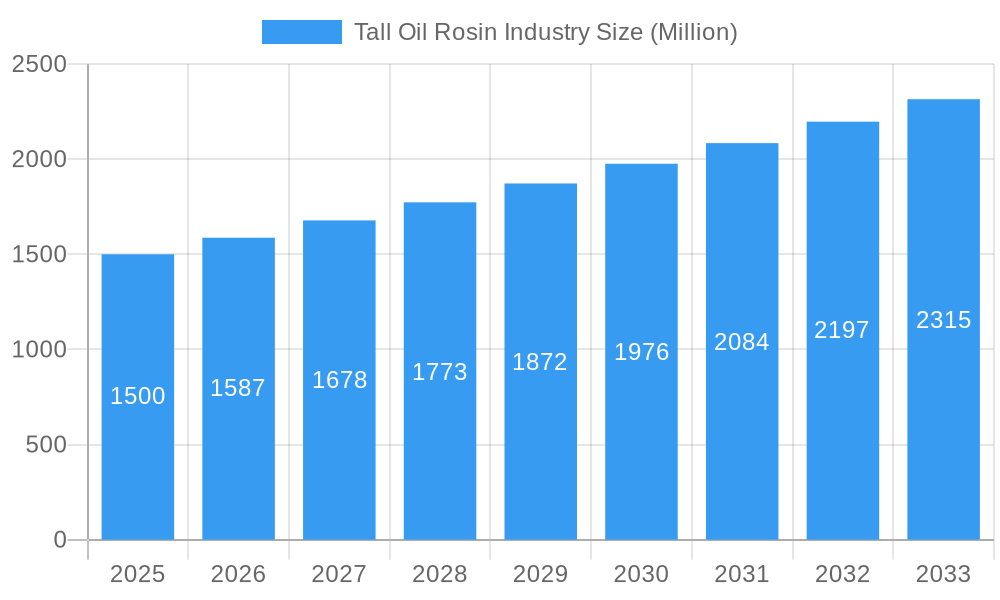
Tall Oil Rosin Industry Market Size (In Million)
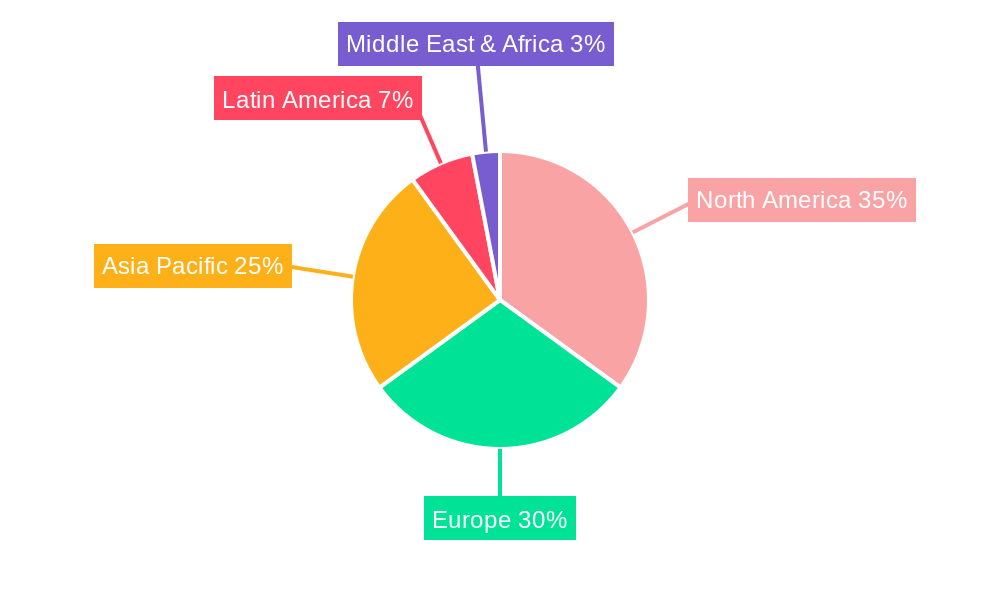
Geographically, North America and Europe will maintain significant market share due to established pulp and paper industries and a commitment to sustainable chemical solutions. The Asia Pacific region is anticipated to experience the most rapid growth, propelled by industrialization, expanding manufacturing, and a growing consumer base. Increased awareness and regulatory support for environmentally friendly materials will continue to fuel market expansion. While feedstock availability and crude oil prices may influence TOR pricing, the long-term market outlook remains positive, supported by ongoing innovation and application diversification.
Tall Oil Rosin Industry Company Market Share
This comprehensive report provides an in-depth analysis of the global Tall Oil Rosin industry, covering the historical period (2019-2024) and a detailed forecast period (2025-2033), with 2025 serving as the base year. It offers critical insights into market dynamics, key players, emerging trends, and segment-specific growth opportunities within the tall oil rosin market. This study is vital for understanding the broader rosin derivatives market, the pine chemical industry, and the applications of tall oil fatty acid (TOFA) and distilled tall oil (DTO).
Tall Oil Rosin Industry Market Structure & Competitive Dynamics
The global tall oil rosin market exhibits a moderately consolidated structure, characterized by the presence of a few dominant players and a significant number of smaller, specialized manufacturers. Key companies such as Eastman Chemical Company, Ingevity Corporation, and Kraton Corporation hold substantial market share due to their extensive product portfolios, robust R&D capabilities, and established global distribution networks. The innovation ecosystem is driven by continuous advancements in processing technologies and the development of novel applications, particularly in the adhesives, paints and coatings, and rubber sectors. Regulatory frameworks, primarily concerning environmental sustainability and chemical safety, play a crucial role in shaping market entry and product development strategies. Product substitutes, though present in some niche applications, are often unable to match the cost-effectiveness and performance characteristics of tall oil rosin-based products. End-user trends are increasingly favoring bio-based and sustainable materials, which bodes well for the tall oil rosin industry. Mergers and acquisitions (M&A) activities are sporadic but significant, aimed at expanding market reach, acquiring new technologies, or consolidating market share. For instance, M&A deal values in the past few years have ranged from tens of millions to hundreds of millions of dollars, impacting competitive landscapes. The market share of leading players is estimated to be between 15% and 25% each, with the top five players collectively accounting for over 60% of the global market.
Tall Oil Rosin Industry Industry Trends & Insights
The tall oil rosin industry is experiencing robust growth, projected at a Compound Annual Growth Rate (CAGR) of approximately 4.5% over the forecast period. This expansion is primarily propelled by the escalating demand from diverse end-user industries, including pulp & paper, adhesives, and paints and coatings. The increasing focus on sustainability and the utilization of renewable resources are significant market growth drivers. Tall oil rosin, a bio-based byproduct of the Kraft pulping process, aligns perfectly with the global shift towards greener chemistry and circular economy principles. Technological disruptions are evident in the advancements of tall oil fractionation and the development of high-performance rosin resins with tailored properties for specific applications. Consumer preferences are increasingly leaning towards products that are environmentally friendly and derived from natural sources, further stimulating the demand for tall oil rosin and its derivatives like tall oil fatty acid (TOFA) and distilled tall oil (DTO). Competitive dynamics are intensifying as companies invest heavily in R&D to enhance product quality, reduce production costs, and explore new application areas, thereby strengthening their positions in the pine chemicals market. Market penetration of tall oil rosin in emerging economies is steadily increasing, driven by industrialization and the growing adoption of advanced materials in sectors like automotive and building and construction. The growing demand for eco-friendly inks and toners and electronics applications also contributes significantly to market expansion.
Dominant Markets & Segments in Tall Oil Rosin Industry
The Pulp & Paper segment is a dominant force within the tall oil rosin industry, accounting for approximately 30% of the global market revenue in the base year. This dominance is driven by the extensive use of rosin derivatives as sizing agents in papermaking, improving water resistance and printability. Key drivers for this segment include the consistent global demand for paper and paperboard products, supported by economic policies promoting domestic production and infrastructure development in developing nations. The Adhesives segment represents another significant market, capturing around 20% of the market share. The versatility of rosin resins in formulating pressure-sensitive adhesives (PSAs), hot-melt adhesives, and solvent-based adhesives for applications in packaging, labeling, and automotive assembly fuels its growth. The Paints and Coatings segment, with a market share of approximately 15%, benefits from the use of tall oil rosin derivatives in alkyd resins, providing enhanced gloss, durability, and adhesion. The Automotive industry's increasing reliance on lightweight materials and sustainable solutions further boosts demand for tall oil rosin in coatings and adhesives. The Building and Construction sector also contributes substantially through its demand for sealants, coatings, and flooring adhesives. Geographically, North America and Europe are the leading markets due to the established presence of major pulp and paper mills, a well-developed chemical industry, and strong consumer demand for sustainable products. Asia Pacific is emerging as a high-growth region, driven by rapid industrialization and increasing adoption of tall oil rosin in diverse applications, particularly in China and India. The rubber industry, utilizing tall oil rosin as a tackifier and processing aid, contributes steadily to market growth, driven by the automotive and tire manufacturing sectors.
Tall Oil Rosin Industry Product Innovations
Recent product innovations in the tall oil rosin industry focus on developing high-performance rosin resins with enhanced thermal stability, UV resistance, and tackifying properties. Companies are investing in R&D to create specialized tall oil fatty acid (TOFA) and distilled tall oil (DTO) derivatives for niche applications in electronics, such as specialized fluxes and encapsulants. These innovations aim to provide competitive advantages by offering superior performance characteristics and meeting stringent industry standards. Furthermore, the development of bio-based and biodegradable rosin ester adhesives and coatings is a significant trend, aligning with the growing demand for sustainable solutions and expanding the market fit for tall oil rosin products.
Report Segmentation & Scope
This report meticulously segments the tall oil rosin market by Application, including Pulp & Paper (projected market size of over $500 Million in 2025, with a CAGR of 4.2%), Inks and Toners, Adhesives (market size exceeding $400 Million in 2025, CAGR of 4.8%), Paints and Coatings (market size of over $300 Million in 2025, CAGR of 4.0%), Electronics, Hygiene Products, Rubber, and Other Applications. The End-user Industry segmentation covers Printing, Automotive, Building and Construction, Chemicals, Electronics and Electrical, Mining, and Other End-user Industries. Each segment is analyzed for its growth projections, market sizes, and competitive dynamics, providing a granular view of the industry's landscape. The Adhesives segment is expected to show significant growth, driven by its use in packaging and disposable hygiene products.
Key Drivers of Tall Oil Rosin Industry Growth
The tall oil rosin industry's growth is propelled by several key drivers. The increasing global emphasis on sustainability and the demand for bio-based chemicals are paramount, positioning tall oil rosin as an eco-friendly alternative to petroleum-based products. Technological advancements in tall oil fractionation have led to the production of higher-purity products and novel derivatives, expanding their application scope. The robust growth of key end-user industries like packaging, automotive, and building and construction, particularly in emerging economies, directly translates to higher demand for rosin derivatives. Favorable government regulations and incentives promoting the use of renewable resources further support market expansion.
Challenges in the Tall Oil Rosin Industry Sector
Despite its growth potential, the tall oil rosin industry faces several challenges. Fluctuations in the availability and pricing of crude tall oil (CTO), directly linked to the output of pulp and paper mills, can impact production costs and market stability. Stringent environmental regulations regarding chemical emissions and waste management can increase operational expenses for manufacturers. The presence of alternative materials, though often with performance trade-offs, poses a competitive pressure. Supply chain disruptions, as witnessed in recent global events, can affect the timely delivery of raw materials and finished products, impacting market reach and customer satisfaction.
Leading Players in the Tall Oil Rosin Industry Market
- Eastman Chemical Company
- Florachem Corp
- Forchem Oyj
- Foreverest Resources Ltd
- Harima Chemicals Group Inc
- Ilim Group
- Ingevity Corporation
- Kraton Corporation
- OOO Torgoviy Dom Lesokhimik
- Pine Chemical Group
- Segezha-Group
- Songchuan Pine Chemicals Co Ltd
- Stora Enso
Key Developments in Tall Oil Rosin Industry Sector
- September 2022: Ingevity Corporation announced a general price increase for tall oil fatty acid and distilled tall oil products and derivatives, also for rosin-based resins associated with its industrial specialties portfolio. This strategic move reflects increasing raw material costs and strong market demand.
- September 2021: Kraton Corp. increased prices between 10 and 15% across its crude tall oil refinery products and derivative company. This price adjustment was a response to rising input costs and continued robust demand for their offerings.
Strategic Tall Oil Rosin Industry Market Outlook
The strategic outlook for the tall oil rosin industry is highly positive, with significant growth accelerators in place. The increasing demand for sustainable and bio-based materials across various sectors will continue to drive market expansion. Innovations in product development, particularly for high-performance rosin resins and specialized tall oil fatty acid (TOFA) and distilled tall oil (DTO) applications in electronics and advanced materials, present substantial opportunities. Strategic partnerships and collaborations aimed at expanding production capacity and market reach, especially in the rapidly growing Asia Pacific region, will be crucial for future success. The industry is well-positioned to capitalize on the global shift towards a circular economy and green chemistry principles.
Tall Oil Rosin Industry Segmentation
-
1. Application
- 1.1. Pulp & Paper
- 1.2. Inks and Toners
- 1.3. Adhesives
- 1.4. Paints and Coatings
- 1.5. Electronics
- 1.6. Hygiene Products
- 1.7. Rubber
- 1.8. Other Applications
-
2. End-user Industry
- 2.1. Printing
- 2.2. Automotive
- 2.3. Building and Construction
- 2.4. Chemicals
- 2.5. Electronics and Electrical
- 2.6. Mining
- 2.7. Other End-user Industries
Tall Oil Rosin Industry Segmentation By Geography
-
1. Asia Pacific
- 1.1. China
- 1.2. India
- 1.3. Japan
- 1.4. South Korea
- 1.5. Rest of Asia Pacific
-
2. North America
- 2.1. United States
- 2.2. Canada
- 2.3. Mexico
-
3. Europe
- 3.1. Germany
- 3.2. United Kingdom
- 3.3. Italy
- 3.4. France
- 3.5. Rest of Europe
-
4. South America
- 4.1. Brazil
- 4.2. Argentina
- 4.3. Rest of South America
-
5. Middle East and Africa
- 5.1. Saudi Arabia
- 5.2. South Africa
- 5.3. Rest of Middle East and Africa
Tall Oil Rosin Industry Regional Market Share
Geographic Coverage of Tall Oil Rosin Industry
Tall Oil Rosin Industry REPORT HIGHLIGHTS
| Aspects | Details |
|---|---|
| Study Period | 2020-2034 |
| Base Year | 2025 |
| Estimated Year | 2026 |
| Forecast Period | 2026-2034 |
| Historical Period | 2020-2025 |
| Growth Rate | CAGR of 4.1% from 2020-2034 |
| Segmentation |
|
Table of Contents
- 1. Introduction
- 1.1. Research Scope
- 1.2. Market Segmentation
- 1.3. Research Objective
- 1.4. Definitions and Assumptions
- 2. Executive Summary
- 2.1. Market Snapshot
- 3. Market Dynamics
- 3.1. Market Drivers
- 3.2. Market Restrains
- 3.3. Market Trends
- 3.4. Market Opportunities
- 4. Market Factor Analysis
- 4.1. Porters Five Forces
- 4.1.1. Bargaining Power of Suppliers
- 4.1.2. Bargaining Power of Buyers
- 4.1.3. Threat of New Entrants
- 4.1.4. Threat of Substitutes
- 4.1.5. Competitive Rivalry
- 4.2. PESTEL analysis
- 4.3. BCG Analysis
- 4.3.1. Stars (High Growth, High Market Share)
- 4.3.2. Cash Cows (Low Growth, High Market Share)
- 4.3.3. Question Mark (High Growth, Low Market Share)
- 4.3.4. Dogs (Low Growth, Low Market Share)
- 4.4. Ansoff Matrix Analysis
- 4.5. Supply Chain Analysis
- 4.6. Regulatory Landscape
- 4.7. Current Market Potential and Opportunity Assessment (TAM–SAM–SOM Framework)
- 4.8. PMV Analyst Note
- 4.1. Porters Five Forces
- 5. Market Analysis, Insights and Forecast 2021-2033
- 5.1. Market Analysis, Insights and Forecast - by Application
- 5.1.1. Pulp & Paper
- 5.1.2. Inks and Toners
- 5.1.3. Adhesives
- 5.1.4. Paints and Coatings
- 5.1.5. Electronics
- 5.1.6. Hygiene Products
- 5.1.7. Rubber
- 5.1.8. Other Applications
- 5.2. Market Analysis, Insights and Forecast - by End-user Industry
- 5.2.1. Printing
- 5.2.2. Automotive
- 5.2.3. Building and Construction
- 5.2.4. Chemicals
- 5.2.5. Electronics and Electrical
- 5.2.6. Mining
- 5.2.7. Other End-user Industries
- 5.3. Market Analysis, Insights and Forecast - by Region
- 5.3.1. Asia Pacific
- 5.3.2. North America
- 5.3.3. Europe
- 5.3.4. South America
- 5.3.5. Middle East and Africa
- 5.1. Market Analysis, Insights and Forecast - by Application
- 6. Global Tall Oil Rosin Industry Analysis, Insights and Forecast, 2021-2033
- 6.1. Market Analysis, Insights and Forecast - by Application
- 6.1.1. Pulp & Paper
- 6.1.2. Inks and Toners
- 6.1.3. Adhesives
- 6.1.4. Paints and Coatings
- 6.1.5. Electronics
- 6.1.6. Hygiene Products
- 6.1.7. Rubber
- 6.1.8. Other Applications
- 6.2. Market Analysis, Insights and Forecast - by End-user Industry
- 6.2.1. Printing
- 6.2.2. Automotive
- 6.2.3. Building and Construction
- 6.2.4. Chemicals
- 6.2.5. Electronics and Electrical
- 6.2.6. Mining
- 6.2.7. Other End-user Industries
- 6.1. Market Analysis, Insights and Forecast - by Application
- 7. Asia Pacific Tall Oil Rosin Industry Analysis, Insights and Forecast, 2020-2032
- 7.1. Market Analysis, Insights and Forecast - by Application
- 7.1.1. Pulp & Paper
- 7.1.2. Inks and Toners
- 7.1.3. Adhesives
- 7.1.4. Paints and Coatings
- 7.1.5. Electronics
- 7.1.6. Hygiene Products
- 7.1.7. Rubber
- 7.1.8. Other Applications
- 7.2. Market Analysis, Insights and Forecast - by End-user Industry
- 7.2.1. Printing
- 7.2.2. Automotive
- 7.2.3. Building and Construction
- 7.2.4. Chemicals
- 7.2.5. Electronics and Electrical
- 7.2.6. Mining
- 7.2.7. Other End-user Industries
- 7.1. Market Analysis, Insights and Forecast - by Application
- 8. North America Tall Oil Rosin Industry Analysis, Insights and Forecast, 2020-2032
- 8.1. Market Analysis, Insights and Forecast - by Application
- 8.1.1. Pulp & Paper
- 8.1.2. Inks and Toners
- 8.1.3. Adhesives
- 8.1.4. Paints and Coatings
- 8.1.5. Electronics
- 8.1.6. Hygiene Products
- 8.1.7. Rubber
- 8.1.8. Other Applications
- 8.2. Market Analysis, Insights and Forecast - by End-user Industry
- 8.2.1. Printing
- 8.2.2. Automotive
- 8.2.3. Building and Construction
- 8.2.4. Chemicals
- 8.2.5. Electronics and Electrical
- 8.2.6. Mining
- 8.2.7. Other End-user Industries
- 8.1. Market Analysis, Insights and Forecast - by Application
- 9. Europe Tall Oil Rosin Industry Analysis, Insights and Forecast, 2020-2032
- 9.1. Market Analysis, Insights and Forecast - by Application
- 9.1.1. Pulp & Paper
- 9.1.2. Inks and Toners
- 9.1.3. Adhesives
- 9.1.4. Paints and Coatings
- 9.1.5. Electronics
- 9.1.6. Hygiene Products
- 9.1.7. Rubber
- 9.1.8. Other Applications
- 9.2. Market Analysis, Insights and Forecast - by End-user Industry
- 9.2.1. Printing
- 9.2.2. Automotive
- 9.2.3. Building and Construction
- 9.2.4. Chemicals
- 9.2.5. Electronics and Electrical
- 9.2.6. Mining
- 9.2.7. Other End-user Industries
- 9.1. Market Analysis, Insights and Forecast - by Application
- 10. South America Tall Oil Rosin Industry Analysis, Insights and Forecast, 2020-2032
- 10.1. Market Analysis, Insights and Forecast - by Application
- 10.1.1. Pulp & Paper
- 10.1.2. Inks and Toners
- 10.1.3. Adhesives
- 10.1.4. Paints and Coatings
- 10.1.5. Electronics
- 10.1.6. Hygiene Products
- 10.1.7. Rubber
- 10.1.8. Other Applications
- 10.2. Market Analysis, Insights and Forecast - by End-user Industry
- 10.2.1. Printing
- 10.2.2. Automotive
- 10.2.3. Building and Construction
- 10.2.4. Chemicals
- 10.2.5. Electronics and Electrical
- 10.2.6. Mining
- 10.2.7. Other End-user Industries
- 10.1. Market Analysis, Insights and Forecast - by Application
- 11. Middle East and Africa Tall Oil Rosin Industry Analysis, Insights and Forecast, 2020-2032
- 11.1. Market Analysis, Insights and Forecast - by Application
- 11.1.1. Pulp & Paper
- 11.1.2. Inks and Toners
- 11.1.3. Adhesives
- 11.1.4. Paints and Coatings
- 11.1.5. Electronics
- 11.1.6. Hygiene Products
- 11.1.7. Rubber
- 11.1.8. Other Applications
- 11.2. Market Analysis, Insights and Forecast - by End-user Industry
- 11.2.1. Printing
- 11.2.2. Automotive
- 11.2.3. Building and Construction
- 11.2.4. Chemicals
- 11.2.5. Electronics and Electrical
- 11.2.6. Mining
- 11.2.7. Other End-user Industries
- 11.1. Market Analysis, Insights and Forecast - by Application
- 12. Competitive Analysis
- 12.1. Company Profiles
- 12.1.1 Eastman Chemical Company
- 12.1.1.1. Company Overview
- 12.1.1.2. Products
- 12.1.1.3. Company Financials
- 12.1.1.4. SWOT Analysis
- 12.1.2 Florachem Corp
- 12.1.2.1. Company Overview
- 12.1.2.2. Products
- 12.1.2.3. Company Financials
- 12.1.2.4. SWOT Analysis
- 12.1.3 Forchem Oyj
- 12.1.3.1. Company Overview
- 12.1.3.2. Products
- 12.1.3.3. Company Financials
- 12.1.3.4. SWOT Analysis
- 12.1.4 Foreverest Resources Ltd
- 12.1.4.1. Company Overview
- 12.1.4.2. Products
- 12.1.4.3. Company Financials
- 12.1.4.4. SWOT Analysis
- 12.1.5 Harima Chemicals Group Inc
- 12.1.5.1. Company Overview
- 12.1.5.2. Products
- 12.1.5.3. Company Financials
- 12.1.5.4. SWOT Analysis
- 12.1.6 Ilim Group
- 12.1.6.1. Company Overview
- 12.1.6.2. Products
- 12.1.6.3. Company Financials
- 12.1.6.4. SWOT Analysis
- 12.1.7 Ingevity Corporation
- 12.1.7.1. Company Overview
- 12.1.7.2. Products
- 12.1.7.3. Company Financials
- 12.1.7.4. SWOT Analysis
- 12.1.8 Kraton Corporation
- 12.1.8.1. Company Overview
- 12.1.8.2. Products
- 12.1.8.3. Company Financials
- 12.1.8.4. SWOT Analysis
- 12.1.9 OOO Torgoviy Dom Lesokhimik
- 12.1.9.1. Company Overview
- 12.1.9.2. Products
- 12.1.9.3. Company Financials
- 12.1.9.4. SWOT Analysis
- 12.1.10 Pine Chemical Group
- 12.1.10.1. Company Overview
- 12.1.10.2. Products
- 12.1.10.3. Company Financials
- 12.1.10.4. SWOT Analysis
- 12.1.11 Segezha-Group
- 12.1.11.1. Company Overview
- 12.1.11.2. Products
- 12.1.11.3. Company Financials
- 12.1.11.4. SWOT Analysis
- 12.1.12 Songchuan Pine Chemicals Co Ltd
- 12.1.12.1. Company Overview
- 12.1.12.2. Products
- 12.1.12.3. Company Financials
- 12.1.12.4. SWOT Analysis
- 12.1.13 Stora Enso*List Not Exhaustive
- 12.1.13.1. Company Overview
- 12.1.13.2. Products
- 12.1.13.3. Company Financials
- 12.1.13.4. SWOT Analysis
- 12.1.1 Eastman Chemical Company
- 12.2. Market Entropy
- 12.2.1 Company's Key Areas Served
- 12.2.2 Recent Developments
- 12.3. Company Market Share Analysis 2025
- 12.3.1 Top 5 Companies Market Share Analysis
- 12.3.2 Top 3 Companies Market Share Analysis
- 12.4. List of Potential Customers
- 13. Research Methodology
List of Figures
- Figure 1: Global Tall Oil Rosin Industry Revenue Breakdown (million, %) by Region 2025 & 2033
- Figure 2: Asia Pacific Tall Oil Rosin Industry Revenue (million), by Application 2025 & 2033
- Figure 3: Asia Pacific Tall Oil Rosin Industry Revenue Share (%), by Application 2025 & 2033
- Figure 4: Asia Pacific Tall Oil Rosin Industry Revenue (million), by End-user Industry 2025 & 2033
- Figure 5: Asia Pacific Tall Oil Rosin Industry Revenue Share (%), by End-user Industry 2025 & 2033
- Figure 6: Asia Pacific Tall Oil Rosin Industry Revenue (million), by Country 2025 & 2033
- Figure 7: Asia Pacific Tall Oil Rosin Industry Revenue Share (%), by Country 2025 & 2033
- Figure 8: North America Tall Oil Rosin Industry Revenue (million), by Application 2025 & 2033
- Figure 9: North America Tall Oil Rosin Industry Revenue Share (%), by Application 2025 & 2033
- Figure 10: North America Tall Oil Rosin Industry Revenue (million), by End-user Industry 2025 & 2033
- Figure 11: North America Tall Oil Rosin Industry Revenue Share (%), by End-user Industry 2025 & 2033
- Figure 12: North America Tall Oil Rosin Industry Revenue (million), by Country 2025 & 2033
- Figure 13: North America Tall Oil Rosin Industry Revenue Share (%), by Country 2025 & 2033
- Figure 14: Europe Tall Oil Rosin Industry Revenue (million), by Application 2025 & 2033
- Figure 15: Europe Tall Oil Rosin Industry Revenue Share (%), by Application 2025 & 2033
- Figure 16: Europe Tall Oil Rosin Industry Revenue (million), by End-user Industry 2025 & 2033
- Figure 17: Europe Tall Oil Rosin Industry Revenue Share (%), by End-user Industry 2025 & 2033
- Figure 18: Europe Tall Oil Rosin Industry Revenue (million), by Country 2025 & 2033
- Figure 19: Europe Tall Oil Rosin Industry Revenue Share (%), by Country 2025 & 2033
- Figure 20: South America Tall Oil Rosin Industry Revenue (million), by Application 2025 & 2033
- Figure 21: South America Tall Oil Rosin Industry Revenue Share (%), by Application 2025 & 2033
- Figure 22: South America Tall Oil Rosin Industry Revenue (million), by End-user Industry 2025 & 2033
- Figure 23: South America Tall Oil Rosin Industry Revenue Share (%), by End-user Industry 2025 & 2033
- Figure 24: South America Tall Oil Rosin Industry Revenue (million), by Country 2025 & 2033
- Figure 25: South America Tall Oil Rosin Industry Revenue Share (%), by Country 2025 & 2033
- Figure 26: Middle East and Africa Tall Oil Rosin Industry Revenue (million), by Application 2025 & 2033
- Figure 27: Middle East and Africa Tall Oil Rosin Industry Revenue Share (%), by Application 2025 & 2033
- Figure 28: Middle East and Africa Tall Oil Rosin Industry Revenue (million), by End-user Industry 2025 & 2033
- Figure 29: Middle East and Africa Tall Oil Rosin Industry Revenue Share (%), by End-user Industry 2025 & 2033
- Figure 30: Middle East and Africa Tall Oil Rosin Industry Revenue (million), by Country 2025 & 2033
- Figure 31: Middle East and Africa Tall Oil Rosin Industry Revenue Share (%), by Country 2025 & 2033
List of Tables
- Table 1: Global Tall Oil Rosin Industry Revenue million Forecast, by Application 2020 & 2033
- Table 2: Global Tall Oil Rosin Industry Revenue million Forecast, by End-user Industry 2020 & 2033
- Table 3: Global Tall Oil Rosin Industry Revenue million Forecast, by Region 2020 & 2033
- Table 4: Global Tall Oil Rosin Industry Revenue million Forecast, by Application 2020 & 2033
- Table 5: Global Tall Oil Rosin Industry Revenue million Forecast, by End-user Industry 2020 & 2033
- Table 6: Global Tall Oil Rosin Industry Revenue million Forecast, by Country 2020 & 2033
- Table 7: China Tall Oil Rosin Industry Revenue (million) Forecast, by Application 2020 & 2033
- Table 8: India Tall Oil Rosin Industry Revenue (million) Forecast, by Application 2020 & 2033
- Table 9: Japan Tall Oil Rosin Industry Revenue (million) Forecast, by Application 2020 & 2033
- Table 10: South Korea Tall Oil Rosin Industry Revenue (million) Forecast, by Application 2020 & 2033
- Table 11: Rest of Asia Pacific Tall Oil Rosin Industry Revenue (million) Forecast, by Application 2020 & 2033
- Table 12: Global Tall Oil Rosin Industry Revenue million Forecast, by Application 2020 & 2033
- Table 13: Global Tall Oil Rosin Industry Revenue million Forecast, by End-user Industry 2020 & 2033
- Table 14: Global Tall Oil Rosin Industry Revenue million Forecast, by Country 2020 & 2033
- Table 15: United States Tall Oil Rosin Industry Revenue (million) Forecast, by Application 2020 & 2033
- Table 16: Canada Tall Oil Rosin Industry Revenue (million) Forecast, by Application 2020 & 2033
- Table 17: Mexico Tall Oil Rosin Industry Revenue (million) Forecast, by Application 2020 & 2033
- Table 18: Global Tall Oil Rosin Industry Revenue million Forecast, by Application 2020 & 2033
- Table 19: Global Tall Oil Rosin Industry Revenue million Forecast, by End-user Industry 2020 & 2033
- Table 20: Global Tall Oil Rosin Industry Revenue million Forecast, by Country 2020 & 2033
- Table 21: Germany Tall Oil Rosin Industry Revenue (million) Forecast, by Application 2020 & 2033
- Table 22: United Kingdom Tall Oil Rosin Industry Revenue (million) Forecast, by Application 2020 & 2033
- Table 23: Italy Tall Oil Rosin Industry Revenue (million) Forecast, by Application 2020 & 2033
- Table 24: France Tall Oil Rosin Industry Revenue (million) Forecast, by Application 2020 & 2033
- Table 25: Rest of Europe Tall Oil Rosin Industry Revenue (million) Forecast, by Application 2020 & 2033
- Table 26: Global Tall Oil Rosin Industry Revenue million Forecast, by Application 2020 & 2033
- Table 27: Global Tall Oil Rosin Industry Revenue million Forecast, by End-user Industry 2020 & 2033
- Table 28: Global Tall Oil Rosin Industry Revenue million Forecast, by Country 2020 & 2033
- Table 29: Brazil Tall Oil Rosin Industry Revenue (million) Forecast, by Application 2020 & 2033
- Table 30: Argentina Tall Oil Rosin Industry Revenue (million) Forecast, by Application 2020 & 2033
- Table 31: Rest of South America Tall Oil Rosin Industry Revenue (million) Forecast, by Application 2020 & 2033
- Table 32: Global Tall Oil Rosin Industry Revenue million Forecast, by Application 2020 & 2033
- Table 33: Global Tall Oil Rosin Industry Revenue million Forecast, by End-user Industry 2020 & 2033
- Table 34: Global Tall Oil Rosin Industry Revenue million Forecast, by Country 2020 & 2033
- Table 35: Saudi Arabia Tall Oil Rosin Industry Revenue (million) Forecast, by Application 2020 & 2033
- Table 36: South Africa Tall Oil Rosin Industry Revenue (million) Forecast, by Application 2020 & 2033
- Table 37: Rest of Middle East and Africa Tall Oil Rosin Industry Revenue (million) Forecast, by Application 2020 & 2033
Frequently Asked Questions
1. What is the projected Compound Annual Growth Rate (CAGR) of the Tall Oil Rosin Industry?
The projected CAGR is approximately 4.1%.
2. Which companies are prominent players in the Tall Oil Rosin Industry?
Key companies in the market include Eastman Chemical Company, Florachem Corp, Forchem Oyj, Foreverest Resources Ltd, Harima Chemicals Group Inc, Ilim Group, Ingevity Corporation, Kraton Corporation, OOO Torgoviy Dom Lesokhimik, Pine Chemical Group, Segezha-Group, Songchuan Pine Chemicals Co Ltd, Stora Enso*List Not Exhaustive.
3. What are the main segments of the Tall Oil Rosin Industry?
The market segments include Application, End-user Industry.
4. Can you provide details about the market size?
The market size is estimated to be USD 709.2 million as of 2022.
5. What are some drivers contributing to market growth?
Growing Need for Renewable Rosins; Increasing Demand for Cost-effective & Vegetarian-friendly Products.
6. What are the notable trends driving market growth?
Increasing Usage in the Pulp and Paper Industry.
7. Are there any restraints impacting market growth?
Growing Need for Renewable Rosins; Increasing Demand for Cost-effective & Vegetarian-friendly Products.
8. Can you provide examples of recent developments in the market?
In September 2022, Ingevity Corporation announced a general price increase for tall oil fatty acid and distilled tall oil products and derivatives, also for rosin-based resins associated with its industrial specialties portfolio.
9. What pricing options are available for accessing the report?
Pricing options include single-user, multi-user, and enterprise licenses priced at USD 4750, USD 5250, and USD 8750 respectively.
10. Is the market size provided in terms of value or volume?
The market size is provided in terms of value, measured in million.
11. Are there any specific market keywords associated with the report?
Yes, the market keyword associated with the report is "Tall Oil Rosin Industry," which aids in identifying and referencing the specific market segment covered.
12. How do I determine which pricing option suits my needs best?
The pricing options vary based on user requirements and access needs. Individual users may opt for single-user licenses, while businesses requiring broader access may choose multi-user or enterprise licenses for cost-effective access to the report.
13. Are there any additional resources or data provided in the Tall Oil Rosin Industry report?
While the report offers comprehensive insights, it's advisable to review the specific contents or supplementary materials provided to ascertain if additional resources or data are available.
14. How can I stay updated on further developments or reports in the Tall Oil Rosin Industry?
To stay informed about further developments, trends, and reports in the Tall Oil Rosin Industry, consider subscribing to industry newsletters, following relevant companies and organizations, or regularly checking reputable industry news sources and publications.
Methodology
Step 1 - Identification of Relevant Samples Size from Population Database


Step 2 - Approaches for Defining Global Market Size (Value, Volume* & Price*)

Note*: In applicable scenarios
Step 3 - Data Sources
Primary Research
- Web Analytics
- Survey Reports
- Research Institute
- Latest Research Reports
- Opinion Leaders
Secondary Research
- Annual Reports
- White Paper
- Latest Press Release
- Industry Association
- Paid Database
- Investor Presentations

Step 4 - Data Triangulation
Involves using different sources of information in order to increase the validity of a study
These sources are likely to be stakeholders in a program - participants, other researchers, program staff, other community members, and so on.
Then we put all data in single framework & apply various statistical tools to find out the dynamic on the market.
During the analysis stage, feedback from the stakeholder groups would be compared to determine areas of agreement as well as areas of divergence