
Key Insights
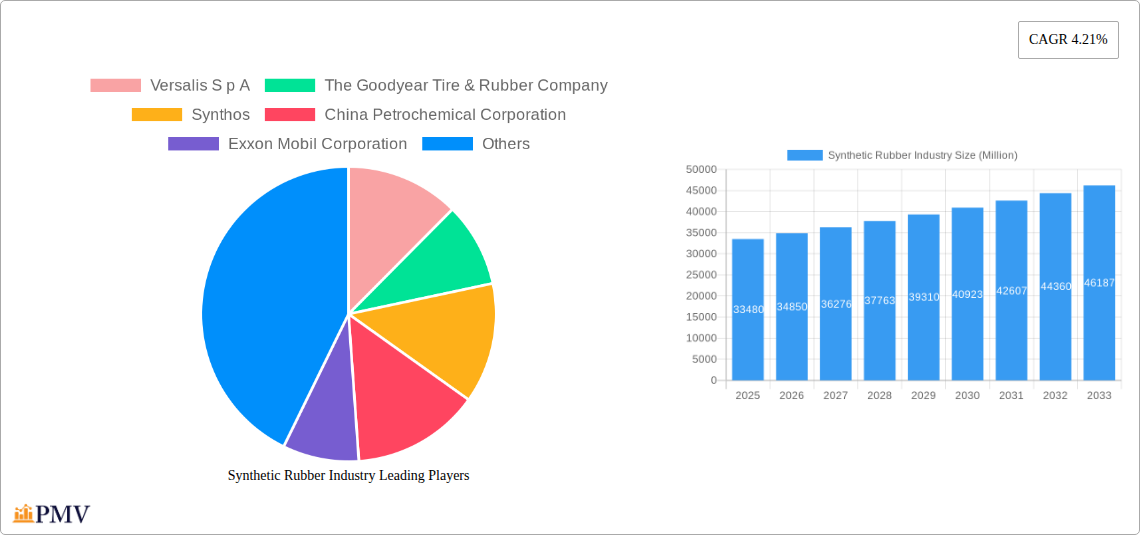
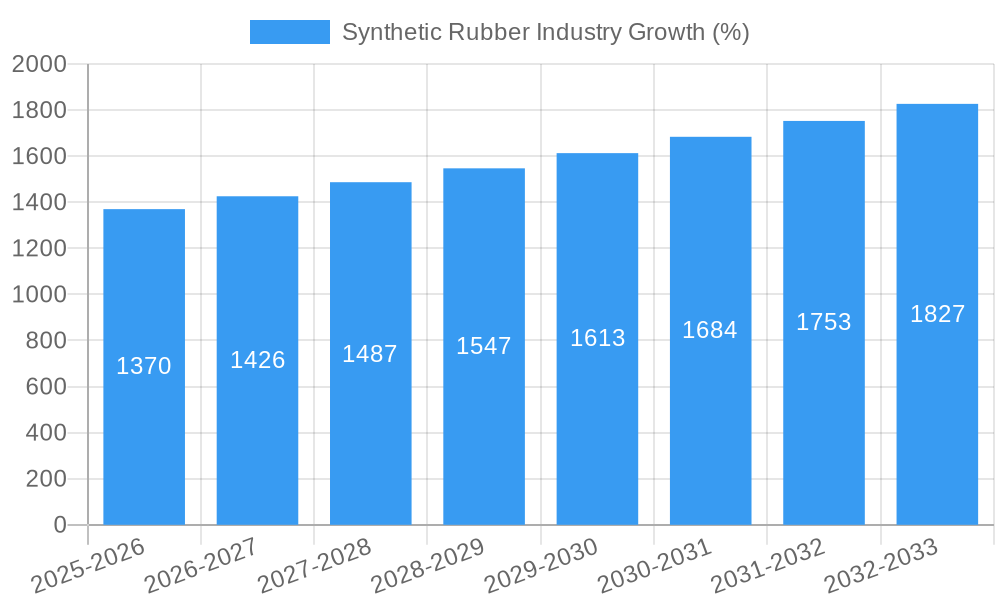
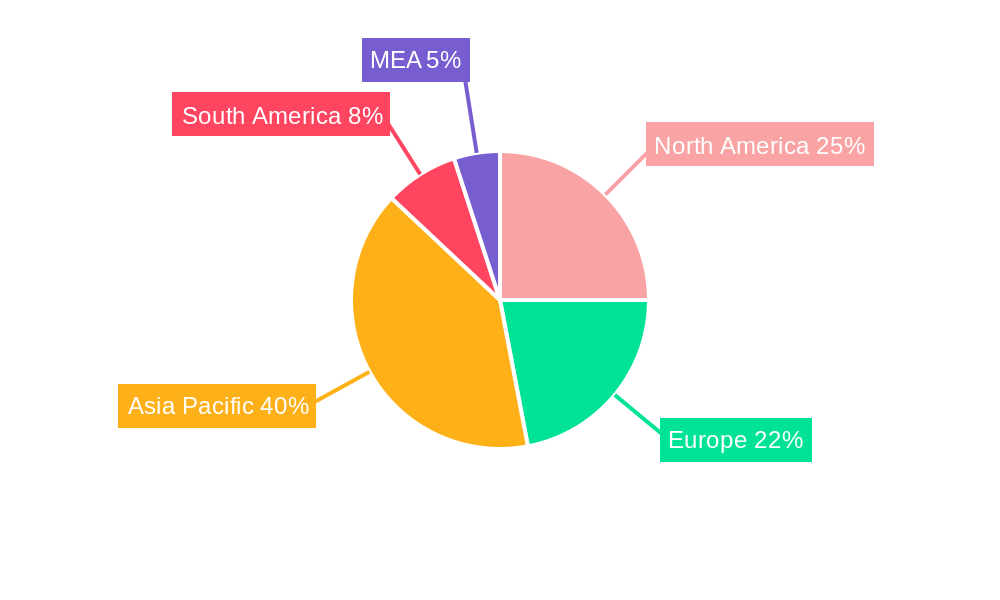
The global synthetic rubber market, valued at $33.48 billion in 2025, is projected to experience robust growth, driven by increasing demand from the automotive and tire industries. A compound annual growth rate (CAGR) of 4.21% from 2025 to 2033 indicates a significant expansion, fueled by factors such as rising vehicle production, particularly in developing economies, and the growing preference for high-performance tires. Technological advancements in synthetic rubber formulations, leading to improved durability, fuel efficiency, and grip, are further bolstering market growth. The tire and tire components segment dominates the application landscape, followed by non-tire automotive applications like seals and hoses. However, the increasing adoption of electric vehicles, while presenting a long-term opportunity, might slightly impact short-term demand for certain types of synthetic rubber used in traditional internal combustion engine vehicles. Furthermore, fluctuations in raw material prices, particularly for petroleum-based feedstocks, and stringent environmental regulations pose challenges to the industry's sustainable expansion. Regional growth is expected to be diverse, with Asia-Pacific, driven by robust automotive production in China and India, anticipated to be a key growth engine. North America and Europe are expected to maintain steady growth, benefiting from technological advancements and established automotive industries. The competitive landscape is characterized by several major players, including Versalis S.p.A., Goodyear, Synthos, and others, focusing on innovation, strategic partnerships, and geographical expansion to secure market share.
The market segmentation reveals key opportunities. Styrene Butadiene Rubber (SBR) and Ethylene Propylene Diene Rubber (EPDM) currently hold significant market shares due to their versatility and wide applications across various sectors. However, the increasing demand for specialized rubbers with enhanced properties, such as high temperature resistance and improved durability, is driving growth in segments like Polybutadiene Rubber (BR) and Isobutylene Isoprene Rubber (IIR). Manufacturers are investing heavily in research and development to improve the performance and sustainability of synthetic rubber products, focusing on bio-based alternatives and reducing environmental impact. This trend is further expected to shape future market growth and attract new entrants. The ongoing geopolitical situations and supply chain disruptions present both risks and opportunities for companies to develop robust and resilient strategies to maintain their position in the market.
Synthetic Rubber Industry Market Report: 2019-2033
This comprehensive report provides an in-depth analysis of the global synthetic rubber market, offering valuable insights for businesses and investors seeking to navigate this dynamic industry. Covering the period from 2019 to 2033, with a focus on 2025, this report meticulously examines market structure, competitive dynamics, emerging trends, and key growth drivers. The report segments the market by type (Styrene Butadiene Rubber (SBR), Ethylene Propylenediene Rubber (EPDM), Polyisoprene (IR), Polybutadiene Rubber (BR), Isobutylene Isoprene Rubber (IIR), Other Types) and application (Tire and Tire Components, Non-tire Automobile Applications, Footwear, Industrial Goods, Other Applications), providing granular data and projections for each segment. Key players like Versalis S p A, Goodyear, Synthos, and others are analyzed, highlighting their market share and strategic initiatives.
Synthetic Rubber Industry Market Structure & Competitive Dynamics
The global synthetic rubber market is characterized by a moderately concentrated structure, with several major players holding significant market share. Innovation is a key driver, with companies investing heavily in R&D to develop new products with enhanced properties like eco-friendly solutions. Regulatory frameworks, particularly those related to environmental protection and safety, significantly impact market dynamics. Product substitutes, such as natural rubber, pose some competitive pressure, while increasing demand from end-user industries like automotive and construction fuels market growth. M&A activities play a crucial role in shaping the competitive landscape. For example, Saudi Aramco's acquisition of Valvoline (USD 2.65 Billion) in March 2023 demonstrates strategic consolidation in the automotive supply chain. Several key metrics are tracked, including market share (xx% for top 5 players in 2025) and M&A deal values exceeding USD xx Billion cumulatively during the historical period.
- Market Concentration: Moderately concentrated with top 5 players holding approximately xx% of market share in 2025.
- Innovation Ecosystems: Strong emphasis on R&D, focusing on eco-friendly and high-performance materials.
- Regulatory Frameworks: Stringent environmental regulations drive demand for sustainable synthetic rubbers.
- Product Substitutes: Natural rubber continues to compete, albeit with limitations in certain applications.
- End-User Trends: Growing demand from automotive, construction, and industrial sectors.
- M&A Activities: Significant M&A activity reshaping the industry landscape (e.g., Aramco's acquisition of Valvoline).
Synthetic Rubber Industry Industry Trends & Insights
The synthetic rubber market is experiencing robust growth, driven by the increasing demand from various end-use sectors. The automotive industry, especially the surge in electric vehicle (EV) production, is a major contributor to this growth. Technological advancements, such as the development of eco-friendly synthetic rubbers, are further propelling market expansion. Consumer preferences are increasingly shifting towards sustainable and high-performance products, influencing manufacturers' strategies. The market is witnessing the introduction of innovative materials, including high-cis polybutadiene (NdBR) and lithium butadiene rubber (LiBR), indicative of a commitment to technological disruption and diversification. The market is projected to witness a CAGR of xx% during the forecast period (2025-2033), with significant market penetration in emerging economies. Competitive dynamics involve both price competition and differentiation through product innovation and sustainability initiatives.
Dominant Markets & Segments in Synthetic Rubber Industry
The Asia-Pacific region, especially China, holds a dominant position in the synthetic rubber market, driven by rapid industrialization, robust infrastructure development, and a growing automotive sector. Within the segments, Styrene Butadiene Rubber (SBR) maintains the largest market share, accounting for approximately xx% in 2025, owing to its widespread applications in tire manufacturing. The tire and tire component segment leads the application-based classification, capturing a significant portion of market demand.
- Leading Region: Asia-Pacific (China, primarily).
- Leading Type Segment: Styrene Butadiene Rubber (SBR).
- Leading Application Segment: Tire and Tire Components.
Key Drivers (Bullet Points):
- Strong economic growth in developing nations.
- Expanding automotive and construction industries.
- Favorable government policies promoting infrastructure development.
Synthetic Rubber Industry Product Innovations
Recent product innovations include eco-solution-polymerized styrene-butadiene rubber (eco-SSBR) aimed at enhancing tire sustainability. Advancements in halobutyl rubber (HBR) capacity upgrades, as seen in SIBUR's investment, highlight the focus on high-performance materials. These developments are driven by environmental concerns, stringent regulations, and the demand for enhanced performance characteristics in various applications. The market fit for these new products is strong, reflecting the growing preference for sustainable, high-performance materials.
Report Segmentation & Scope
The report offers a comprehensive segmentation of the synthetic rubber market based on type and application. The type segment comprises SBR, EPDM, IR, BR, IIR, and others, each analyzed for growth projections, market size, and competitive landscape. Similarly, the application segment includes tire and tire components, non-tire automotive applications, footwear, industrial goods, and others, each with detailed market analysis. Specific growth projections and market sizes will vary based on sub-segment and are available in the full report.
Key Drivers of Synthetic Rubber Industry Growth
The growth of the synthetic rubber industry is driven by factors including rising demand from the automotive sector (especially tires and non-tire applications), the construction industry (e.g., seals, membranes), and the footwear industry. Technological advancements, leading to the development of high-performance and eco-friendly rubbers, also contribute significantly. Government regulations promoting sustainable materials are driving innovation and market expansion. The expanding global economy provides a favorable backdrop for market growth.
Challenges in the Synthetic Rubber Industry Sector
Challenges in the synthetic rubber industry include fluctuating raw material prices, volatility in the global economy, and increasing competition from both synthetic and natural rubber substitutes. Supply chain disruptions and environmental regulations present additional complexities for manufacturers. These factors impact profitability and require strategic responses from industry players to mitigate potential risks. The impact of these challenges is estimated to reduce the market growth rate by approximately xx percentage points in certain years during the forecast period.
Leading Players in the Synthetic Rubber Industry Market
- Versalis S p A
- The Goodyear Tire & Rubber Company
- Synthos
- China Petrochemical Corporation
- Exxon Mobil Corporation
- Mitsubishi Chemical Corporation
- Reliance Industries Limited
- ENEOS Corporation
- LANXESS
- SIBUR
- SABIC
- LG Chem
- Saudi Arabian Oil Co
- Dow
- Apcotex
- Kumho Petrochemical
- TSRC
Key Developments in Synthetic Rubber Industry Sector
- December 2023: SIBUR's Nizhnekamskneftekhim upgrades HBR capacity from 150 to 200 kilotons (USD 85.5 Million investment).
- May 2023: Arlanxeo plans a new rubber production plant in Jubail, Saudi Arabia (140,000 metric tons annual capacity).
- May 2023: Hankook Tire and Kumho Petrochemical collaborate on eco-SSBR for environmentally friendly tires.
- April 2023: Sinopec launches SBC production in Hainan, China (170,000 tons annual capacity).
- March 2023: Saudi Aramco acquires Valvoline Inc. for USD 2.65 Billion.
- December 2022: Kumho Petrochemical plans SSBR capacity expansion to 123 kilotons per annum.
Strategic Synthetic Rubber Industry Market Outlook
The synthetic rubber market is poised for continued growth, driven by technological advancements, expanding applications, and the increasing focus on sustainability. Strategic opportunities exist for companies investing in R&D, focusing on eco-friendly materials, and expanding into high-growth markets. The increasing demand for specialized synthetic rubbers, such as those used in high-performance tires and advanced automotive applications, will shape future market dynamics. This presents a strong case for continued investment and innovation within this dynamic industry sector.
Synthetic Rubber Industry Segmentation
-
1. Type
- 1.1. Styrene Butadiene Rubber (SBR)
- 1.2. Ethylene Propylenediene Rubber (EPDM)
- 1.3. Polyisoprene (IR)
- 1.4. Polybutadiene Rubber (BR)
- 1.5. Isobutylene Isoprene Rubber (IIR)
- 1.6. Other Types
-
2. Application
- 2.1. Tire and Tire Components
- 2.2. Non-tire Automobile Applications
- 2.3. Footwear
- 2.4. Industrial Goods
- 2.5. Other Applications
Synthetic Rubber Industry Segmentation By Geography
-
1. Asia Pacific
- 1.1. China
- 1.2. India
- 1.3. Japan
- 1.4. South Korea
- 1.5. Malaysia
- 1.6. Thailand
- 1.7. Vietnam
- 1.8. Indonesia
- 1.9. Rest of Asia Pacific
-
2. North America
- 2.1. United States
- 2.2. Canada
- 2.3. Mexico
-
3. Europe
- 3.1. Germany
- 3.2. United Kingdom
- 3.3. France
- 3.4. Italy
- 3.5. Spain
- 3.6. Russia
- 3.7. NORDIC
- 3.8. Turkey
- 3.9. Rest of Europe
-
4. South America
- 4.1. Brazil
- 4.2. Argentina
- 4.3. Colombia
- 4.4. Rest of South America
-
5. Middle East and Africa
- 5.1. Saudi Arabia
- 5.2. South Africa
- 5.3. United Arab Emirates
- 5.4. Nigeria
- 5.5. Qatar
- 5.6. Egypt
- 5.7. Rest of Middle East and Africa
Synthetic Rubber Industry REPORT HIGHLIGHTS
| Aspects | Details |
|---|---|
| Study Period | 2019-2033 |
| Base Year | 2024 |
| Estimated Year | 2025 |
| Forecast Period | 2025-2033 |
| Historical Period | 2019-2024 |
| Growth Rate | CAGR of 4.21% from 2019-2033 |
| Segmentation |
|
Table of Contents
- 1. Introduction
- 1.1. Research Scope
- 1.2. Market Segmentation
- 1.3. Research Methodology
- 1.4. Definitions and Assumptions
- 2. Executive Summary
- 2.1. Introduction
- 3. Market Dynamics
- 3.1. Introduction
- 3.2. Market Drivers
- 3.2.1. Increasing Demand from Rising Sales of Electric Vehicles; Other Drivers
- 3.3. Market Restrains
- 3.3.1. Replacement of Rubber by Polyurethanes in Some Applications; Other Restraints
- 3.4. Market Trends
- 3.4.1. Increasing Demand From Tire and Tire Components
- 4. Market Factor Analysis
- 4.1. Porters Five Forces
- 4.2. Supply/Value Chain
- 4.3. PESTEL analysis
- 4.4. Market Entropy
- 4.5. Patent/Trademark Analysis
- 5. Global Synthetic Rubber Industry Analysis, Insights and Forecast, 2019-2031
- 5.1. Market Analysis, Insights and Forecast - by Type
- 5.1.1. Styrene Butadiene Rubber (SBR)
- 5.1.2. Ethylene Propylenediene Rubber (EPDM)
- 5.1.3. Polyisoprene (IR)
- 5.1.4. Polybutadiene Rubber (BR)
- 5.1.5. Isobutylene Isoprene Rubber (IIR)
- 5.1.6. Other Types
- 5.2. Market Analysis, Insights and Forecast - by Application
- 5.2.1. Tire and Tire Components
- 5.2.2. Non-tire Automobile Applications
- 5.2.3. Footwear
- 5.2.4. Industrial Goods
- 5.2.5. Other Applications
- 5.3. Market Analysis, Insights and Forecast - by Region
- 5.3.1. Asia Pacific
- 5.3.2. North America
- 5.3.3. Europe
- 5.3.4. South America
- 5.3.5. Middle East and Africa
- 5.1. Market Analysis, Insights and Forecast - by Type
- 6. Asia Pacific Synthetic Rubber Industry Analysis, Insights and Forecast, 2019-2031
- 6.1. Market Analysis, Insights and Forecast - by Type
- 6.1.1. Styrene Butadiene Rubber (SBR)
- 6.1.2. Ethylene Propylenediene Rubber (EPDM)
- 6.1.3. Polyisoprene (IR)
- 6.1.4. Polybutadiene Rubber (BR)
- 6.1.5. Isobutylene Isoprene Rubber (IIR)
- 6.1.6. Other Types
- 6.2. Market Analysis, Insights and Forecast - by Application
- 6.2.1. Tire and Tire Components
- 6.2.2. Non-tire Automobile Applications
- 6.2.3. Footwear
- 6.2.4. Industrial Goods
- 6.2.5. Other Applications
- 6.1. Market Analysis, Insights and Forecast - by Type
- 7. North America Synthetic Rubber Industry Analysis, Insights and Forecast, 2019-2031
- 7.1. Market Analysis, Insights and Forecast - by Type
- 7.1.1. Styrene Butadiene Rubber (SBR)
- 7.1.2. Ethylene Propylenediene Rubber (EPDM)
- 7.1.3. Polyisoprene (IR)
- 7.1.4. Polybutadiene Rubber (BR)
- 7.1.5. Isobutylene Isoprene Rubber (IIR)
- 7.1.6. Other Types
- 7.2. Market Analysis, Insights and Forecast - by Application
- 7.2.1. Tire and Tire Components
- 7.2.2. Non-tire Automobile Applications
- 7.2.3. Footwear
- 7.2.4. Industrial Goods
- 7.2.5. Other Applications
- 7.1. Market Analysis, Insights and Forecast - by Type
- 8. Europe Synthetic Rubber Industry Analysis, Insights and Forecast, 2019-2031
- 8.1. Market Analysis, Insights and Forecast - by Type
- 8.1.1. Styrene Butadiene Rubber (SBR)
- 8.1.2. Ethylene Propylenediene Rubber (EPDM)
- 8.1.3. Polyisoprene (IR)
- 8.1.4. Polybutadiene Rubber (BR)
- 8.1.5. Isobutylene Isoprene Rubber (IIR)
- 8.1.6. Other Types
- 8.2. Market Analysis, Insights and Forecast - by Application
- 8.2.1. Tire and Tire Components
- 8.2.2. Non-tire Automobile Applications
- 8.2.3. Footwear
- 8.2.4. Industrial Goods
- 8.2.5. Other Applications
- 8.1. Market Analysis, Insights and Forecast - by Type
- 9. South America Synthetic Rubber Industry Analysis, Insights and Forecast, 2019-2031
- 9.1. Market Analysis, Insights and Forecast - by Type
- 9.1.1. Styrene Butadiene Rubber (SBR)
- 9.1.2. Ethylene Propylenediene Rubber (EPDM)
- 9.1.3. Polyisoprene (IR)
- 9.1.4. Polybutadiene Rubber (BR)
- 9.1.5. Isobutylene Isoprene Rubber (IIR)
- 9.1.6. Other Types
- 9.2. Market Analysis, Insights and Forecast - by Application
- 9.2.1. Tire and Tire Components
- 9.2.2. Non-tire Automobile Applications
- 9.2.3. Footwear
- 9.2.4. Industrial Goods
- 9.2.5. Other Applications
- 9.1. Market Analysis, Insights and Forecast - by Type
- 10. Middle East and Africa Synthetic Rubber Industry Analysis, Insights and Forecast, 2019-2031
- 10.1. Market Analysis, Insights and Forecast - by Type
- 10.1.1. Styrene Butadiene Rubber (SBR)
- 10.1.2. Ethylene Propylenediene Rubber (EPDM)
- 10.1.3. Polyisoprene (IR)
- 10.1.4. Polybutadiene Rubber (BR)
- 10.1.5. Isobutylene Isoprene Rubber (IIR)
- 10.1.6. Other Types
- 10.2. Market Analysis, Insights and Forecast - by Application
- 10.2.1. Tire and Tire Components
- 10.2.2. Non-tire Automobile Applications
- 10.2.3. Footwear
- 10.2.4. Industrial Goods
- 10.2.5. Other Applications
- 10.1. Market Analysis, Insights and Forecast - by Type
- 11. North America Synthetic Rubber Industry Analysis, Insights and Forecast, 2019-2031
- 11.1. Market Analysis, Insights and Forecast - By Country/Sub-region
- 11.1.1 United States
- 11.1.2 Canada
- 11.1.3 Mexico
- 12. Europe Synthetic Rubber Industry Analysis, Insights and Forecast, 2019-2031
- 12.1. Market Analysis, Insights and Forecast - By Country/Sub-region
- 12.1.1 Germany
- 12.1.2 France
- 12.1.3 Italy
- 12.1.4 United Kingdom
- 12.1.5 Netherlands
- 12.1.6 Rest of Europe
- 13. Asia Pacific Synthetic Rubber Industry Analysis, Insights and Forecast, 2019-2031
- 13.1. Market Analysis, Insights and Forecast - By Country/Sub-region
- 13.1.1 China
- 13.1.2 Japan
- 13.1.3 India
- 13.1.4 South Korea
- 13.1.5 Taiwan
- 13.1.6 Australia
- 13.1.7 Rest of Asia-Pacific
- 14. South America Synthetic Rubber Industry Analysis, Insights and Forecast, 2019-2031
- 14.1. Market Analysis, Insights and Forecast - By Country/Sub-region
- 14.1.1 Brazil
- 14.1.2 Argentina
- 14.1.3 Rest of South America
- 15. MEA Synthetic Rubber Industry Analysis, Insights and Forecast, 2019-2031
- 15.1. Market Analysis, Insights and Forecast - By Country/Sub-region
- 15.1.1 Middle East
- 15.1.2 Africa
- 16. Competitive Analysis
- 16.1. Global Market Share Analysis 2024
- 16.2. Company Profiles
- 16.2.1 Versalis S p A
- 16.2.1.1. Overview
- 16.2.1.2. Products
- 16.2.1.3. SWOT Analysis
- 16.2.1.4. Recent Developments
- 16.2.1.5. Financials (Based on Availability)
- 16.2.2 The Goodyear Tire & Rubber Company
- 16.2.2.1. Overview
- 16.2.2.2. Products
- 16.2.2.3. SWOT Analysis
- 16.2.2.4. Recent Developments
- 16.2.2.5. Financials (Based on Availability)
- 16.2.3 Synthos
- 16.2.3.1. Overview
- 16.2.3.2. Products
- 16.2.3.3. SWOT Analysis
- 16.2.3.4. Recent Developments
- 16.2.3.5. Financials (Based on Availability)
- 16.2.4 China Petrochemical Corporation
- 16.2.4.1. Overview
- 16.2.4.2. Products
- 16.2.4.3. SWOT Analysis
- 16.2.4.4. Recent Developments
- 16.2.4.5. Financials (Based on Availability)
- 16.2.5 Exxon Mobil Corporation
- 16.2.5.1. Overview
- 16.2.5.2. Products
- 16.2.5.3. SWOT Analysis
- 16.2.5.4. Recent Developments
- 16.2.5.5. Financials (Based on Availability)
- 16.2.6 Mitsubishi Chemical Corporation
- 16.2.6.1. Overview
- 16.2.6.2. Products
- 16.2.6.3. SWOT Analysis
- 16.2.6.4. Recent Developments
- 16.2.6.5. Financials (Based on Availability)
- 16.2.7 Reliance Industries Limited
- 16.2.7.1. Overview
- 16.2.7.2. Products
- 16.2.7.3. SWOT Analysis
- 16.2.7.4. Recent Developments
- 16.2.7.5. Financials (Based on Availability)
- 16.2.8 ENEOS Corporation
- 16.2.8.1. Overview
- 16.2.8.2. Products
- 16.2.8.3. SWOT Analysis
- 16.2.8.4. Recent Developments
- 16.2.8.5. Financials (Based on Availability)
- 16.2.9 LANXESS
- 16.2.9.1. Overview
- 16.2.9.2. Products
- 16.2.9.3. SWOT Analysis
- 16.2.9.4. Recent Developments
- 16.2.9.5. Financials (Based on Availability)
- 16.2.10 SIBUR
- 16.2.10.1. Overview
- 16.2.10.2. Products
- 16.2.10.3. SWOT Analysis
- 16.2.10.4. Recent Developments
- 16.2.10.5. Financials (Based on Availability)
- 16.2.11 SABIC
- 16.2.11.1. Overview
- 16.2.11.2. Products
- 16.2.11.3. SWOT Analysis
- 16.2.11.4. Recent Developments
- 16.2.11.5. Financials (Based on Availability)
- 16.2.12 LG Chem
- 16.2.12.1. Overview
- 16.2.12.2. Products
- 16.2.12.3. SWOT Analysis
- 16.2.12.4. Recent Developments
- 16.2.12.5. Financials (Based on Availability)
- 16.2.13 Saudi Arabian Oil Co
- 16.2.13.1. Overview
- 16.2.13.2. Products
- 16.2.13.3. SWOT Analysis
- 16.2.13.4. Recent Developments
- 16.2.13.5. Financials (Based on Availability)
- 16.2.14 Dow
- 16.2.14.1. Overview
- 16.2.14.2. Products
- 16.2.14.3. SWOT Analysis
- 16.2.14.4. Recent Developments
- 16.2.14.5. Financials (Based on Availability)
- 16.2.15 Apcotex
- 16.2.15.1. Overview
- 16.2.15.2. Products
- 16.2.15.3. SWOT Analysis
- 16.2.15.4. Recent Developments
- 16.2.15.5. Financials (Based on Availability)
- 16.2.16 Kumho Petrochemical
- 16.2.16.1. Overview
- 16.2.16.2. Products
- 16.2.16.3. SWOT Analysis
- 16.2.16.4. Recent Developments
- 16.2.16.5. Financials (Based on Availability)
- 16.2.17 TSRC
- 16.2.17.1. Overview
- 16.2.17.2. Products
- 16.2.17.3. SWOT Analysis
- 16.2.17.4. Recent Developments
- 16.2.17.5. Financials (Based on Availability)
- 16.2.1 Versalis S p A
List of Figures
- Figure 1: Global Synthetic Rubber Industry Revenue Breakdown (Million, %) by Region 2024 & 2032
- Figure 2: Global Synthetic Rubber Industry Volume Breakdown (K Tons, %) by Region 2024 & 2032
- Figure 3: North America Synthetic Rubber Industry Revenue (Million), by Country 2024 & 2032
- Figure 4: North America Synthetic Rubber Industry Volume (K Tons), by Country 2024 & 2032
- Figure 5: North America Synthetic Rubber Industry Revenue Share (%), by Country 2024 & 2032
- Figure 6: North America Synthetic Rubber Industry Volume Share (%), by Country 2024 & 2032
- Figure 7: Europe Synthetic Rubber Industry Revenue (Million), by Country 2024 & 2032
- Figure 8: Europe Synthetic Rubber Industry Volume (K Tons), by Country 2024 & 2032
- Figure 9: Europe Synthetic Rubber Industry Revenue Share (%), by Country 2024 & 2032
- Figure 10: Europe Synthetic Rubber Industry Volume Share (%), by Country 2024 & 2032
- Figure 11: Asia Pacific Synthetic Rubber Industry Revenue (Million), by Country 2024 & 2032
- Figure 12: Asia Pacific Synthetic Rubber Industry Volume (K Tons), by Country 2024 & 2032
- Figure 13: Asia Pacific Synthetic Rubber Industry Revenue Share (%), by Country 2024 & 2032
- Figure 14: Asia Pacific Synthetic Rubber Industry Volume Share (%), by Country 2024 & 2032
- Figure 15: South America Synthetic Rubber Industry Revenue (Million), by Country 2024 & 2032
- Figure 16: South America Synthetic Rubber Industry Volume (K Tons), by Country 2024 & 2032
- Figure 17: South America Synthetic Rubber Industry Revenue Share (%), by Country 2024 & 2032
- Figure 18: South America Synthetic Rubber Industry Volume Share (%), by Country 2024 & 2032
- Figure 19: MEA Synthetic Rubber Industry Revenue (Million), by Country 2024 & 2032
- Figure 20: MEA Synthetic Rubber Industry Volume (K Tons), by Country 2024 & 2032
- Figure 21: MEA Synthetic Rubber Industry Revenue Share (%), by Country 2024 & 2032
- Figure 22: MEA Synthetic Rubber Industry Volume Share (%), by Country 2024 & 2032
- Figure 23: Asia Pacific Synthetic Rubber Industry Revenue (Million), by Type 2024 & 2032
- Figure 24: Asia Pacific Synthetic Rubber Industry Volume (K Tons), by Type 2024 & 2032
- Figure 25: Asia Pacific Synthetic Rubber Industry Revenue Share (%), by Type 2024 & 2032
- Figure 26: Asia Pacific Synthetic Rubber Industry Volume Share (%), by Type 2024 & 2032
- Figure 27: Asia Pacific Synthetic Rubber Industry Revenue (Million), by Application 2024 & 2032
- Figure 28: Asia Pacific Synthetic Rubber Industry Volume (K Tons), by Application 2024 & 2032
- Figure 29: Asia Pacific Synthetic Rubber Industry Revenue Share (%), by Application 2024 & 2032
- Figure 30: Asia Pacific Synthetic Rubber Industry Volume Share (%), by Application 2024 & 2032
- Figure 31: Asia Pacific Synthetic Rubber Industry Revenue (Million), by Country 2024 & 2032
- Figure 32: Asia Pacific Synthetic Rubber Industry Volume (K Tons), by Country 2024 & 2032
- Figure 33: Asia Pacific Synthetic Rubber Industry Revenue Share (%), by Country 2024 & 2032
- Figure 34: Asia Pacific Synthetic Rubber Industry Volume Share (%), by Country 2024 & 2032
- Figure 35: North America Synthetic Rubber Industry Revenue (Million), by Type 2024 & 2032
- Figure 36: North America Synthetic Rubber Industry Volume (K Tons), by Type 2024 & 2032
- Figure 37: North America Synthetic Rubber Industry Revenue Share (%), by Type 2024 & 2032
- Figure 38: North America Synthetic Rubber Industry Volume Share (%), by Type 2024 & 2032
- Figure 39: North America Synthetic Rubber Industry Revenue (Million), by Application 2024 & 2032
- Figure 40: North America Synthetic Rubber Industry Volume (K Tons), by Application 2024 & 2032
- Figure 41: North America Synthetic Rubber Industry Revenue Share (%), by Application 2024 & 2032
- Figure 42: North America Synthetic Rubber Industry Volume Share (%), by Application 2024 & 2032
- Figure 43: North America Synthetic Rubber Industry Revenue (Million), by Country 2024 & 2032
- Figure 44: North America Synthetic Rubber Industry Volume (K Tons), by Country 2024 & 2032
- Figure 45: North America Synthetic Rubber Industry Revenue Share (%), by Country 2024 & 2032
- Figure 46: North America Synthetic Rubber Industry Volume Share (%), by Country 2024 & 2032
- Figure 47: Europe Synthetic Rubber Industry Revenue (Million), by Type 2024 & 2032
- Figure 48: Europe Synthetic Rubber Industry Volume (K Tons), by Type 2024 & 2032
- Figure 49: Europe Synthetic Rubber Industry Revenue Share (%), by Type 2024 & 2032
- Figure 50: Europe Synthetic Rubber Industry Volume Share (%), by Type 2024 & 2032
- Figure 51: Europe Synthetic Rubber Industry Revenue (Million), by Application 2024 & 2032
- Figure 52: Europe Synthetic Rubber Industry Volume (K Tons), by Application 2024 & 2032
- Figure 53: Europe Synthetic Rubber Industry Revenue Share (%), by Application 2024 & 2032
- Figure 54: Europe Synthetic Rubber Industry Volume Share (%), by Application 2024 & 2032
- Figure 55: Europe Synthetic Rubber Industry Revenue (Million), by Country 2024 & 2032
- Figure 56: Europe Synthetic Rubber Industry Volume (K Tons), by Country 2024 & 2032
- Figure 57: Europe Synthetic Rubber Industry Revenue Share (%), by Country 2024 & 2032
- Figure 58: Europe Synthetic Rubber Industry Volume Share (%), by Country 2024 & 2032
- Figure 59: South America Synthetic Rubber Industry Revenue (Million), by Type 2024 & 2032
- Figure 60: South America Synthetic Rubber Industry Volume (K Tons), by Type 2024 & 2032
- Figure 61: South America Synthetic Rubber Industry Revenue Share (%), by Type 2024 & 2032
- Figure 62: South America Synthetic Rubber Industry Volume Share (%), by Type 2024 & 2032
- Figure 63: South America Synthetic Rubber Industry Revenue (Million), by Application 2024 & 2032
- Figure 64: South America Synthetic Rubber Industry Volume (K Tons), by Application 2024 & 2032
- Figure 65: South America Synthetic Rubber Industry Revenue Share (%), by Application 2024 & 2032
- Figure 66: South America Synthetic Rubber Industry Volume Share (%), by Application 2024 & 2032
- Figure 67: South America Synthetic Rubber Industry Revenue (Million), by Country 2024 & 2032
- Figure 68: South America Synthetic Rubber Industry Volume (K Tons), by Country 2024 & 2032
- Figure 69: South America Synthetic Rubber Industry Revenue Share (%), by Country 2024 & 2032
- Figure 70: South America Synthetic Rubber Industry Volume Share (%), by Country 2024 & 2032
- Figure 71: Middle East and Africa Synthetic Rubber Industry Revenue (Million), by Type 2024 & 2032
- Figure 72: Middle East and Africa Synthetic Rubber Industry Volume (K Tons), by Type 2024 & 2032
- Figure 73: Middle East and Africa Synthetic Rubber Industry Revenue Share (%), by Type 2024 & 2032
- Figure 74: Middle East and Africa Synthetic Rubber Industry Volume Share (%), by Type 2024 & 2032
- Figure 75: Middle East and Africa Synthetic Rubber Industry Revenue (Million), by Application 2024 & 2032
- Figure 76: Middle East and Africa Synthetic Rubber Industry Volume (K Tons), by Application 2024 & 2032
- Figure 77: Middle East and Africa Synthetic Rubber Industry Revenue Share (%), by Application 2024 & 2032
- Figure 78: Middle East and Africa Synthetic Rubber Industry Volume Share (%), by Application 2024 & 2032
- Figure 79: Middle East and Africa Synthetic Rubber Industry Revenue (Million), by Country 2024 & 2032
- Figure 80: Middle East and Africa Synthetic Rubber Industry Volume (K Tons), by Country 2024 & 2032
- Figure 81: Middle East and Africa Synthetic Rubber Industry Revenue Share (%), by Country 2024 & 2032
- Figure 82: Middle East and Africa Synthetic Rubber Industry Volume Share (%), by Country 2024 & 2032
List of Tables
- Table 1: Global Synthetic Rubber Industry Revenue Million Forecast, by Region 2019 & 2032
- Table 2: Global Synthetic Rubber Industry Volume K Tons Forecast, by Region 2019 & 2032
- Table 3: Global Synthetic Rubber Industry Revenue Million Forecast, by Type 2019 & 2032
- Table 4: Global Synthetic Rubber Industry Volume K Tons Forecast, by Type 2019 & 2032
- Table 5: Global Synthetic Rubber Industry Revenue Million Forecast, by Application 2019 & 2032
- Table 6: Global Synthetic Rubber Industry Volume K Tons Forecast, by Application 2019 & 2032
- Table 7: Global Synthetic Rubber Industry Revenue Million Forecast, by Region 2019 & 2032
- Table 8: Global Synthetic Rubber Industry Volume K Tons Forecast, by Region 2019 & 2032
- Table 9: Global Synthetic Rubber Industry Revenue Million Forecast, by Country 2019 & 2032
- Table 10: Global Synthetic Rubber Industry Volume K Tons Forecast, by Country 2019 & 2032
- Table 11: United States Synthetic Rubber Industry Revenue (Million) Forecast, by Application 2019 & 2032
- Table 12: United States Synthetic Rubber Industry Volume (K Tons) Forecast, by Application 2019 & 2032
- Table 13: Canada Synthetic Rubber Industry Revenue (Million) Forecast, by Application 2019 & 2032
- Table 14: Canada Synthetic Rubber Industry Volume (K Tons) Forecast, by Application 2019 & 2032
- Table 15: Mexico Synthetic Rubber Industry Revenue (Million) Forecast, by Application 2019 & 2032
- Table 16: Mexico Synthetic Rubber Industry Volume (K Tons) Forecast, by Application 2019 & 2032
- Table 17: Global Synthetic Rubber Industry Revenue Million Forecast, by Country 2019 & 2032
- Table 18: Global Synthetic Rubber Industry Volume K Tons Forecast, by Country 2019 & 2032
- Table 19: Germany Synthetic Rubber Industry Revenue (Million) Forecast, by Application 2019 & 2032
- Table 20: Germany Synthetic Rubber Industry Volume (K Tons) Forecast, by Application 2019 & 2032
- Table 21: France Synthetic Rubber Industry Revenue (Million) Forecast, by Application 2019 & 2032
- Table 22: France Synthetic Rubber Industry Volume (K Tons) Forecast, by Application 2019 & 2032
- Table 23: Italy Synthetic Rubber Industry Revenue (Million) Forecast, by Application 2019 & 2032
- Table 24: Italy Synthetic Rubber Industry Volume (K Tons) Forecast, by Application 2019 & 2032
- Table 25: United Kingdom Synthetic Rubber Industry Revenue (Million) Forecast, by Application 2019 & 2032
- Table 26: United Kingdom Synthetic Rubber Industry Volume (K Tons) Forecast, by Application 2019 & 2032
- Table 27: Netherlands Synthetic Rubber Industry Revenue (Million) Forecast, by Application 2019 & 2032
- Table 28: Netherlands Synthetic Rubber Industry Volume (K Tons) Forecast, by Application 2019 & 2032
- Table 29: Rest of Europe Synthetic Rubber Industry Revenue (Million) Forecast, by Application 2019 & 2032
- Table 30: Rest of Europe Synthetic Rubber Industry Volume (K Tons) Forecast, by Application 2019 & 2032
- Table 31: Global Synthetic Rubber Industry Revenue Million Forecast, by Country 2019 & 2032
- Table 32: Global Synthetic Rubber Industry Volume K Tons Forecast, by Country 2019 & 2032
- Table 33: China Synthetic Rubber Industry Revenue (Million) Forecast, by Application 2019 & 2032
- Table 34: China Synthetic Rubber Industry Volume (K Tons) Forecast, by Application 2019 & 2032
- Table 35: Japan Synthetic Rubber Industry Revenue (Million) Forecast, by Application 2019 & 2032
- Table 36: Japan Synthetic Rubber Industry Volume (K Tons) Forecast, by Application 2019 & 2032
- Table 37: India Synthetic Rubber Industry Revenue (Million) Forecast, by Application 2019 & 2032
- Table 38: India Synthetic Rubber Industry Volume (K Tons) Forecast, by Application 2019 & 2032
- Table 39: South Korea Synthetic Rubber Industry Revenue (Million) Forecast, by Application 2019 & 2032
- Table 40: South Korea Synthetic Rubber Industry Volume (K Tons) Forecast, by Application 2019 & 2032
- Table 41: Taiwan Synthetic Rubber Industry Revenue (Million) Forecast, by Application 2019 & 2032
- Table 42: Taiwan Synthetic Rubber Industry Volume (K Tons) Forecast, by Application 2019 & 2032
- Table 43: Australia Synthetic Rubber Industry Revenue (Million) Forecast, by Application 2019 & 2032
- Table 44: Australia Synthetic Rubber Industry Volume (K Tons) Forecast, by Application 2019 & 2032
- Table 45: Rest of Asia-Pacific Synthetic Rubber Industry Revenue (Million) Forecast, by Application 2019 & 2032
- Table 46: Rest of Asia-Pacific Synthetic Rubber Industry Volume (K Tons) Forecast, by Application 2019 & 2032
- Table 47: Global Synthetic Rubber Industry Revenue Million Forecast, by Country 2019 & 2032
- Table 48: Global Synthetic Rubber Industry Volume K Tons Forecast, by Country 2019 & 2032
- Table 49: Brazil Synthetic Rubber Industry Revenue (Million) Forecast, by Application 2019 & 2032
- Table 50: Brazil Synthetic Rubber Industry Volume (K Tons) Forecast, by Application 2019 & 2032
- Table 51: Argentina Synthetic Rubber Industry Revenue (Million) Forecast, by Application 2019 & 2032
- Table 52: Argentina Synthetic Rubber Industry Volume (K Tons) Forecast, by Application 2019 & 2032
- Table 53: Rest of South America Synthetic Rubber Industry Revenue (Million) Forecast, by Application 2019 & 2032
- Table 54: Rest of South America Synthetic Rubber Industry Volume (K Tons) Forecast, by Application 2019 & 2032
- Table 55: Global Synthetic Rubber Industry Revenue Million Forecast, by Country 2019 & 2032
- Table 56: Global Synthetic Rubber Industry Volume K Tons Forecast, by Country 2019 & 2032
- Table 57: Middle East Synthetic Rubber Industry Revenue (Million) Forecast, by Application 2019 & 2032
- Table 58: Middle East Synthetic Rubber Industry Volume (K Tons) Forecast, by Application 2019 & 2032
- Table 59: Africa Synthetic Rubber Industry Revenue (Million) Forecast, by Application 2019 & 2032
- Table 60: Africa Synthetic Rubber Industry Volume (K Tons) Forecast, by Application 2019 & 2032
- Table 61: Global Synthetic Rubber Industry Revenue Million Forecast, by Type 2019 & 2032
- Table 62: Global Synthetic Rubber Industry Volume K Tons Forecast, by Type 2019 & 2032
- Table 63: Global Synthetic Rubber Industry Revenue Million Forecast, by Application 2019 & 2032
- Table 64: Global Synthetic Rubber Industry Volume K Tons Forecast, by Application 2019 & 2032
- Table 65: Global Synthetic Rubber Industry Revenue Million Forecast, by Country 2019 & 2032
- Table 66: Global Synthetic Rubber Industry Volume K Tons Forecast, by Country 2019 & 2032
- Table 67: China Synthetic Rubber Industry Revenue (Million) Forecast, by Application 2019 & 2032
- Table 68: China Synthetic Rubber Industry Volume (K Tons) Forecast, by Application 2019 & 2032
- Table 69: India Synthetic Rubber Industry Revenue (Million) Forecast, by Application 2019 & 2032
- Table 70: India Synthetic Rubber Industry Volume (K Tons) Forecast, by Application 2019 & 2032
- Table 71: Japan Synthetic Rubber Industry Revenue (Million) Forecast, by Application 2019 & 2032
- Table 72: Japan Synthetic Rubber Industry Volume (K Tons) Forecast, by Application 2019 & 2032
- Table 73: South Korea Synthetic Rubber Industry Revenue (Million) Forecast, by Application 2019 & 2032
- Table 74: South Korea Synthetic Rubber Industry Volume (K Tons) Forecast, by Application 2019 & 2032
- Table 75: Malaysia Synthetic Rubber Industry Revenue (Million) Forecast, by Application 2019 & 2032
- Table 76: Malaysia Synthetic Rubber Industry Volume (K Tons) Forecast, by Application 2019 & 2032
- Table 77: Thailand Synthetic Rubber Industry Revenue (Million) Forecast, by Application 2019 & 2032
- Table 78: Thailand Synthetic Rubber Industry Volume (K Tons) Forecast, by Application 2019 & 2032
- Table 79: Vietnam Synthetic Rubber Industry Revenue (Million) Forecast, by Application 2019 & 2032
- Table 80: Vietnam Synthetic Rubber Industry Volume (K Tons) Forecast, by Application 2019 & 2032
- Table 81: Indonesia Synthetic Rubber Industry Revenue (Million) Forecast, by Application 2019 & 2032
- Table 82: Indonesia Synthetic Rubber Industry Volume (K Tons) Forecast, by Application 2019 & 2032
- Table 83: Rest of Asia Pacific Synthetic Rubber Industry Revenue (Million) Forecast, by Application 2019 & 2032
- Table 84: Rest of Asia Pacific Synthetic Rubber Industry Volume (K Tons) Forecast, by Application 2019 & 2032
- Table 85: Global Synthetic Rubber Industry Revenue Million Forecast, by Type 2019 & 2032
- Table 86: Global Synthetic Rubber Industry Volume K Tons Forecast, by Type 2019 & 2032
- Table 87: Global Synthetic Rubber Industry Revenue Million Forecast, by Application 2019 & 2032
- Table 88: Global Synthetic Rubber Industry Volume K Tons Forecast, by Application 2019 & 2032
- Table 89: Global Synthetic Rubber Industry Revenue Million Forecast, by Country 2019 & 2032
- Table 90: Global Synthetic Rubber Industry Volume K Tons Forecast, by Country 2019 & 2032
- Table 91: United States Synthetic Rubber Industry Revenue (Million) Forecast, by Application 2019 & 2032
- Table 92: United States Synthetic Rubber Industry Volume (K Tons) Forecast, by Application 2019 & 2032
- Table 93: Canada Synthetic Rubber Industry Revenue (Million) Forecast, by Application 2019 & 2032
- Table 94: Canada Synthetic Rubber Industry Volume (K Tons) Forecast, by Application 2019 & 2032
- Table 95: Mexico Synthetic Rubber Industry Revenue (Million) Forecast, by Application 2019 & 2032
- Table 96: Mexico Synthetic Rubber Industry Volume (K Tons) Forecast, by Application 2019 & 2032
- Table 97: Global Synthetic Rubber Industry Revenue Million Forecast, by Type 2019 & 2032
- Table 98: Global Synthetic Rubber Industry Volume K Tons Forecast, by Type 2019 & 2032
- Table 99: Global Synthetic Rubber Industry Revenue Million Forecast, by Application 2019 & 2032
- Table 100: Global Synthetic Rubber Industry Volume K Tons Forecast, by Application 2019 & 2032
- Table 101: Global Synthetic Rubber Industry Revenue Million Forecast, by Country 2019 & 2032
- Table 102: Global Synthetic Rubber Industry Volume K Tons Forecast, by Country 2019 & 2032
- Table 103: Germany Synthetic Rubber Industry Revenue (Million) Forecast, by Application 2019 & 2032
- Table 104: Germany Synthetic Rubber Industry Volume (K Tons) Forecast, by Application 2019 & 2032
- Table 105: United Kingdom Synthetic Rubber Industry Revenue (Million) Forecast, by Application 2019 & 2032
- Table 106: United Kingdom Synthetic Rubber Industry Volume (K Tons) Forecast, by Application 2019 & 2032
- Table 107: France Synthetic Rubber Industry Revenue (Million) Forecast, by Application 2019 & 2032
- Table 108: France Synthetic Rubber Industry Volume (K Tons) Forecast, by Application 2019 & 2032
- Table 109: Italy Synthetic Rubber Industry Revenue (Million) Forecast, by Application 2019 & 2032
- Table 110: Italy Synthetic Rubber Industry Volume (K Tons) Forecast, by Application 2019 & 2032
- Table 111: Spain Synthetic Rubber Industry Revenue (Million) Forecast, by Application 2019 & 2032
- Table 112: Spain Synthetic Rubber Industry Volume (K Tons) Forecast, by Application 2019 & 2032
- Table 113: Russia Synthetic Rubber Industry Revenue (Million) Forecast, by Application 2019 & 2032
- Table 114: Russia Synthetic Rubber Industry Volume (K Tons) Forecast, by Application 2019 & 2032
- Table 115: NORDIC Synthetic Rubber Industry Revenue (Million) Forecast, by Application 2019 & 2032
- Table 116: NORDIC Synthetic Rubber Industry Volume (K Tons) Forecast, by Application 2019 & 2032
- Table 117: Turkey Synthetic Rubber Industry Revenue (Million) Forecast, by Application 2019 & 2032
- Table 118: Turkey Synthetic Rubber Industry Volume (K Tons) Forecast, by Application 2019 & 2032
- Table 119: Rest of Europe Synthetic Rubber Industry Revenue (Million) Forecast, by Application 2019 & 2032
- Table 120: Rest of Europe Synthetic Rubber Industry Volume (K Tons) Forecast, by Application 2019 & 2032
- Table 121: Global Synthetic Rubber Industry Revenue Million Forecast, by Type 2019 & 2032
- Table 122: Global Synthetic Rubber Industry Volume K Tons Forecast, by Type 2019 & 2032
- Table 123: Global Synthetic Rubber Industry Revenue Million Forecast, by Application 2019 & 2032
- Table 124: Global Synthetic Rubber Industry Volume K Tons Forecast, by Application 2019 & 2032
- Table 125: Global Synthetic Rubber Industry Revenue Million Forecast, by Country 2019 & 2032
- Table 126: Global Synthetic Rubber Industry Volume K Tons Forecast, by Country 2019 & 2032
- Table 127: Brazil Synthetic Rubber Industry Revenue (Million) Forecast, by Application 2019 & 2032
- Table 128: Brazil Synthetic Rubber Industry Volume (K Tons) Forecast, by Application 2019 & 2032
- Table 129: Argentina Synthetic Rubber Industry Revenue (Million) Forecast, by Application 2019 & 2032
- Table 130: Argentina Synthetic Rubber Industry Volume (K Tons) Forecast, by Application 2019 & 2032
- Table 131: Colombia Synthetic Rubber Industry Revenue (Million) Forecast, by Application 2019 & 2032
- Table 132: Colombia Synthetic Rubber Industry Volume (K Tons) Forecast, by Application 2019 & 2032
- Table 133: Rest of South America Synthetic Rubber Industry Revenue (Million) Forecast, by Application 2019 & 2032
- Table 134: Rest of South America Synthetic Rubber Industry Volume (K Tons) Forecast, by Application 2019 & 2032
- Table 135: Global Synthetic Rubber Industry Revenue Million Forecast, by Type 2019 & 2032
- Table 136: Global Synthetic Rubber Industry Volume K Tons Forecast, by Type 2019 & 2032
- Table 137: Global Synthetic Rubber Industry Revenue Million Forecast, by Application 2019 & 2032
- Table 138: Global Synthetic Rubber Industry Volume K Tons Forecast, by Application 2019 & 2032
- Table 139: Global Synthetic Rubber Industry Revenue Million Forecast, by Country 2019 & 2032
- Table 140: Global Synthetic Rubber Industry Volume K Tons Forecast, by Country 2019 & 2032
- Table 141: Saudi Arabia Synthetic Rubber Industry Revenue (Million) Forecast, by Application 2019 & 2032
- Table 142: Saudi Arabia Synthetic Rubber Industry Volume (K Tons) Forecast, by Application 2019 & 2032
- Table 143: South Africa Synthetic Rubber Industry Revenue (Million) Forecast, by Application 2019 & 2032
- Table 144: South Africa Synthetic Rubber Industry Volume (K Tons) Forecast, by Application 2019 & 2032
- Table 145: United Arab Emirates Synthetic Rubber Industry Revenue (Million) Forecast, by Application 2019 & 2032
- Table 146: United Arab Emirates Synthetic Rubber Industry Volume (K Tons) Forecast, by Application 2019 & 2032
- Table 147: Nigeria Synthetic Rubber Industry Revenue (Million) Forecast, by Application 2019 & 2032
- Table 148: Nigeria Synthetic Rubber Industry Volume (K Tons) Forecast, by Application 2019 & 2032
- Table 149: Qatar Synthetic Rubber Industry Revenue (Million) Forecast, by Application 2019 & 2032
- Table 150: Qatar Synthetic Rubber Industry Volume (K Tons) Forecast, by Application 2019 & 2032
- Table 151: Egypt Synthetic Rubber Industry Revenue (Million) Forecast, by Application 2019 & 2032
- Table 152: Egypt Synthetic Rubber Industry Volume (K Tons) Forecast, by Application 2019 & 2032
- Table 153: Rest of Middle East and Africa Synthetic Rubber Industry Revenue (Million) Forecast, by Application 2019 & 2032
- Table 154: Rest of Middle East and Africa Synthetic Rubber Industry Volume (K Tons) Forecast, by Application 2019 & 2032
Frequently Asked Questions
1. What is the projected Compound Annual Growth Rate (CAGR) of the Synthetic Rubber Industry?
The projected CAGR is approximately 4.21%.
2. Which companies are prominent players in the Synthetic Rubber Industry?
Key companies in the market include Versalis S p A, The Goodyear Tire & Rubber Company, Synthos, China Petrochemical Corporation, Exxon Mobil Corporation, Mitsubishi Chemical Corporation, Reliance Industries Limited, ENEOS Corporation, LANXESS, SIBUR, SABIC, LG Chem, Saudi Arabian Oil Co, Dow, Apcotex, Kumho Petrochemical, TSRC.
3. What are the main segments of the Synthetic Rubber Industry?
The market segments include Type, Application.
4. Can you provide details about the market size?
The market size is estimated to be USD 33.48 Million as of 2022.
5. What are some drivers contributing to market growth?
Increasing Demand from Rising Sales of Electric Vehicles; Other Drivers.
6. What are the notable trends driving market growth?
Increasing Demand From Tire and Tire Components.
7. Are there any restraints impacting market growth?
Replacement of Rubber by Polyurethanes in Some Applications; Other Restraints.
8. Can you provide examples of recent developments in the market?
December 2023: SIBUR's Nizhnekamskneftekhim completed the upgrade of its halobutyl rubbers (HBR) capacities by ramping them up from 150 to 200 kilotons. About RUB 8 billion (USD 85.5 million) was spent on this upgrade project, which installed six new HBR production units and revamped 16 existing ones.
9. What pricing options are available for accessing the report?
Pricing options include single-user, multi-user, and enterprise licenses priced at USD 4750, USD 5250, and USD 8750 respectively.
10. Is the market size provided in terms of value or volume?
The market size is provided in terms of value, measured in Million and volume, measured in K Tons.
11. Are there any specific market keywords associated with the report?
Yes, the market keyword associated with the report is "Synthetic Rubber Industry," which aids in identifying and referencing the specific market segment covered.
12. How do I determine which pricing option suits my needs best?
The pricing options vary based on user requirements and access needs. Individual users may opt for single-user licenses, while businesses requiring broader access may choose multi-user or enterprise licenses for cost-effective access to the report.
13. Are there any additional resources or data provided in the Synthetic Rubber Industry report?
While the report offers comprehensive insights, it's advisable to review the specific contents or supplementary materials provided to ascertain if additional resources or data are available.
14. How can I stay updated on further developments or reports in the Synthetic Rubber Industry?
To stay informed about further developments, trends, and reports in the Synthetic Rubber Industry, consider subscribing to industry newsletters, following relevant companies and organizations, or regularly checking reputable industry news sources and publications.
Methodology
Step 1 - Identification of Relevant Samples Size from Population Database


Step 2 - Approaches for Defining Global Market Size (Value, Volume* & Price*)

Note*: In applicable scenarios
Step 3 - Data Sources
Primary Research
- Web Analytics
- Survey Reports
- Research Institute
- Latest Research Reports
- Opinion Leaders
Secondary Research
- Annual Reports
- White Paper
- Latest Press Release
- Industry Association
- Paid Database
- Investor Presentations

Step 4 - Data Triangulation
Involves using different sources of information in order to increase the validity of a study
These sources are likely to be stakeholders in a program - participants, other researchers, program staff, other community members, and so on.
Then we put all data in single framework & apply various statistical tools to find out the dynamic on the market.
During the analysis stage, feedback from the stakeholder groups would be compared to determine areas of agreement as well as areas of divergence


