

Key Insights
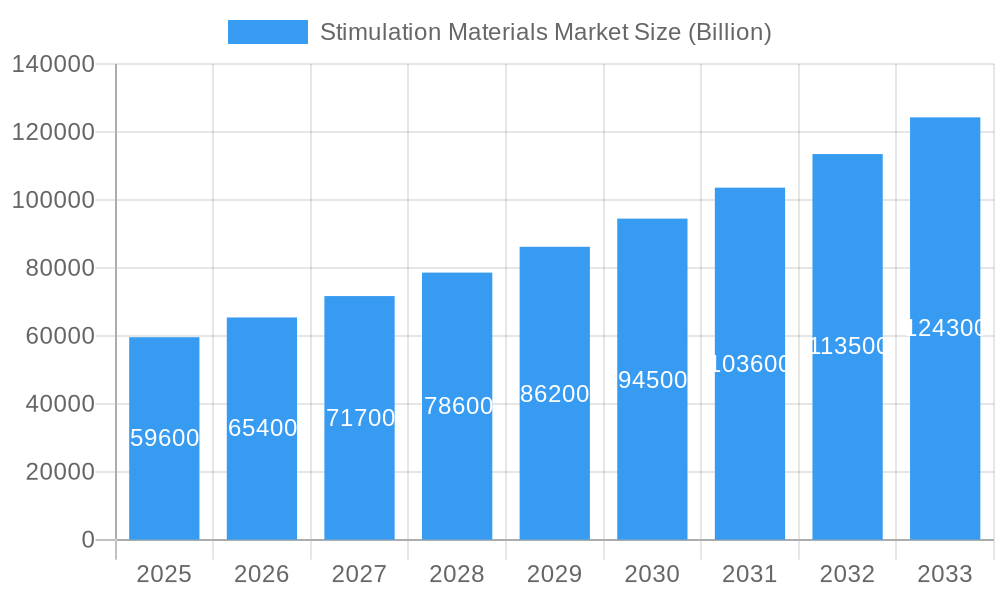
The global stimulation materials market is projected to reach $65.5 billion by 2024, with a Compound Annual Growth Rate (CAGR) of 9.4% from 2024 onwards. This growth is primarily driven by the rising global demand for oil and natural gas, and the continuous exploration and development of unconventional reserves such as shale gas and tight oil. Advanced stimulation techniques are essential for these operations. Hydraulic fracturing, a key stimulation method, significantly boosts demand for proppants and chemicals. Innovations in proppant technology, focusing on enhanced strength, conductivity, and cost efficiency, are also propelling market expansion. Furthermore, the increasing adoption of Enhanced Oil Recovery (EOR) methods contributes to higher stimulation material consumption. North America and Asia-Pacific are expected to lead market growth due to substantial shale gas production and active exploration initiatives in these regions. However, stringent environmental regulations and concerns surrounding the ecological impact of hydraulic fracturing present challenges, driving the industry towards sustainable and environmentally responsible practices. Market segmentation by material type (proppants, chemicals) and ceramic type reveals diverse growth avenues. The ceramic segment within chemical stimulation materials is set for expansion due to its superior efficiency and performance in specific geological conditions.
Stimulation Materials Market Market Size (In Billion)
The competitive landscape features a blend of major multinational corporations and specialized niche players. Leading companies such as Schlumberger, Halliburton, and Baker Hughes are investing heavily in research and development to refine their offerings and expand market presence. Strategic alliances and mergers/acquisitions are anticipated to influence market dynamics throughout the forecast period. The widespread geographic presence of key industry players underscores the global nature of the stimulation materials market, with significant operations in North America, Europe, and Asia-Pacific. The market's future trajectory will be shaped by the interaction of technological advancements, regulatory environments, and global energy demand trends. Sustained innovation and a commitment to sustainable methodologies will be critical for continued growth in the stimulation materials sector.
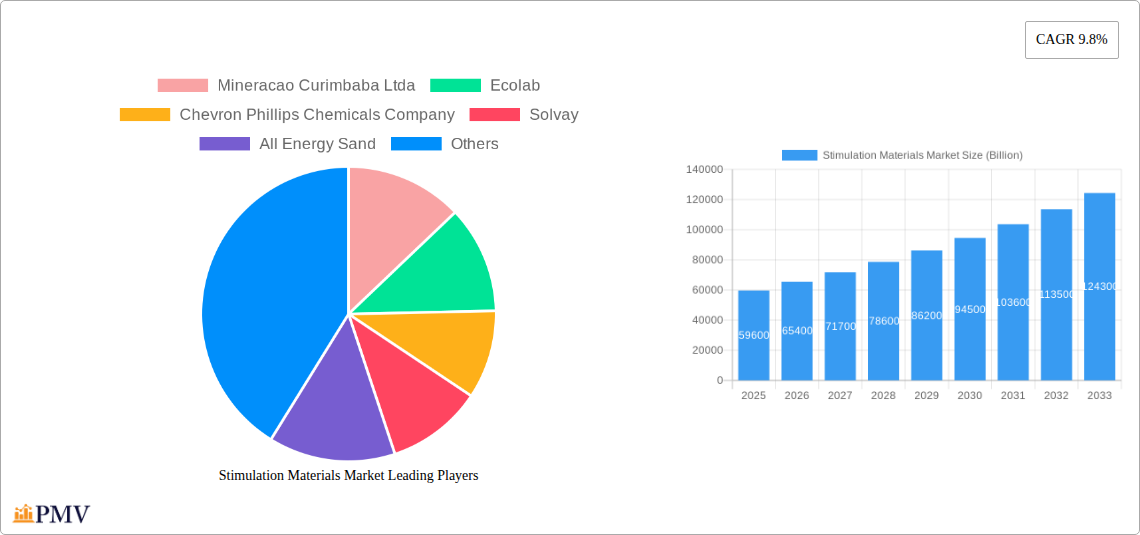
Stimulation Materials Market Company Market Share
Stimulation Materials Market: A Comprehensive Report (2019-2033)
This in-depth report provides a comprehensive analysis of the global Stimulation Materials Market, offering invaluable insights for stakeholders across the industry. With a meticulous examination of market dynamics, competitive landscapes, and future growth trajectories, this report is an essential resource for strategic decision-making. The study period spans from 2019 to 2033, with 2025 serving as the base and estimated year. The forecast period covers 2025-2033, while the historical period encompasses 2019-2024. The total market size is estimated at xx Billion in 2025 and is projected to reach xx Billion by 2033.
Stimulation Materials Market Market Structure & Competitive Dynamics
The Stimulation Materials Market exhibits a moderately concentrated structure, with a few dominant players holding significant market share. The market’s competitive dynamics are shaped by factors such as technological innovation, regulatory frameworks (especially concerning environmental impact), and the emergence of substitute materials. The industry is characterized by ongoing mergers and acquisitions (M&A) activity, with deal values varying significantly based on the size and strategic importance of the acquired companies. For instance, a recent M&A deal involving [insert example if available, otherwise state "a major player"] resulted in a xx Billion transaction, significantly altering market share distribution.
The innovation ecosystem is dynamic, with both established players and startups actively developing new proppants and chemical formulations. This drive for innovation is spurred by the need for enhanced well stimulation efficiency and reduced environmental impact. However, regulatory hurdles, particularly concerning the disposal of spent proppants and the environmental impact of certain chemicals, pose significant challenges. Furthermore, end-user trends, such as a shift towards unconventional reservoir exploitation, are significantly impacting product demand and driving innovation.
- Market Concentration: Moderately concentrated, with top 5 players holding approximately xx% market share in 2025.
- Innovation: Focus on higher-strength proppants, environmentally friendly chemicals, and improved placement technologies.
- M&A Activity: Significant activity observed in the past five years, with deal values exceeding xx Billion in total.
- Regulatory Landscape: Stringent environmental regulations influencing product development and market access.
- Substitute Materials: Limited substitutes currently available, but ongoing research into alternative technologies poses a potential threat.
Stimulation Materials Market Industry Trends & Insights
The Stimulation Materials Market is experiencing robust growth, driven by several key factors. The increasing demand for oil and gas, particularly from unconventional resources like shale formations, is a primary driver. Technological advancements, such as the development of high-strength proppants and improved fracturing techniques, are further enhancing market expansion. The compound annual growth rate (CAGR) for the market is estimated at xx% during the forecast period (2025-2033). Market penetration of advanced proppant technologies, such as ceramic proppants, is steadily increasing, reaching xx% in 2025. However, fluctuating oil and gas prices and the increasing focus on renewable energy sources pose challenges to consistent growth. Competitive dynamics are influencing pricing strategies and driving innovation within the industry. Consumer preferences are shifting towards environmentally friendly and cost-effective solutions, which manufacturers are addressing through research and development efforts. Overall, the market is poised for sustained growth, though at a potentially moderated pace compared to previous periods of rapid expansion.
Dominant Markets & Segments in Stimulation Materials Market
The North American region, particularly the United States, currently holds the dominant position in the Stimulation Materials Market, driven by robust shale gas production and a well-established oil and gas infrastructure. Within the material type segment, proppants (sand and ceramic) represent the largest share, while within the chemical segment, fracturing fluids and additives dominate the market.
Key Drivers for North American Dominance:
- Abundant Shale Gas Reserves: Significant shale gas resources fuel high demand for stimulation materials.
- Established Oil & Gas Infrastructure: Well-developed infrastructure supports efficient production and distribution.
- Favorable Regulatory Environment (relatively): While regulations exist, the environment is currently considered relatively supportive of oil and gas extraction compared to other regions.
- Technological Advancements: Significant R&D investment and innovation within the region.
Dominance Analysis:
The dominance of North America is primarily attributed to the high concentration of shale gas exploration and production activities. This region benefits from substantial investments in infrastructure, technological advancements, and a relatively favorable regulatory environment that supports the oil and gas industry. However, increasing environmental concerns and potential regulatory shifts could impact future dominance. Other regions, such as the Middle East and Asia-Pacific, are showing signs of growth, but currently lag behind North America in terms of market size and overall activity.
Stimulation Materials Market Product Innovations
Recent innovations in the Stimulation Materials Market focus on enhancing proppant strength, improving proppant placement, and developing more environmentally friendly fracturing fluids. High-strength ceramic proppants are gaining traction due to their ability to withstand high-pressure environments, leading to improved well productivity. Advances in fracturing fluid chemistry are aimed at reducing the environmental footprint of hydraulic fracturing operations, such as the development of biodegradable fluids. These innovations are crucial for addressing the challenges of cost-effectiveness, environmental responsibility, and maximizing production efficiency from unconventional reservoirs. The market fit for these innovations is strong, given the industry's ongoing pursuit of enhanced efficiency and sustainability.
Report Segmentation & Scope
This report segments the Stimulation Materials Market based on material type (proppants and chemicals) and further subdivides proppants into sand and ceramic proppants. The chemical segment includes fracturing fluids and additives. Each segment is analyzed in terms of market size, growth projections, and competitive dynamics. Growth projections vary across segments, with ceramic proppants and specific high-performance additives experiencing faster growth due to technological advancements and increasing demand for enhanced well productivity. The competitive landscape differs within each segment, with some exhibiting higher levels of concentration than others.
Key Drivers of Stimulation Materials Market Growth
Several factors contribute to the growth of the Stimulation Materials Market. The increasing global demand for energy, particularly from unconventional oil and gas reserves, is a primary driver. Technological advancements, like the development of stronger and more efficient proppants and environmentally friendly fracturing fluids, are boosting market growth. Furthermore, supportive government policies and investments in oil and gas infrastructure in several regions contribute to the expansion of the market. The continued exploration and development of unconventional resources are expected to further propel market growth in the coming years.
Challenges in the Stimulation Materials Market Sector
The Stimulation Materials Market faces significant challenges. Fluctuations in oil and gas prices directly impact market demand, leading to uncertainty for producers. Environmental regulations are increasingly stringent, requiring manufacturers to develop and adopt more environmentally friendly products, increasing production costs. Supply chain disruptions, particularly in the sourcing of raw materials for proppants, can also impact market stability. Finally, intense competition among established players and the emergence of new entrants put pressure on pricing and profit margins. These challenges necessitate strategic planning and adaptation by market participants.
Leading Players in the Stimulation Materials Market Market
- Mineracao Curimbaba Ltda
- Ecolab
- Chevron Phillips Chemicals Company
- Solvay
- All Energy Sand
- Baker Hughes
- Imerys
- CoorsTek Inc
- Baltic Ceramics Investments S A
- Weatherford International plc
- Saint-Gobain (Saint-Gobain Proppants)
- Halliburton
- Royal Dutch Shell PLC
- Carbo Ceramics Inc
- Hi-Crush Inc
- Badger Mining Corporation
- Schlumberger Limited
- Unimin Corporation
- Hexion Inc
Key Developments in Stimulation Materials Market Sector
- Q1 2023: Company X launches a new biodegradable fracturing fluid.
- Q3 2022: Company Y acquires Company Z, expanding its market share in ceramic proppants.
- Q4 2021: New environmental regulations are introduced impacting proppant disposal methods.
- Q2 2020: Significant slowdown in market activity due to the COVID-19 pandemic. (Add more specific examples with dates as available)
Strategic Stimulation Materials Market Market Outlook
The Stimulation Materials Market presents significant growth opportunities for companies that can innovate and adapt to changing market dynamics. Future growth will be fueled by continued exploration and production of unconventional resources, particularly in emerging markets. Strategic investments in R&D for environmentally friendly and cost-effective solutions are crucial for success. Companies that can effectively manage supply chain challenges and navigate evolving regulatory landscapes are poised to capture a greater market share. The long-term outlook for the Stimulation Materials Market remains positive, driven by the sustained global demand for energy.
Stimulation Materials Market Segmentation
-
1. Material Type
-
1.1. Proppants
- 1.1.1. Frac Sand
- 1.1.2. Resin Coated
- 1.1.3. Ceramic
-
1.2. Chemical
- 1.2.1. Surfactants
- 1.2.2. Gelling Agents
- 1.2.3. Friction Reducers
- 1.2.4. Breakers
- 1.2.5. Crosslinking Agents
- 1.2.6. Corrosion and Scale Inhibitors
- 1.2.7. Biocides
- 1.2.8. Other Chemicals
-
1.1. Proppants
Stimulation Materials Market Segmentation By Geography
-
1. Asia Pacific
- 1.1. China
- 1.2. India
- 1.3. Japan
- 1.4. South Korea
- 1.5. Rest of Asia Pacific
-
2. North America
- 2.1. United States
- 2.2. Canada
- 2.3. Mexico
-
3. Europe
- 3.1. Germany
- 3.2. United Kingdom
- 3.3. France
- 3.4. Italy
- 3.5. Rest of Europe
-
4. South America
- 4.1. Brazil
- 4.2. Argentina
- 4.3. Rest of South America
- 5. Middle East
-
6. Saudi Arabia
- 6.1. South Africa
- 6.2. Rest of Middle East
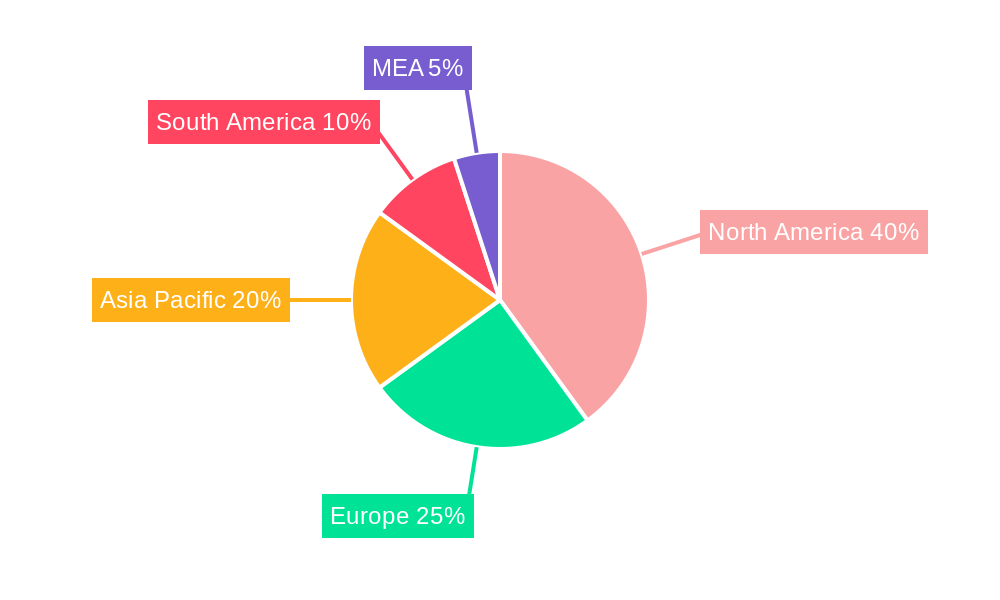
Stimulation Materials Market Regional Market Share
Geographic Coverage of Stimulation Materials Market
Stimulation Materials Market REPORT HIGHLIGHTS
| Aspects | Details |
|---|---|
| Study Period | 2020-2034 |
| Base Year | 2025 |
| Estimated Year | 2026 |
| Forecast Period | 2026-2034 |
| Historical Period | 2020-2025 |
| Growth Rate | CAGR of 9.4% from 2020-2034 |
| Segmentation |
|
Table of Contents
- 1. Introduction
- 1.1. Research Scope
- 1.2. Market Segmentation
- 1.3. Research Objective
- 1.4. Definitions and Assumptions
- 2. Executive Summary
- 2.1. Market Snapshot
- 3. Market Dynamics
- 3.1. Market Drivers
- 3.2. Market Restrains
- 3.3. Market Trends
- 3.4. Market Opportunities
- 4. Market Factor Analysis
- 4.1. Porters Five Forces
- 4.1.1. Bargaining Power of Suppliers
- 4.1.2. Bargaining Power of Buyers
- 4.1.3. Threat of New Entrants
- 4.1.4. Threat of Substitutes
- 4.1.5. Competitive Rivalry
- 4.2. PESTEL analysis
- 4.3. BCG Analysis
- 4.3.1. Stars (High Growth, High Market Share)
- 4.3.2. Cash Cows (Low Growth, High Market Share)
- 4.3.3. Question Mark (High Growth, Low Market Share)
- 4.3.4. Dogs (Low Growth, Low Market Share)
- 4.4. Ansoff Matrix Analysis
- 4.5. Supply Chain Analysis
- 4.6. Regulatory Landscape
- 4.7. Current Market Potential and Opportunity Assessment (TAM–SAM–SOM Framework)
- 4.8. PMV Analyst Note
- 4.1. Porters Five Forces
- 5. Market Analysis, Insights and Forecast 2021-2033
- 5.1. Market Analysis, Insights and Forecast - by Material Type
- 5.1.1. Proppants
- 5.1.1.1. Frac Sand
- 5.1.1.2. Resin Coated
- 5.1.1.3. Ceramic
- 5.1.2. Chemical
- 5.1.2.1. Surfactants
- 5.1.2.2. Gelling Agents
- 5.1.2.3. Friction Reducers
- 5.1.2.4. Breakers
- 5.1.2.5. Crosslinking Agents
- 5.1.2.6. Corrosion and Scale Inhibitors
- 5.1.2.7. Biocides
- 5.1.2.8. Other Chemicals
- 5.1.1. Proppants
- 5.2. Market Analysis, Insights and Forecast - by Region
- 5.2.1. Asia Pacific
- 5.2.2. North America
- 5.2.3. Europe
- 5.2.4. South America
- 5.2.5. Middle East
- 5.2.6. Saudi Arabia
- 5.1. Market Analysis, Insights and Forecast - by Material Type
- 6. Global Stimulation Materials Market Analysis, Insights and Forecast, 2021-2033
- 6.1. Market Analysis, Insights and Forecast - by Material Type
- 6.1.1. Proppants
- 6.1.1.1. Frac Sand
- 6.1.1.2. Resin Coated
- 6.1.1.3. Ceramic
- 6.1.2. Chemical
- 6.1.2.1. Surfactants
- 6.1.2.2. Gelling Agents
- 6.1.2.3. Friction Reducers
- 6.1.2.4. Breakers
- 6.1.2.5. Crosslinking Agents
- 6.1.2.6. Corrosion and Scale Inhibitors
- 6.1.2.7. Biocides
- 6.1.2.8. Other Chemicals
- 6.1.1. Proppants
- 6.1. Market Analysis, Insights and Forecast - by Material Type
- 7. Asia Pacific Stimulation Materials Market Analysis, Insights and Forecast, 2020-2032
- 7.1. Market Analysis, Insights and Forecast - by Material Type
- 7.1.1. Proppants
- 7.1.1.1. Frac Sand
- 7.1.1.2. Resin Coated
- 7.1.1.3. Ceramic
- 7.1.2. Chemical
- 7.1.2.1. Surfactants
- 7.1.2.2. Gelling Agents
- 7.1.2.3. Friction Reducers
- 7.1.2.4. Breakers
- 7.1.2.5. Crosslinking Agents
- 7.1.2.6. Corrosion and Scale Inhibitors
- 7.1.2.7. Biocides
- 7.1.2.8. Other Chemicals
- 7.1.1. Proppants
- 7.1. Market Analysis, Insights and Forecast - by Material Type
- 8. North America Stimulation Materials Market Analysis, Insights and Forecast, 2020-2032
- 8.1. Market Analysis, Insights and Forecast - by Material Type
- 8.1.1. Proppants
- 8.1.1.1. Frac Sand
- 8.1.1.2. Resin Coated
- 8.1.1.3. Ceramic
- 8.1.2. Chemical
- 8.1.2.1. Surfactants
- 8.1.2.2. Gelling Agents
- 8.1.2.3. Friction Reducers
- 8.1.2.4. Breakers
- 8.1.2.5. Crosslinking Agents
- 8.1.2.6. Corrosion and Scale Inhibitors
- 8.1.2.7. Biocides
- 8.1.2.8. Other Chemicals
- 8.1.1. Proppants
- 8.1. Market Analysis, Insights and Forecast - by Material Type
- 9. Europe Stimulation Materials Market Analysis, Insights and Forecast, 2020-2032
- 9.1. Market Analysis, Insights and Forecast - by Material Type
- 9.1.1. Proppants
- 9.1.1.1. Frac Sand
- 9.1.1.2. Resin Coated
- 9.1.1.3. Ceramic
- 9.1.2. Chemical
- 9.1.2.1. Surfactants
- 9.1.2.2. Gelling Agents
- 9.1.2.3. Friction Reducers
- 9.1.2.4. Breakers
- 9.1.2.5. Crosslinking Agents
- 9.1.2.6. Corrosion and Scale Inhibitors
- 9.1.2.7. Biocides
- 9.1.2.8. Other Chemicals
- 9.1.1. Proppants
- 9.1. Market Analysis, Insights and Forecast - by Material Type
- 10. South America Stimulation Materials Market Analysis, Insights and Forecast, 2020-2032
- 10.1. Market Analysis, Insights and Forecast - by Material Type
- 10.1.1. Proppants
- 10.1.1.1. Frac Sand
- 10.1.1.2. Resin Coated
- 10.1.1.3. Ceramic
- 10.1.2. Chemical
- 10.1.2.1. Surfactants
- 10.1.2.2. Gelling Agents
- 10.1.2.3. Friction Reducers
- 10.1.2.4. Breakers
- 10.1.2.5. Crosslinking Agents
- 10.1.2.6. Corrosion and Scale Inhibitors
- 10.1.2.7. Biocides
- 10.1.2.8. Other Chemicals
- 10.1.1. Proppants
- 10.1. Market Analysis, Insights and Forecast - by Material Type
- 11. Middle East Stimulation Materials Market Analysis, Insights and Forecast, 2020-2032
- 11.1. Market Analysis, Insights and Forecast - by Material Type
- 11.1.1. Proppants
- 11.1.1.1. Frac Sand
- 11.1.1.2. Resin Coated
- 11.1.1.3. Ceramic
- 11.1.2. Chemical
- 11.1.2.1. Surfactants
- 11.1.2.2. Gelling Agents
- 11.1.2.3. Friction Reducers
- 11.1.2.4. Breakers
- 11.1.2.5. Crosslinking Agents
- 11.1.2.6. Corrosion and Scale Inhibitors
- 11.1.2.7. Biocides
- 11.1.2.8. Other Chemicals
- 11.1.1. Proppants
- 11.1. Market Analysis, Insights and Forecast - by Material Type
- 12. Saudi Arabia Stimulation Materials Market Analysis, Insights and Forecast, 2020-2032
- 12.1. Market Analysis, Insights and Forecast - by Material Type
- 12.1.1. Proppants
- 12.1.1.1. Frac Sand
- 12.1.1.2. Resin Coated
- 12.1.1.3. Ceramic
- 12.1.2. Chemical
- 12.1.2.1. Surfactants
- 12.1.2.2. Gelling Agents
- 12.1.2.3. Friction Reducers
- 12.1.2.4. Breakers
- 12.1.2.5. Crosslinking Agents
- 12.1.2.6. Corrosion and Scale Inhibitors
- 12.1.2.7. Biocides
- 12.1.2.8. Other Chemicals
- 12.1.1. Proppants
- 12.1. Market Analysis, Insights and Forecast - by Material Type
- 13. Competitive Analysis
- 13.1. Company Profiles
- 13.1.1 Mineracao Curimbaba Ltda
- 13.1.1.1. Company Overview
- 13.1.1.2. Products
- 13.1.1.3. Company Financials
- 13.1.1.4. SWOT Analysis
- 13.1.2 Ecolab
- 13.1.2.1. Company Overview
- 13.1.2.2. Products
- 13.1.2.3. Company Financials
- 13.1.2.4. SWOT Analysis
- 13.1.3 Chevron Phillips Chemicals Company
- 13.1.3.1. Company Overview
- 13.1.3.2. Products
- 13.1.3.3. Company Financials
- 13.1.3.4. SWOT Analysis
- 13.1.4 Solvay
- 13.1.4.1. Company Overview
- 13.1.4.2. Products
- 13.1.4.3. Company Financials
- 13.1.4.4. SWOT Analysis
- 13.1.5 All Energy Sand
- 13.1.5.1. Company Overview
- 13.1.5.2. Products
- 13.1.5.3. Company Financials
- 13.1.5.4. SWOT Analysis
- 13.1.6 Baker Hughes
- 13.1.6.1. Company Overview
- 13.1.6.2. Products
- 13.1.6.3. Company Financials
- 13.1.6.4. SWOT Analysis
- 13.1.7 Imerys
- 13.1.7.1. Company Overview
- 13.1.7.2. Products
- 13.1.7.3. Company Financials
- 13.1.7.4. SWOT Analysis
- 13.1.8 CoorsTek Inc
- 13.1.8.1. Company Overview
- 13.1.8.2. Products
- 13.1.8.3. Company Financials
- 13.1.8.4. SWOT Analysis
- 13.1.9 Baltic Ceramics Investments S A
- 13.1.9.1. Company Overview
- 13.1.9.2. Products
- 13.1.9.3. Company Financials
- 13.1.9.4. SWOT Analysis
- 13.1.10 Weatherford International plc
- 13.1.10.1. Company Overview
- 13.1.10.2. Products
- 13.1.10.3. Company Financials
- 13.1.10.4. SWOT Analysis
- 13.1.11 Saint-Gobain (Saint-Gobain Proppants)
- 13.1.11.1. Company Overview
- 13.1.11.2. Products
- 13.1.11.3. Company Financials
- 13.1.11.4. SWOT Analysis
- 13.1.12 Halliburton
- 13.1.12.1. Company Overview
- 13.1.12.2. Products
- 13.1.12.3. Company Financials
- 13.1.12.4. SWOT Analysis
- 13.1.13 Royal Dutch Shell PLC
- 13.1.13.1. Company Overview
- 13.1.13.2. Products
- 13.1.13.3. Company Financials
- 13.1.13.4. SWOT Analysis
- 13.1.14 Carbo Ceramics Inc
- 13.1.14.1. Company Overview
- 13.1.14.2. Products
- 13.1.14.3. Company Financials
- 13.1.14.4. SWOT Analysis
- 13.1.15 Hi-Crush Inc
- 13.1.15.1. Company Overview
- 13.1.15.2. Products
- 13.1.15.3. Company Financials
- 13.1.15.4. SWOT Analysis
- 13.1.16 Badger Mining Corporation
- 13.1.16.1. Company Overview
- 13.1.16.2. Products
- 13.1.16.3. Company Financials
- 13.1.16.4. SWOT Analysis
- 13.1.17 Schlumberger Limited
- 13.1.17.1. Company Overview
- 13.1.17.2. Products
- 13.1.17.3. Company Financials
- 13.1.17.4. SWOT Analysis
- 13.1.18 Unimin Corporation
- 13.1.18.1. Company Overview
- 13.1.18.2. Products
- 13.1.18.3. Company Financials
- 13.1.18.4. SWOT Analysis
- 13.1.19 Hexion Inc
- 13.1.19.1. Company Overview
- 13.1.19.2. Products
- 13.1.19.3. Company Financials
- 13.1.19.4. SWOT Analysis
- 13.1.1 Mineracao Curimbaba Ltda
- 13.2. Market Entropy
- 13.2.1 Company's Key Areas Served
- 13.2.2 Recent Developments
- 13.3. Company Market Share Analysis 2025
- 13.3.1 Top 5 Companies Market Share Analysis
- 13.3.2 Top 3 Companies Market Share Analysis
- 13.4. List of Potential Customers
- 14. Research Methodology
List of Figures
- Figure 1: Global Stimulation Materials Market Revenue Breakdown (billion, %) by Region 2025 & 2033
- Figure 2: Global Stimulation Materials Market Volume Breakdown (K Tons, %) by Region 2025 & 2033
- Figure 3: Asia Pacific Stimulation Materials Market Revenue (billion), by Material Type 2025 & 2033
- Figure 4: Asia Pacific Stimulation Materials Market Volume (K Tons), by Material Type 2025 & 2033
- Figure 5: Asia Pacific Stimulation Materials Market Revenue Share (%), by Material Type 2025 & 2033
- Figure 6: Asia Pacific Stimulation Materials Market Volume Share (%), by Material Type 2025 & 2033
- Figure 7: Asia Pacific Stimulation Materials Market Revenue (billion), by Country 2025 & 2033
- Figure 8: Asia Pacific Stimulation Materials Market Volume (K Tons), by Country 2025 & 2033
- Figure 9: Asia Pacific Stimulation Materials Market Revenue Share (%), by Country 2025 & 2033
- Figure 10: Asia Pacific Stimulation Materials Market Volume Share (%), by Country 2025 & 2033
- Figure 11: North America Stimulation Materials Market Revenue (billion), by Material Type 2025 & 2033
- Figure 12: North America Stimulation Materials Market Volume (K Tons), by Material Type 2025 & 2033
- Figure 13: North America Stimulation Materials Market Revenue Share (%), by Material Type 2025 & 2033
- Figure 14: North America Stimulation Materials Market Volume Share (%), by Material Type 2025 & 2033
- Figure 15: North America Stimulation Materials Market Revenue (billion), by Country 2025 & 2033
- Figure 16: North America Stimulation Materials Market Volume (K Tons), by Country 2025 & 2033
- Figure 17: North America Stimulation Materials Market Revenue Share (%), by Country 2025 & 2033
- Figure 18: North America Stimulation Materials Market Volume Share (%), by Country 2025 & 2033
- Figure 19: Europe Stimulation Materials Market Revenue (billion), by Material Type 2025 & 2033
- Figure 20: Europe Stimulation Materials Market Volume (K Tons), by Material Type 2025 & 2033
- Figure 21: Europe Stimulation Materials Market Revenue Share (%), by Material Type 2025 & 2033
- Figure 22: Europe Stimulation Materials Market Volume Share (%), by Material Type 2025 & 2033
- Figure 23: Europe Stimulation Materials Market Revenue (billion), by Country 2025 & 2033
- Figure 24: Europe Stimulation Materials Market Volume (K Tons), by Country 2025 & 2033
- Figure 25: Europe Stimulation Materials Market Revenue Share (%), by Country 2025 & 2033
- Figure 26: Europe Stimulation Materials Market Volume Share (%), by Country 2025 & 2033
- Figure 27: South America Stimulation Materials Market Revenue (billion), by Material Type 2025 & 2033
- Figure 28: South America Stimulation Materials Market Volume (K Tons), by Material Type 2025 & 2033
- Figure 29: South America Stimulation Materials Market Revenue Share (%), by Material Type 2025 & 2033
- Figure 30: South America Stimulation Materials Market Volume Share (%), by Material Type 2025 & 2033
- Figure 31: South America Stimulation Materials Market Revenue (billion), by Country 2025 & 2033
- Figure 32: South America Stimulation Materials Market Volume (K Tons), by Country 2025 & 2033
- Figure 33: South America Stimulation Materials Market Revenue Share (%), by Country 2025 & 2033
- Figure 34: South America Stimulation Materials Market Volume Share (%), by Country 2025 & 2033
- Figure 35: Middle East Stimulation Materials Market Revenue (billion), by Material Type 2025 & 2033
- Figure 36: Middle East Stimulation Materials Market Volume (K Tons), by Material Type 2025 & 2033
- Figure 37: Middle East Stimulation Materials Market Revenue Share (%), by Material Type 2025 & 2033
- Figure 38: Middle East Stimulation Materials Market Volume Share (%), by Material Type 2025 & 2033
- Figure 39: Middle East Stimulation Materials Market Revenue (billion), by Country 2025 & 2033
- Figure 40: Middle East Stimulation Materials Market Volume (K Tons), by Country 2025 & 2033
- Figure 41: Middle East Stimulation Materials Market Revenue Share (%), by Country 2025 & 2033
- Figure 42: Middle East Stimulation Materials Market Volume Share (%), by Country 2025 & 2033
- Figure 43: Saudi Arabia Stimulation Materials Market Revenue (billion), by Material Type 2025 & 2033
- Figure 44: Saudi Arabia Stimulation Materials Market Volume (K Tons), by Material Type 2025 & 2033
- Figure 45: Saudi Arabia Stimulation Materials Market Revenue Share (%), by Material Type 2025 & 2033
- Figure 46: Saudi Arabia Stimulation Materials Market Volume Share (%), by Material Type 2025 & 2033
- Figure 47: Saudi Arabia Stimulation Materials Market Revenue (billion), by Country 2025 & 2033
- Figure 48: Saudi Arabia Stimulation Materials Market Volume (K Tons), by Country 2025 & 2033
- Figure 49: Saudi Arabia Stimulation Materials Market Revenue Share (%), by Country 2025 & 2033
- Figure 50: Saudi Arabia Stimulation Materials Market Volume Share (%), by Country 2025 & 2033
List of Tables
- Table 1: Global Stimulation Materials Market Revenue billion Forecast, by Material Type 2020 & 2033
- Table 2: Global Stimulation Materials Market Volume K Tons Forecast, by Material Type 2020 & 2033
- Table 3: Global Stimulation Materials Market Revenue billion Forecast, by Region 2020 & 2033
- Table 4: Global Stimulation Materials Market Volume K Tons Forecast, by Region 2020 & 2033
- Table 5: Global Stimulation Materials Market Revenue billion Forecast, by Material Type 2020 & 2033
- Table 6: Global Stimulation Materials Market Volume K Tons Forecast, by Material Type 2020 & 2033
- Table 7: Global Stimulation Materials Market Revenue billion Forecast, by Country 2020 & 2033
- Table 8: Global Stimulation Materials Market Volume K Tons Forecast, by Country 2020 & 2033
- Table 9: China Stimulation Materials Market Revenue (billion) Forecast, by Application 2020 & 2033
- Table 10: China Stimulation Materials Market Volume (K Tons) Forecast, by Application 2020 & 2033
- Table 11: India Stimulation Materials Market Revenue (billion) Forecast, by Application 2020 & 2033
- Table 12: India Stimulation Materials Market Volume (K Tons) Forecast, by Application 2020 & 2033
- Table 13: Japan Stimulation Materials Market Revenue (billion) Forecast, by Application 2020 & 2033
- Table 14: Japan Stimulation Materials Market Volume (K Tons) Forecast, by Application 2020 & 2033
- Table 15: South Korea Stimulation Materials Market Revenue (billion) Forecast, by Application 2020 & 2033
- Table 16: South Korea Stimulation Materials Market Volume (K Tons) Forecast, by Application 2020 & 2033
- Table 17: Rest of Asia Pacific Stimulation Materials Market Revenue (billion) Forecast, by Application 2020 & 2033
- Table 18: Rest of Asia Pacific Stimulation Materials Market Volume (K Tons) Forecast, by Application 2020 & 2033
- Table 19: Global Stimulation Materials Market Revenue billion Forecast, by Material Type 2020 & 2033
- Table 20: Global Stimulation Materials Market Volume K Tons Forecast, by Material Type 2020 & 2033
- Table 21: Global Stimulation Materials Market Revenue billion Forecast, by Country 2020 & 2033
- Table 22: Global Stimulation Materials Market Volume K Tons Forecast, by Country 2020 & 2033
- Table 23: United States Stimulation Materials Market Revenue (billion) Forecast, by Application 2020 & 2033
- Table 24: United States Stimulation Materials Market Volume (K Tons) Forecast, by Application 2020 & 2033
- Table 25: Canada Stimulation Materials Market Revenue (billion) Forecast, by Application 2020 & 2033
- Table 26: Canada Stimulation Materials Market Volume (K Tons) Forecast, by Application 2020 & 2033
- Table 27: Mexico Stimulation Materials Market Revenue (billion) Forecast, by Application 2020 & 2033
- Table 28: Mexico Stimulation Materials Market Volume (K Tons) Forecast, by Application 2020 & 2033
- Table 29: Global Stimulation Materials Market Revenue billion Forecast, by Material Type 2020 & 2033
- Table 30: Global Stimulation Materials Market Volume K Tons Forecast, by Material Type 2020 & 2033
- Table 31: Global Stimulation Materials Market Revenue billion Forecast, by Country 2020 & 2033
- Table 32: Global Stimulation Materials Market Volume K Tons Forecast, by Country 2020 & 2033
- Table 33: Germany Stimulation Materials Market Revenue (billion) Forecast, by Application 2020 & 2033
- Table 34: Germany Stimulation Materials Market Volume (K Tons) Forecast, by Application 2020 & 2033
- Table 35: United Kingdom Stimulation Materials Market Revenue (billion) Forecast, by Application 2020 & 2033
- Table 36: United Kingdom Stimulation Materials Market Volume (K Tons) Forecast, by Application 2020 & 2033
- Table 37: France Stimulation Materials Market Revenue (billion) Forecast, by Application 2020 & 2033
- Table 38: France Stimulation Materials Market Volume (K Tons) Forecast, by Application 2020 & 2033
- Table 39: Italy Stimulation Materials Market Revenue (billion) Forecast, by Application 2020 & 2033
- Table 40: Italy Stimulation Materials Market Volume (K Tons) Forecast, by Application 2020 & 2033
- Table 41: Rest of Europe Stimulation Materials Market Revenue (billion) Forecast, by Application 2020 & 2033
- Table 42: Rest of Europe Stimulation Materials Market Volume (K Tons) Forecast, by Application 2020 & 2033
- Table 43: Global Stimulation Materials Market Revenue billion Forecast, by Material Type 2020 & 2033
- Table 44: Global Stimulation Materials Market Volume K Tons Forecast, by Material Type 2020 & 2033
- Table 45: Global Stimulation Materials Market Revenue billion Forecast, by Country 2020 & 2033
- Table 46: Global Stimulation Materials Market Volume K Tons Forecast, by Country 2020 & 2033
- Table 47: Brazil Stimulation Materials Market Revenue (billion) Forecast, by Application 2020 & 2033
- Table 48: Brazil Stimulation Materials Market Volume (K Tons) Forecast, by Application 2020 & 2033
- Table 49: Argentina Stimulation Materials Market Revenue (billion) Forecast, by Application 2020 & 2033
- Table 50: Argentina Stimulation Materials Market Volume (K Tons) Forecast, by Application 2020 & 2033
- Table 51: Rest of South America Stimulation Materials Market Revenue (billion) Forecast, by Application 2020 & 2033
- Table 52: Rest of South America Stimulation Materials Market Volume (K Tons) Forecast, by Application 2020 & 2033
- Table 53: Global Stimulation Materials Market Revenue billion Forecast, by Material Type 2020 & 2033
- Table 54: Global Stimulation Materials Market Volume K Tons Forecast, by Material Type 2020 & 2033
- Table 55: Global Stimulation Materials Market Revenue billion Forecast, by Country 2020 & 2033
- Table 56: Global Stimulation Materials Market Volume K Tons Forecast, by Country 2020 & 2033
- Table 57: Global Stimulation Materials Market Revenue billion Forecast, by Material Type 2020 & 2033
- Table 58: Global Stimulation Materials Market Volume K Tons Forecast, by Material Type 2020 & 2033
- Table 59: Global Stimulation Materials Market Revenue billion Forecast, by Country 2020 & 2033
- Table 60: Global Stimulation Materials Market Volume K Tons Forecast, by Country 2020 & 2033
- Table 61: South Africa Stimulation Materials Market Revenue (billion) Forecast, by Application 2020 & 2033
- Table 62: South Africa Stimulation Materials Market Volume (K Tons) Forecast, by Application 2020 & 2033
- Table 63: Rest of Middle East Stimulation Materials Market Revenue (billion) Forecast, by Application 2020 & 2033
- Table 64: Rest of Middle East Stimulation Materials Market Volume (K Tons) Forecast, by Application 2020 & 2033
Frequently Asked Questions
1. What is the projected Compound Annual Growth Rate (CAGR) of the Stimulation Materials Market?
The projected CAGR is approximately 9.4%.
2. Which companies are prominent players in the Stimulation Materials Market?
Key companies in the market include Mineracao Curimbaba Ltda, Ecolab, Chevron Phillips Chemicals Company, Solvay, All Energy Sand, Baker Hughes, Imerys, CoorsTek Inc, Baltic Ceramics Investments S A, Weatherford International plc , Saint-Gobain (Saint-Gobain Proppants), Halliburton, Royal Dutch Shell PLC, Carbo Ceramics Inc, Hi-Crush Inc, Badger Mining Corporation, Schlumberger Limited, Unimin Corporation, Hexion Inc.
3. What are the main segments of the Stimulation Materials Market?
The market segments include Material Type.
4. Can you provide details about the market size?
The market size is estimated to be USD 65.5 billion as of 2022.
5. What are some drivers contributing to market growth?
; Development of Unconventional Gas Resources; Increase in Mature Oilfields.
6. What are the notable trends driving market growth?
Proppants Segment to Dominate the Market Demand.
7. Are there any restraints impacting market growth?
; Environmental and Regulation Challenges.
8. Can you provide examples of recent developments in the market?
N/A
9. What pricing options are available for accessing the report?
Pricing options include single-user, multi-user, and enterprise licenses priced at USD 4750, USD 5250, and USD 8750 respectively.
10. Is the market size provided in terms of value or volume?
The market size is provided in terms of value, measured in billion and volume, measured in K Tons.
11. Are there any specific market keywords associated with the report?
Yes, the market keyword associated with the report is "Stimulation Materials Market," which aids in identifying and referencing the specific market segment covered.
12. How do I determine which pricing option suits my needs best?
The pricing options vary based on user requirements and access needs. Individual users may opt for single-user licenses, while businesses requiring broader access may choose multi-user or enterprise licenses for cost-effective access to the report.
13. Are there any additional resources or data provided in the Stimulation Materials Market report?
While the report offers comprehensive insights, it's advisable to review the specific contents or supplementary materials provided to ascertain if additional resources or data are available.
14. How can I stay updated on further developments or reports in the Stimulation Materials Market?
To stay informed about further developments, trends, and reports in the Stimulation Materials Market, consider subscribing to industry newsletters, following relevant companies and organizations, or regularly checking reputable industry news sources and publications.
Methodology
Step 1 - Identification of Relevant Samples Size from Population Database


Step 2 - Approaches for Defining Global Market Size (Value, Volume* & Price*)

Note*: In applicable scenarios
Step 3 - Data Sources
Primary Research
- Web Analytics
- Survey Reports
- Research Institute
- Latest Research Reports
- Opinion Leaders
Secondary Research
- Annual Reports
- White Paper
- Latest Press Release
- Industry Association
- Paid Database
- Investor Presentations

Step 4 - Data Triangulation
Involves using different sources of information in order to increase the validity of a study
These sources are likely to be stakeholders in a program - participants, other researchers, program staff, other community members, and so on.
Then we put all data in single framework & apply various statistical tools to find out the dynamic on the market.
During the analysis stage, feedback from the stakeholder groups would be compared to determine areas of agreement as well as areas of divergence