
Key Insights
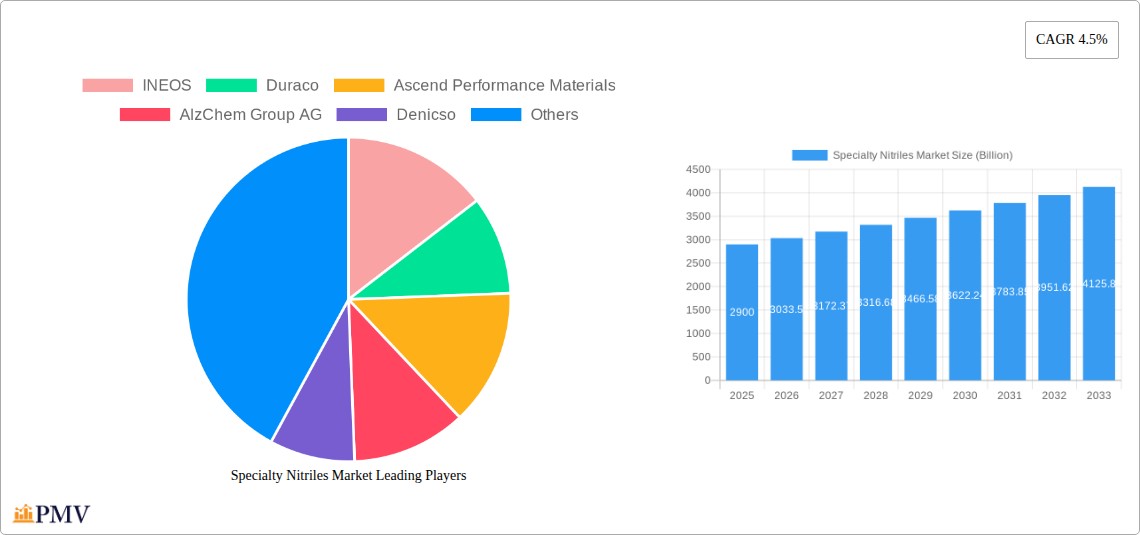
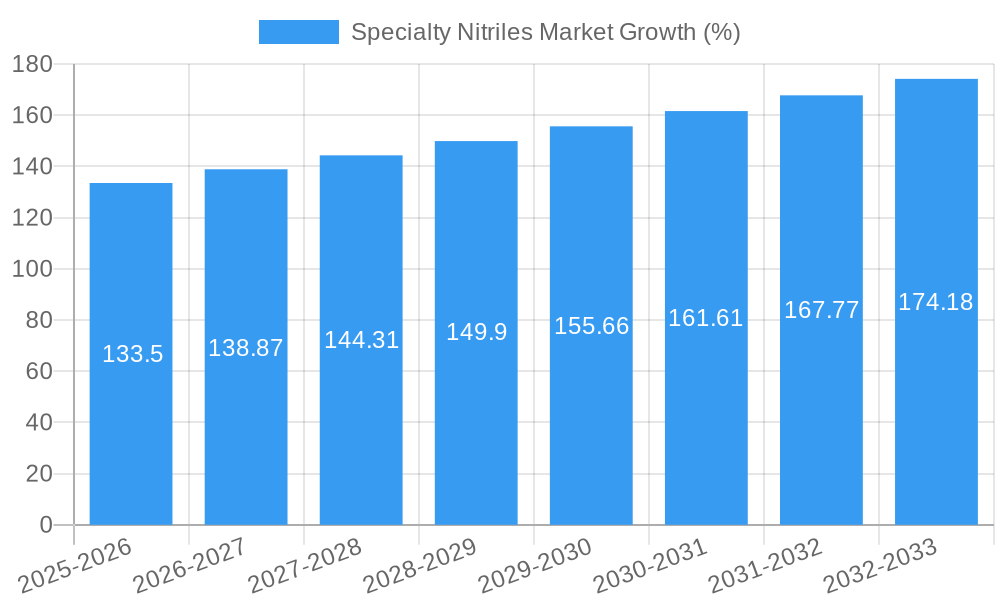
The global specialty nitriles market, valued at $2.9 billion in 2025, is projected to experience robust growth, driven by a compound annual growth rate (CAGR) of 4.5% from 2025 to 2033. This expansion is fueled by several key factors. The increasing demand for high-performance materials in diverse sectors such as automotive, electronics, and oilfield applications is a primary driver. The automotive industry's shift towards lighter and more fuel-efficient vehicles is boosting the demand for hydrogenated nitrile butadiene rubber (HNBR), a key specialty nitrile, known for its excellent oil and heat resistance. Similarly, the electronics sector's need for advanced sealing and insulation materials is propelling growth in nitrile butadiene rubber (NBR) applications. Further driving market expansion is the growing adoption of advanced manufacturing processes like ammoxidation and hydrocyanation, which enhance production efficiency and product quality. The market segmentation reveals that protective gloves, a major application segment, continues to be a significant contributor, alongside the steadily growing automotive and electronics components markets. However, potential restraints include fluctuating raw material prices and environmental concerns associated with certain manufacturing processes. This necessitates the development of more sustainable manufacturing methods and the exploration of alternative raw materials to mitigate these challenges and ensure long-term market stability.
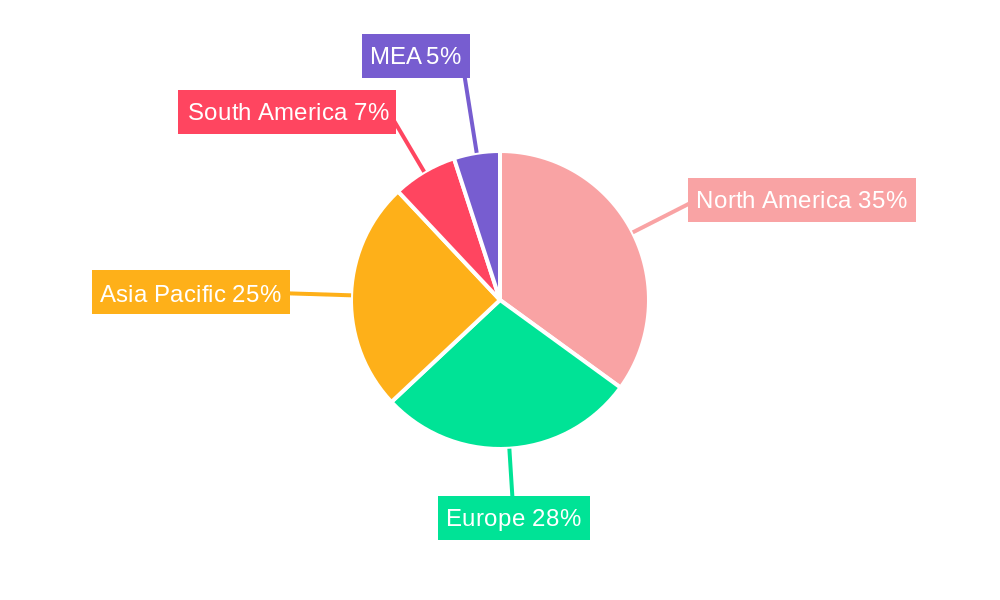
The geographical distribution of the market indicates strong performance across North America and Asia Pacific, with the US and China emerging as key markets. Europe also maintains a significant market share, driven by strong demand from the automotive and industrial sectors. Competitive dynamics are characterized by the presence of both large multinational corporations like INEOS and Ascend Performance Materials, and smaller specialized manufacturers. The competitive landscape is expected to remain dynamic with ongoing innovation in material properties and manufacturing technologies shaping future market trends. Future market growth will largely depend on technological advancements, the expansion of application areas, and the increasing adoption of sustainable manufacturing practices, which will shape the long-term trajectory of the specialty nitriles market.
Specialty Nitriles Market: A Comprehensive Analysis (2019-2033)
This in-depth report provides a comprehensive analysis of the global Specialty Nitriles Market, offering valuable insights for stakeholders across the value chain. With a study period spanning 2019-2033, a base year of 2025, and a forecast period of 2025-2033, this report meticulously examines market dynamics, competitive landscapes, and future growth trajectories. The total market size is projected to reach xx Billion by 2033, presenting significant opportunities for investment and expansion.
Specialty Nitriles Market Structure & Competitive Dynamics
This section analyzes the competitive landscape of the specialty nitriles market, examining market concentration, innovation ecosystems, regulatory frameworks, product substitutes, end-user trends, and M&A activities. The market exhibits a moderately concentrated structure, with key players holding significant market share. INEOS, Duraco, Ascend Performance Materials, and Zeon Chemicals LP are among the leading players, collectively controlling an estimated xx% of the market in 2025. The market is characterized by ongoing innovation in manufacturing processes and product development, driving competition. Regulatory frameworks related to environmental sustainability and worker safety are increasingly influencing industry practices. The substitution of specialty nitriles with alternative materials is limited due to the unique properties of nitriles in specific applications. End-user trends towards higher performance materials and stricter quality standards are driving demand. M&A activity has been moderate, with deal values averaging xx Billion in recent years, primarily focused on expanding geographic reach and product portfolios. Key aspects are:
- Market Concentration: Moderately concentrated, with top 5 players holding xx% market share (2025).
- Innovation: Focus on improved manufacturing processes (Ammoxidation, Hydrocyanation) and new product variations (e.g., higher-performance HNBR).
- Regulatory Landscape: Increasing emphasis on environmental compliance and worker safety.
- Substitutes: Limited viable substitutes due to the unique properties of specialty nitriles.
- End-User Trends: Demand driven by higher performance requirements and quality standards.
- M&A Activity: Moderate activity, with deals focused on geographic expansion and portfolio diversification.
Specialty Nitriles Market Industry Trends & Insights
The specialty nitriles market is poised for substantial growth, driven by increasing demand from diverse end-use sectors. The market is expected to witness a CAGR of xx% during the forecast period (2025-2033). This growth is fueled by several key factors: the rising adoption of specialty nitriles in high-performance applications such as automotive components, protective gloves, and oilfield applications; technological advancements in manufacturing processes leading to improved product quality and cost-effectiveness; and growing consumer preference for durable and high-performance products. Competitive dynamics are intense, with companies investing heavily in R&D to develop innovative products and expand their market share. Market penetration in emerging economies is expected to rise significantly as these markets develop. Technological disruptions, such as the adoption of advanced polymerization techniques, are reshaping the production landscape and enhancing product capabilities.
Dominant Markets & Segments in Specialty Nitriles Market
The North American region currently dominates the specialty nitriles market, driven by strong demand from the automotive and oilfield sectors. Within the market segments, Nitrile Butadiene Rubber (NBR) holds the largest share, followed by Hydrogenated Nitrile Butadiene Rubber (HNBR). The Ammoxidation manufacturing process currently holds a larger share than Hydrocyanation.
- Key Drivers of Regional Dominance (North America):
- Robust automotive and oil & gas industries.
- Established manufacturing infrastructure.
- Favorable regulatory environment.
- Key Drivers of Segment Dominance (NBR):
- Cost-effectiveness.
- Wide range of applications.
- Established supply chains.
- Key Drivers of Segment Dominance (Ammoxidation):
- Established technology.
- Lower capital investment compared to hydrocyanation.
The protective gloves application segment shows strong growth potential due to increasing demand from healthcare and industrial sectors. The automotive and oilfield sectors represent significant and stable markets, while electronic component applications are projected for rapid growth due to the miniaturization and performance requirements of electronics.
Specialty Nitriles Market Product Innovations
Recent innovations in specialty nitriles focus on enhancing product performance, particularly in terms of heat resistance, chemical resistance, and mechanical strength. These advancements are driven by technological trends such as the development of novel polymerization catalysts and the use of advanced characterization techniques. The market fit for these innovative products is strong, as end-users constantly seek improvements in product durability, reliability, and performance. New product formulations are constantly being introduced to match specialized applications.
Report Segmentation & Scope
This report segments the specialty nitriles market based on manufacturing process (Ammoxidation, Hydrocyanation), type (Nitrile Butadiene Rubber (NBR), Hydrogenated Nitrile Butadiene Rubber (HNBR), Others), and application (Protective Gloves, Automotive Components, Electronic Components, Adhesives & Sealants, Oilfield Applications, Others). Each segment is analyzed in detail, providing insights into market size, growth projections, and competitive dynamics. For example, the NBR segment is expected to experience robust growth due to its cost-effectiveness and versatility, while the HNBR segment is projected to witness faster growth driven by its superior performance properties. The Ammoxidation process currently dominates but Hydrocyanation is gaining traction due to its ability to produce specialty nitriles with specific properties. Application segments demonstrate varying growth rates, with protective gloves and automotive components leading in terms of volume, while electronic components and oilfield applications are driving value growth.
Key Drivers of Specialty Nitriles Market Growth
Several factors are driving the growth of the specialty nitriles market. Technological advancements in manufacturing processes have led to improved product quality and reduced production costs. The increasing demand for high-performance materials in various end-use sectors, such as automotive and healthcare, is fueling market growth. Furthermore, favorable government regulations and supportive economic policies in key regions are fostering market expansion. Specific examples include the growing adoption of electric vehicles, requiring specialized nitrile-based seals and components, and the increasing need for personal protective equipment (PPE) in healthcare settings.
Challenges in the Specialty Nitriles Market Sector
Despite the positive growth outlook, the specialty nitriles market faces several challenges. Fluctuations in raw material prices can impact profitability, and stringent environmental regulations can increase production costs. Intense competition among existing players and the emergence of new entrants put pressure on margins. Supply chain disruptions can affect production and delivery timelines. Quantifiable impacts include price volatility resulting in a xx% variation in profit margins (estimated) and supply chain disruptions leading to a xx% decrease in production capacity in specific instances.
Leading Players in the Specialty Nitriles Market Market
- INEOS https://www.ineos.com/
- Duraco
- Ascend Performance Materials https://www.ascendmaterials.com/
- AlzChem Group AG https://www.alzchem.com/
- Denicso
- Speciality Tapes
- TIDI Products LLC
- Emerald Performance Materials https://www.emeraldmaterials.com/
- Parchem fine & specialty chemicals
- Marco Rubber & Plastics LLC
- Zeon Chemicals LP https://www.zeon.co.jp/en/
Key Developments in Specialty Nitriles Market Sector
- January 2023: INEOS announced a significant expansion of its nitrile production capacity.
- June 2022: Ascend Performance Materials launched a new line of high-performance HNBR.
- October 2021: A joint venture between Duraco and another company was formed to produce specialized nitriles for a niche market. (Further specifics on this are not available)
Strategic Specialty Nitriles Market Outlook
The specialty nitriles market presents significant opportunities for future growth, driven by the increasing demand for high-performance materials in diverse applications. Strategic initiatives, such as investments in R&D to develop new products and manufacturing processes, expansion into emerging markets, and strategic partnerships and collaborations, will be crucial for success. The market's growth will be influenced by factors such as technological advancements, raw material price fluctuations, and evolving regulatory landscapes. Companies that can effectively navigate these factors and proactively adapt to market changes are likely to gain a competitive edge and capitalize on the considerable growth potential within this sector.
Specialty Nitriles Market Segmentation
-
1. Manufacturing Process
- 1.1. Ammoxidation
- 1.2. Hydrocyanation
-
2. Types
- 2.1. Nitrile Butadiene Rubber
- 2.2. Hydrogenated Nitrile Butadiene Rubber
- 2.3. Others
-
3. Application
- 3.1. Protective Gloves
- 3.2. Automotive Components
- 3.3. Electronic Components
- 3.4. Adhesives & Sealants
- 3.5. Oilfield Applications
- 3.6. Others
Specialty Nitriles Market Segmentation By Geography
-
1. Asia Pacific
- 1.1. China
- 1.2. India
- 1.3. Japan
- 1.4. South Korea
- 1.5. Rest of Asia Pacific
-
2. North America
- 2.1. United States
- 2.2. Canada
- 2.3. Mexico
-
3. Europe
- 3.1. Germany
- 3.2. United Kingdom
- 3.3. France
- 3.4. Italy
- 3.5. Rest of Europe
-
4. South America
- 4.1. Brazil
- 4.2. Argentina
- 4.3. Rest of South America
-
5. Middle East and Africa
- 5.1. Saudi Arabia
- 5.2. South Africa
- 5.3. Rest of Middle East and Africa
Specialty Nitriles Market REPORT HIGHLIGHTS
| Aspects | Details |
|---|---|
| Study Period | 2019-2033 |
| Base Year | 2024 |
| Estimated Year | 2025 |
| Forecast Period | 2025-2033 |
| Historical Period | 2019-2024 |
| Growth Rate | CAGR of 4.5% from 2019-2033 |
| Segmentation |
|
Table of Contents
- 1. Introduction
- 1.1. Research Scope
- 1.2. Market Segmentation
- 1.3. Research Methodology
- 1.4. Definitions and Assumptions
- 2. Executive Summary
- 2.1. Introduction
- 3. Market Dynamics
- 3.1. Introduction
- 3.2. Market Drivers
- 3.2.1. ; Growing Applications in Automotive Industry; Others Drivers
- 3.3. Market Restrains
- 3.3.1. ; Health Hazard related to Nitrile Fumes; Unfavorable Conditions Arising Due to COVID-19 Outbreak
- 3.4. Market Trends
- 3.4.1. Automotive Components to Dominate the Market
- 4. Market Factor Analysis
- 4.1. Porters Five Forces
- 4.2. Supply/Value Chain
- 4.3. PESTEL analysis
- 4.4. Market Entropy
- 4.5. Patent/Trademark Analysis
- 5. Global Specialty Nitriles Market Analysis, Insights and Forecast, 2019-2031
- 5.1. Market Analysis, Insights and Forecast - by Manufacturing Process
- 5.1.1. Ammoxidation
- 5.1.2. Hydrocyanation
- 5.2. Market Analysis, Insights and Forecast - by Types
- 5.2.1. Nitrile Butadiene Rubber
- 5.2.2. Hydrogenated Nitrile Butadiene Rubber
- 5.2.3. Others
- 5.3. Market Analysis, Insights and Forecast - by Application
- 5.3.1. Protective Gloves
- 5.3.2. Automotive Components
- 5.3.3. Electronic Components
- 5.3.4. Adhesives & Sealants
- 5.3.5. Oilfield Applications
- 5.3.6. Others
- 5.4. Market Analysis, Insights and Forecast - by Region
- 5.4.1. Asia Pacific
- 5.4.2. North America
- 5.4.3. Europe
- 5.4.4. South America
- 5.4.5. Middle East and Africa
- 5.1. Market Analysis, Insights and Forecast - by Manufacturing Process
- 6. Asia Pacific Specialty Nitriles Market Analysis, Insights and Forecast, 2019-2031
- 6.1. Market Analysis, Insights and Forecast - by Manufacturing Process
- 6.1.1. Ammoxidation
- 6.1.2. Hydrocyanation
- 6.2. Market Analysis, Insights and Forecast - by Types
- 6.2.1. Nitrile Butadiene Rubber
- 6.2.2. Hydrogenated Nitrile Butadiene Rubber
- 6.2.3. Others
- 6.3. Market Analysis, Insights and Forecast - by Application
- 6.3.1. Protective Gloves
- 6.3.2. Automotive Components
- 6.3.3. Electronic Components
- 6.3.4. Adhesives & Sealants
- 6.3.5. Oilfield Applications
- 6.3.6. Others
- 6.1. Market Analysis, Insights and Forecast - by Manufacturing Process
- 7. North America Specialty Nitriles Market Analysis, Insights and Forecast, 2019-2031
- 7.1. Market Analysis, Insights and Forecast - by Manufacturing Process
- 7.1.1. Ammoxidation
- 7.1.2. Hydrocyanation
- 7.2. Market Analysis, Insights and Forecast - by Types
- 7.2.1. Nitrile Butadiene Rubber
- 7.2.2. Hydrogenated Nitrile Butadiene Rubber
- 7.2.3. Others
- 7.3. Market Analysis, Insights and Forecast - by Application
- 7.3.1. Protective Gloves
- 7.3.2. Automotive Components
- 7.3.3. Electronic Components
- 7.3.4. Adhesives & Sealants
- 7.3.5. Oilfield Applications
- 7.3.6. Others
- 7.1. Market Analysis, Insights and Forecast - by Manufacturing Process
- 8. Europe Specialty Nitriles Market Analysis, Insights and Forecast, 2019-2031
- 8.1. Market Analysis, Insights and Forecast - by Manufacturing Process
- 8.1.1. Ammoxidation
- 8.1.2. Hydrocyanation
- 8.2. Market Analysis, Insights and Forecast - by Types
- 8.2.1. Nitrile Butadiene Rubber
- 8.2.2. Hydrogenated Nitrile Butadiene Rubber
- 8.2.3. Others
- 8.3. Market Analysis, Insights and Forecast - by Application
- 8.3.1. Protective Gloves
- 8.3.2. Automotive Components
- 8.3.3. Electronic Components
- 8.3.4. Adhesives & Sealants
- 8.3.5. Oilfield Applications
- 8.3.6. Others
- 8.1. Market Analysis, Insights and Forecast - by Manufacturing Process
- 9. South America Specialty Nitriles Market Analysis, Insights and Forecast, 2019-2031
- 9.1. Market Analysis, Insights and Forecast - by Manufacturing Process
- 9.1.1. Ammoxidation
- 9.1.2. Hydrocyanation
- 9.2. Market Analysis, Insights and Forecast - by Types
- 9.2.1. Nitrile Butadiene Rubber
- 9.2.2. Hydrogenated Nitrile Butadiene Rubber
- 9.2.3. Others
- 9.3. Market Analysis, Insights and Forecast - by Application
- 9.3.1. Protective Gloves
- 9.3.2. Automotive Components
- 9.3.3. Electronic Components
- 9.3.4. Adhesives & Sealants
- 9.3.5. Oilfield Applications
- 9.3.6. Others
- 9.1. Market Analysis, Insights and Forecast - by Manufacturing Process
- 10. Middle East and Africa Specialty Nitriles Market Analysis, Insights and Forecast, 2019-2031
- 10.1. Market Analysis, Insights and Forecast - by Manufacturing Process
- 10.1.1. Ammoxidation
- 10.1.2. Hydrocyanation
- 10.2. Market Analysis, Insights and Forecast - by Types
- 10.2.1. Nitrile Butadiene Rubber
- 10.2.2. Hydrogenated Nitrile Butadiene Rubber
- 10.2.3. Others
- 10.3. Market Analysis, Insights and Forecast - by Application
- 10.3.1. Protective Gloves
- 10.3.2. Automotive Components
- 10.3.3. Electronic Components
- 10.3.4. Adhesives & Sealants
- 10.3.5. Oilfield Applications
- 10.3.6. Others
- 10.1. Market Analysis, Insights and Forecast - by Manufacturing Process
- 11. North America Specialty Nitriles Market Analysis, Insights and Forecast, 2019-2031
- 11.1. Market Analysis, Insights and Forecast - By Country/Sub-region
- 11.1.1 United States
- 11.1.2 Canada
- 11.1.3 Mexico
- 12. Europe Specialty Nitriles Market Analysis, Insights and Forecast, 2019-2031
- 12.1. Market Analysis, Insights and Forecast - By Country/Sub-region
- 12.1.1 Germany
- 12.1.2 France
- 12.1.3 Italy
- 12.1.4 United Kingdom
- 12.1.5 Netherlands
- 12.1.6 Rest of Europe
- 13. Asia Pacific Specialty Nitriles Market Analysis, Insights and Forecast, 2019-2031
- 13.1. Market Analysis, Insights and Forecast - By Country/Sub-region
- 13.1.1 China
- 13.1.2 Japan
- 13.1.3 India
- 13.1.4 South Korea
- 13.1.5 Taiwan
- 13.1.6 Australia
- 13.1.7 Rest of Asia-Pacific
- 14. South America Specialty Nitriles Market Analysis, Insights and Forecast, 2019-2031
- 14.1. Market Analysis, Insights and Forecast - By Country/Sub-region
- 14.1.1 Brazil
- 14.1.2 Argentina
- 14.1.3 Rest of South America
- 15. MEA Specialty Nitriles Market Analysis, Insights and Forecast, 2019-2031
- 15.1. Market Analysis, Insights and Forecast - By Country/Sub-region
- 15.1.1 Middle East
- 15.1.2 Africa
- 16. Competitive Analysis
- 16.1. Global Market Share Analysis 2024
- 16.2. Company Profiles
- 16.2.1 INEOS
- 16.2.1.1. Overview
- 16.2.1.2. Products
- 16.2.1.3. SWOT Analysis
- 16.2.1.4. Recent Developments
- 16.2.1.5. Financials (Based on Availability)
- 16.2.2 Duraco
- 16.2.2.1. Overview
- 16.2.2.2. Products
- 16.2.2.3. SWOT Analysis
- 16.2.2.4. Recent Developments
- 16.2.2.5. Financials (Based on Availability)
- 16.2.3 Ascend Performance Materials
- 16.2.3.1. Overview
- 16.2.3.2. Products
- 16.2.3.3. SWOT Analysis
- 16.2.3.4. Recent Developments
- 16.2.3.5. Financials (Based on Availability)
- 16.2.4 AlzChem Group AG
- 16.2.4.1. Overview
- 16.2.4.2. Products
- 16.2.4.3. SWOT Analysis
- 16.2.4.4. Recent Developments
- 16.2.4.5. Financials (Based on Availability)
- 16.2.5 Denicso
- 16.2.5.1. Overview
- 16.2.5.2. Products
- 16.2.5.3. SWOT Analysis
- 16.2.5.4. Recent Developments
- 16.2.5.5. Financials (Based on Availability)
- 16.2.6 Speciality Tapes
- 16.2.6.1. Overview
- 16.2.6.2. Products
- 16.2.6.3. SWOT Analysis
- 16.2.6.4. Recent Developments
- 16.2.6.5. Financials (Based on Availability)
- 16.2.7 TIDI Products LLC
- 16.2.7.1. Overview
- 16.2.7.2. Products
- 16.2.7.3. SWOT Analysis
- 16.2.7.4. Recent Developments
- 16.2.7.5. Financials (Based on Availability)
- 16.2.8 Emerald Performance Materials
- 16.2.8.1. Overview
- 16.2.8.2. Products
- 16.2.8.3. SWOT Analysis
- 16.2.8.4. Recent Developments
- 16.2.8.5. Financials (Based on Availability)
- 16.2.9 Parchem fine & specialty chemicals
- 16.2.9.1. Overview
- 16.2.9.2. Products
- 16.2.9.3. SWOT Analysis
- 16.2.9.4. Recent Developments
- 16.2.9.5. Financials (Based on Availability)
- 16.2.10 Marco Rubber & Plastics LLC
- 16.2.10.1. Overview
- 16.2.10.2. Products
- 16.2.10.3. SWOT Analysis
- 16.2.10.4. Recent Developments
- 16.2.10.5. Financials (Based on Availability)
- 16.2.11 Zeon Chemicals L P
- 16.2.11.1. Overview
- 16.2.11.2. Products
- 16.2.11.3. SWOT Analysis
- 16.2.11.4. Recent Developments
- 16.2.11.5. Financials (Based on Availability)
- 16.2.1 INEOS
List of Figures
- Figure 1: Global Specialty Nitriles Market Revenue Breakdown (Billion, %) by Region 2024 & 2032
- Figure 2: Global Specialty Nitriles Market Volume Breakdown (K Tons, %) by Region 2024 & 2032
- Figure 3: North America Specialty Nitriles Market Revenue (Billion), by Country 2024 & 2032
- Figure 4: North America Specialty Nitriles Market Volume (K Tons), by Country 2024 & 2032
- Figure 5: North America Specialty Nitriles Market Revenue Share (%), by Country 2024 & 2032
- Figure 6: North America Specialty Nitriles Market Volume Share (%), by Country 2024 & 2032
- Figure 7: Europe Specialty Nitriles Market Revenue (Billion), by Country 2024 & 2032
- Figure 8: Europe Specialty Nitriles Market Volume (K Tons), by Country 2024 & 2032
- Figure 9: Europe Specialty Nitriles Market Revenue Share (%), by Country 2024 & 2032
- Figure 10: Europe Specialty Nitriles Market Volume Share (%), by Country 2024 & 2032
- Figure 11: Asia Pacific Specialty Nitriles Market Revenue (Billion), by Country 2024 & 2032
- Figure 12: Asia Pacific Specialty Nitriles Market Volume (K Tons), by Country 2024 & 2032
- Figure 13: Asia Pacific Specialty Nitriles Market Revenue Share (%), by Country 2024 & 2032
- Figure 14: Asia Pacific Specialty Nitriles Market Volume Share (%), by Country 2024 & 2032
- Figure 15: South America Specialty Nitriles Market Revenue (Billion), by Country 2024 & 2032
- Figure 16: South America Specialty Nitriles Market Volume (K Tons), by Country 2024 & 2032
- Figure 17: South America Specialty Nitriles Market Revenue Share (%), by Country 2024 & 2032
- Figure 18: South America Specialty Nitriles Market Volume Share (%), by Country 2024 & 2032
- Figure 19: MEA Specialty Nitriles Market Revenue (Billion), by Country 2024 & 2032
- Figure 20: MEA Specialty Nitriles Market Volume (K Tons), by Country 2024 & 2032
- Figure 21: MEA Specialty Nitriles Market Revenue Share (%), by Country 2024 & 2032
- Figure 22: MEA Specialty Nitriles Market Volume Share (%), by Country 2024 & 2032
- Figure 23: Asia Pacific Specialty Nitriles Market Revenue (Billion), by Manufacturing Process 2024 & 2032
- Figure 24: Asia Pacific Specialty Nitriles Market Volume (K Tons), by Manufacturing Process 2024 & 2032
- Figure 25: Asia Pacific Specialty Nitriles Market Revenue Share (%), by Manufacturing Process 2024 & 2032
- Figure 26: Asia Pacific Specialty Nitriles Market Volume Share (%), by Manufacturing Process 2024 & 2032
- Figure 27: Asia Pacific Specialty Nitriles Market Revenue (Billion), by Types 2024 & 2032
- Figure 28: Asia Pacific Specialty Nitriles Market Volume (K Tons), by Types 2024 & 2032
- Figure 29: Asia Pacific Specialty Nitriles Market Revenue Share (%), by Types 2024 & 2032
- Figure 30: Asia Pacific Specialty Nitriles Market Volume Share (%), by Types 2024 & 2032
- Figure 31: Asia Pacific Specialty Nitriles Market Revenue (Billion), by Application 2024 & 2032
- Figure 32: Asia Pacific Specialty Nitriles Market Volume (K Tons), by Application 2024 & 2032
- Figure 33: Asia Pacific Specialty Nitriles Market Revenue Share (%), by Application 2024 & 2032
- Figure 34: Asia Pacific Specialty Nitriles Market Volume Share (%), by Application 2024 & 2032
- Figure 35: Asia Pacific Specialty Nitriles Market Revenue (Billion), by Country 2024 & 2032
- Figure 36: Asia Pacific Specialty Nitriles Market Volume (K Tons), by Country 2024 & 2032
- Figure 37: Asia Pacific Specialty Nitriles Market Revenue Share (%), by Country 2024 & 2032
- Figure 38: Asia Pacific Specialty Nitriles Market Volume Share (%), by Country 2024 & 2032
- Figure 39: North America Specialty Nitriles Market Revenue (Billion), by Manufacturing Process 2024 & 2032
- Figure 40: North America Specialty Nitriles Market Volume (K Tons), by Manufacturing Process 2024 & 2032
- Figure 41: North America Specialty Nitriles Market Revenue Share (%), by Manufacturing Process 2024 & 2032
- Figure 42: North America Specialty Nitriles Market Volume Share (%), by Manufacturing Process 2024 & 2032
- Figure 43: North America Specialty Nitriles Market Revenue (Billion), by Types 2024 & 2032
- Figure 44: North America Specialty Nitriles Market Volume (K Tons), by Types 2024 & 2032
- Figure 45: North America Specialty Nitriles Market Revenue Share (%), by Types 2024 & 2032
- Figure 46: North America Specialty Nitriles Market Volume Share (%), by Types 2024 & 2032
- Figure 47: North America Specialty Nitriles Market Revenue (Billion), by Application 2024 & 2032
- Figure 48: North America Specialty Nitriles Market Volume (K Tons), by Application 2024 & 2032
- Figure 49: North America Specialty Nitriles Market Revenue Share (%), by Application 2024 & 2032
- Figure 50: North America Specialty Nitriles Market Volume Share (%), by Application 2024 & 2032
- Figure 51: North America Specialty Nitriles Market Revenue (Billion), by Country 2024 & 2032
- Figure 52: North America Specialty Nitriles Market Volume (K Tons), by Country 2024 & 2032
- Figure 53: North America Specialty Nitriles Market Revenue Share (%), by Country 2024 & 2032
- Figure 54: North America Specialty Nitriles Market Volume Share (%), by Country 2024 & 2032
- Figure 55: Europe Specialty Nitriles Market Revenue (Billion), by Manufacturing Process 2024 & 2032
- Figure 56: Europe Specialty Nitriles Market Volume (K Tons), by Manufacturing Process 2024 & 2032
- Figure 57: Europe Specialty Nitriles Market Revenue Share (%), by Manufacturing Process 2024 & 2032
- Figure 58: Europe Specialty Nitriles Market Volume Share (%), by Manufacturing Process 2024 & 2032
- Figure 59: Europe Specialty Nitriles Market Revenue (Billion), by Types 2024 & 2032
- Figure 60: Europe Specialty Nitriles Market Volume (K Tons), by Types 2024 & 2032
- Figure 61: Europe Specialty Nitriles Market Revenue Share (%), by Types 2024 & 2032
- Figure 62: Europe Specialty Nitriles Market Volume Share (%), by Types 2024 & 2032
- Figure 63: Europe Specialty Nitriles Market Revenue (Billion), by Application 2024 & 2032
- Figure 64: Europe Specialty Nitriles Market Volume (K Tons), by Application 2024 & 2032
- Figure 65: Europe Specialty Nitriles Market Revenue Share (%), by Application 2024 & 2032
- Figure 66: Europe Specialty Nitriles Market Volume Share (%), by Application 2024 & 2032
- Figure 67: Europe Specialty Nitriles Market Revenue (Billion), by Country 2024 & 2032
- Figure 68: Europe Specialty Nitriles Market Volume (K Tons), by Country 2024 & 2032
- Figure 69: Europe Specialty Nitriles Market Revenue Share (%), by Country 2024 & 2032
- Figure 70: Europe Specialty Nitriles Market Volume Share (%), by Country 2024 & 2032
- Figure 71: South America Specialty Nitriles Market Revenue (Billion), by Manufacturing Process 2024 & 2032
- Figure 72: South America Specialty Nitriles Market Volume (K Tons), by Manufacturing Process 2024 & 2032
- Figure 73: South America Specialty Nitriles Market Revenue Share (%), by Manufacturing Process 2024 & 2032
- Figure 74: South America Specialty Nitriles Market Volume Share (%), by Manufacturing Process 2024 & 2032
- Figure 75: South America Specialty Nitriles Market Revenue (Billion), by Types 2024 & 2032
- Figure 76: South America Specialty Nitriles Market Volume (K Tons), by Types 2024 & 2032
- Figure 77: South America Specialty Nitriles Market Revenue Share (%), by Types 2024 & 2032
- Figure 78: South America Specialty Nitriles Market Volume Share (%), by Types 2024 & 2032
- Figure 79: South America Specialty Nitriles Market Revenue (Billion), by Application 2024 & 2032
- Figure 80: South America Specialty Nitriles Market Volume (K Tons), by Application 2024 & 2032
- Figure 81: South America Specialty Nitriles Market Revenue Share (%), by Application 2024 & 2032
- Figure 82: South America Specialty Nitriles Market Volume Share (%), by Application 2024 & 2032
- Figure 83: South America Specialty Nitriles Market Revenue (Billion), by Country 2024 & 2032
- Figure 84: South America Specialty Nitriles Market Volume (K Tons), by Country 2024 & 2032
- Figure 85: South America Specialty Nitriles Market Revenue Share (%), by Country 2024 & 2032
- Figure 86: South America Specialty Nitriles Market Volume Share (%), by Country 2024 & 2032
- Figure 87: Middle East and Africa Specialty Nitriles Market Revenue (Billion), by Manufacturing Process 2024 & 2032
- Figure 88: Middle East and Africa Specialty Nitriles Market Volume (K Tons), by Manufacturing Process 2024 & 2032
- Figure 89: Middle East and Africa Specialty Nitriles Market Revenue Share (%), by Manufacturing Process 2024 & 2032
- Figure 90: Middle East and Africa Specialty Nitriles Market Volume Share (%), by Manufacturing Process 2024 & 2032
- Figure 91: Middle East and Africa Specialty Nitriles Market Revenue (Billion), by Types 2024 & 2032
- Figure 92: Middle East and Africa Specialty Nitriles Market Volume (K Tons), by Types 2024 & 2032
- Figure 93: Middle East and Africa Specialty Nitriles Market Revenue Share (%), by Types 2024 & 2032
- Figure 94: Middle East and Africa Specialty Nitriles Market Volume Share (%), by Types 2024 & 2032
- Figure 95: Middle East and Africa Specialty Nitriles Market Revenue (Billion), by Application 2024 & 2032
- Figure 96: Middle East and Africa Specialty Nitriles Market Volume (K Tons), by Application 2024 & 2032
- Figure 97: Middle East and Africa Specialty Nitriles Market Revenue Share (%), by Application 2024 & 2032
- Figure 98: Middle East and Africa Specialty Nitriles Market Volume Share (%), by Application 2024 & 2032
- Figure 99: Middle East and Africa Specialty Nitriles Market Revenue (Billion), by Country 2024 & 2032
- Figure 100: Middle East and Africa Specialty Nitriles Market Volume (K Tons), by Country 2024 & 2032
- Figure 101: Middle East and Africa Specialty Nitriles Market Revenue Share (%), by Country 2024 & 2032
- Figure 102: Middle East and Africa Specialty Nitriles Market Volume Share (%), by Country 2024 & 2032
List of Tables
- Table 1: Global Specialty Nitriles Market Revenue Billion Forecast, by Region 2019 & 2032
- Table 2: Global Specialty Nitriles Market Volume K Tons Forecast, by Region 2019 & 2032
- Table 3: Global Specialty Nitriles Market Revenue Billion Forecast, by Manufacturing Process 2019 & 2032
- Table 4: Global Specialty Nitriles Market Volume K Tons Forecast, by Manufacturing Process 2019 & 2032
- Table 5: Global Specialty Nitriles Market Revenue Billion Forecast, by Types 2019 & 2032
- Table 6: Global Specialty Nitriles Market Volume K Tons Forecast, by Types 2019 & 2032
- Table 7: Global Specialty Nitriles Market Revenue Billion Forecast, by Application 2019 & 2032
- Table 8: Global Specialty Nitriles Market Volume K Tons Forecast, by Application 2019 & 2032
- Table 9: Global Specialty Nitriles Market Revenue Billion Forecast, by Region 2019 & 2032
- Table 10: Global Specialty Nitriles Market Volume K Tons Forecast, by Region 2019 & 2032
- Table 11: Global Specialty Nitriles Market Revenue Billion Forecast, by Country 2019 & 2032
- Table 12: Global Specialty Nitriles Market Volume K Tons Forecast, by Country 2019 & 2032
- Table 13: United States Specialty Nitriles Market Revenue (Billion) Forecast, by Application 2019 & 2032
- Table 14: United States Specialty Nitriles Market Volume (K Tons) Forecast, by Application 2019 & 2032
- Table 15: Canada Specialty Nitriles Market Revenue (Billion) Forecast, by Application 2019 & 2032
- Table 16: Canada Specialty Nitriles Market Volume (K Tons) Forecast, by Application 2019 & 2032
- Table 17: Mexico Specialty Nitriles Market Revenue (Billion) Forecast, by Application 2019 & 2032
- Table 18: Mexico Specialty Nitriles Market Volume (K Tons) Forecast, by Application 2019 & 2032
- Table 19: Global Specialty Nitriles Market Revenue Billion Forecast, by Country 2019 & 2032
- Table 20: Global Specialty Nitriles Market Volume K Tons Forecast, by Country 2019 & 2032
- Table 21: Germany Specialty Nitriles Market Revenue (Billion) Forecast, by Application 2019 & 2032
- Table 22: Germany Specialty Nitriles Market Volume (K Tons) Forecast, by Application 2019 & 2032
- Table 23: France Specialty Nitriles Market Revenue (Billion) Forecast, by Application 2019 & 2032
- Table 24: France Specialty Nitriles Market Volume (K Tons) Forecast, by Application 2019 & 2032
- Table 25: Italy Specialty Nitriles Market Revenue (Billion) Forecast, by Application 2019 & 2032
- Table 26: Italy Specialty Nitriles Market Volume (K Tons) Forecast, by Application 2019 & 2032
- Table 27: United Kingdom Specialty Nitriles Market Revenue (Billion) Forecast, by Application 2019 & 2032
- Table 28: United Kingdom Specialty Nitriles Market Volume (K Tons) Forecast, by Application 2019 & 2032
- Table 29: Netherlands Specialty Nitriles Market Revenue (Billion) Forecast, by Application 2019 & 2032
- Table 30: Netherlands Specialty Nitriles Market Volume (K Tons) Forecast, by Application 2019 & 2032
- Table 31: Rest of Europe Specialty Nitriles Market Revenue (Billion) Forecast, by Application 2019 & 2032
- Table 32: Rest of Europe Specialty Nitriles Market Volume (K Tons) Forecast, by Application 2019 & 2032
- Table 33: Global Specialty Nitriles Market Revenue Billion Forecast, by Country 2019 & 2032
- Table 34: Global Specialty Nitriles Market Volume K Tons Forecast, by Country 2019 & 2032
- Table 35: China Specialty Nitriles Market Revenue (Billion) Forecast, by Application 2019 & 2032
- Table 36: China Specialty Nitriles Market Volume (K Tons) Forecast, by Application 2019 & 2032
- Table 37: Japan Specialty Nitriles Market Revenue (Billion) Forecast, by Application 2019 & 2032
- Table 38: Japan Specialty Nitriles Market Volume (K Tons) Forecast, by Application 2019 & 2032
- Table 39: India Specialty Nitriles Market Revenue (Billion) Forecast, by Application 2019 & 2032
- Table 40: India Specialty Nitriles Market Volume (K Tons) Forecast, by Application 2019 & 2032
- Table 41: South Korea Specialty Nitriles Market Revenue (Billion) Forecast, by Application 2019 & 2032
- Table 42: South Korea Specialty Nitriles Market Volume (K Tons) Forecast, by Application 2019 & 2032
- Table 43: Taiwan Specialty Nitriles Market Revenue (Billion) Forecast, by Application 2019 & 2032
- Table 44: Taiwan Specialty Nitriles Market Volume (K Tons) Forecast, by Application 2019 & 2032
- Table 45: Australia Specialty Nitriles Market Revenue (Billion) Forecast, by Application 2019 & 2032
- Table 46: Australia Specialty Nitriles Market Volume (K Tons) Forecast, by Application 2019 & 2032
- Table 47: Rest of Asia-Pacific Specialty Nitriles Market Revenue (Billion) Forecast, by Application 2019 & 2032
- Table 48: Rest of Asia-Pacific Specialty Nitriles Market Volume (K Tons) Forecast, by Application 2019 & 2032
- Table 49: Global Specialty Nitriles Market Revenue Billion Forecast, by Country 2019 & 2032
- Table 50: Global Specialty Nitriles Market Volume K Tons Forecast, by Country 2019 & 2032
- Table 51: Brazil Specialty Nitriles Market Revenue (Billion) Forecast, by Application 2019 & 2032
- Table 52: Brazil Specialty Nitriles Market Volume (K Tons) Forecast, by Application 2019 & 2032
- Table 53: Argentina Specialty Nitriles Market Revenue (Billion) Forecast, by Application 2019 & 2032
- Table 54: Argentina Specialty Nitriles Market Volume (K Tons) Forecast, by Application 2019 & 2032
- Table 55: Rest of South America Specialty Nitriles Market Revenue (Billion) Forecast, by Application 2019 & 2032
- Table 56: Rest of South America Specialty Nitriles Market Volume (K Tons) Forecast, by Application 2019 & 2032
- Table 57: Global Specialty Nitriles Market Revenue Billion Forecast, by Country 2019 & 2032
- Table 58: Global Specialty Nitriles Market Volume K Tons Forecast, by Country 2019 & 2032
- Table 59: Middle East Specialty Nitriles Market Revenue (Billion) Forecast, by Application 2019 & 2032
- Table 60: Middle East Specialty Nitriles Market Volume (K Tons) Forecast, by Application 2019 & 2032
- Table 61: Africa Specialty Nitriles Market Revenue (Billion) Forecast, by Application 2019 & 2032
- Table 62: Africa Specialty Nitriles Market Volume (K Tons) Forecast, by Application 2019 & 2032
- Table 63: Global Specialty Nitriles Market Revenue Billion Forecast, by Manufacturing Process 2019 & 2032
- Table 64: Global Specialty Nitriles Market Volume K Tons Forecast, by Manufacturing Process 2019 & 2032
- Table 65: Global Specialty Nitriles Market Revenue Billion Forecast, by Types 2019 & 2032
- Table 66: Global Specialty Nitriles Market Volume K Tons Forecast, by Types 2019 & 2032
- Table 67: Global Specialty Nitriles Market Revenue Billion Forecast, by Application 2019 & 2032
- Table 68: Global Specialty Nitriles Market Volume K Tons Forecast, by Application 2019 & 2032
- Table 69: Global Specialty Nitriles Market Revenue Billion Forecast, by Country 2019 & 2032
- Table 70: Global Specialty Nitriles Market Volume K Tons Forecast, by Country 2019 & 2032
- Table 71: China Specialty Nitriles Market Revenue (Billion) Forecast, by Application 2019 & 2032
- Table 72: China Specialty Nitriles Market Volume (K Tons) Forecast, by Application 2019 & 2032
- Table 73: India Specialty Nitriles Market Revenue (Billion) Forecast, by Application 2019 & 2032
- Table 74: India Specialty Nitriles Market Volume (K Tons) Forecast, by Application 2019 & 2032
- Table 75: Japan Specialty Nitriles Market Revenue (Billion) Forecast, by Application 2019 & 2032
- Table 76: Japan Specialty Nitriles Market Volume (K Tons) Forecast, by Application 2019 & 2032
- Table 77: South Korea Specialty Nitriles Market Revenue (Billion) Forecast, by Application 2019 & 2032
- Table 78: South Korea Specialty Nitriles Market Volume (K Tons) Forecast, by Application 2019 & 2032
- Table 79: Rest of Asia Pacific Specialty Nitriles Market Revenue (Billion) Forecast, by Application 2019 & 2032
- Table 80: Rest of Asia Pacific Specialty Nitriles Market Volume (K Tons) Forecast, by Application 2019 & 2032
- Table 81: Global Specialty Nitriles Market Revenue Billion Forecast, by Manufacturing Process 2019 & 2032
- Table 82: Global Specialty Nitriles Market Volume K Tons Forecast, by Manufacturing Process 2019 & 2032
- Table 83: Global Specialty Nitriles Market Revenue Billion Forecast, by Types 2019 & 2032
- Table 84: Global Specialty Nitriles Market Volume K Tons Forecast, by Types 2019 & 2032
- Table 85: Global Specialty Nitriles Market Revenue Billion Forecast, by Application 2019 & 2032
- Table 86: Global Specialty Nitriles Market Volume K Tons Forecast, by Application 2019 & 2032
- Table 87: Global Specialty Nitriles Market Revenue Billion Forecast, by Country 2019 & 2032
- Table 88: Global Specialty Nitriles Market Volume K Tons Forecast, by Country 2019 & 2032
- Table 89: United States Specialty Nitriles Market Revenue (Billion) Forecast, by Application 2019 & 2032
- Table 90: United States Specialty Nitriles Market Volume (K Tons) Forecast, by Application 2019 & 2032
- Table 91: Canada Specialty Nitriles Market Revenue (Billion) Forecast, by Application 2019 & 2032
- Table 92: Canada Specialty Nitriles Market Volume (K Tons) Forecast, by Application 2019 & 2032
- Table 93: Mexico Specialty Nitriles Market Revenue (Billion) Forecast, by Application 2019 & 2032
- Table 94: Mexico Specialty Nitriles Market Volume (K Tons) Forecast, by Application 2019 & 2032
- Table 95: Global Specialty Nitriles Market Revenue Billion Forecast, by Manufacturing Process 2019 & 2032
- Table 96: Global Specialty Nitriles Market Volume K Tons Forecast, by Manufacturing Process 2019 & 2032
- Table 97: Global Specialty Nitriles Market Revenue Billion Forecast, by Types 2019 & 2032
- Table 98: Global Specialty Nitriles Market Volume K Tons Forecast, by Types 2019 & 2032
- Table 99: Global Specialty Nitriles Market Revenue Billion Forecast, by Application 2019 & 2032
- Table 100: Global Specialty Nitriles Market Volume K Tons Forecast, by Application 2019 & 2032
- Table 101: Global Specialty Nitriles Market Revenue Billion Forecast, by Country 2019 & 2032
- Table 102: Global Specialty Nitriles Market Volume K Tons Forecast, by Country 2019 & 2032
- Table 103: Germany Specialty Nitriles Market Revenue (Billion) Forecast, by Application 2019 & 2032
- Table 104: Germany Specialty Nitriles Market Volume (K Tons) Forecast, by Application 2019 & 2032
- Table 105: United Kingdom Specialty Nitriles Market Revenue (Billion) Forecast, by Application 2019 & 2032
- Table 106: United Kingdom Specialty Nitriles Market Volume (K Tons) Forecast, by Application 2019 & 2032
- Table 107: France Specialty Nitriles Market Revenue (Billion) Forecast, by Application 2019 & 2032
- Table 108: France Specialty Nitriles Market Volume (K Tons) Forecast, by Application 2019 & 2032
- Table 109: Italy Specialty Nitriles Market Revenue (Billion) Forecast, by Application 2019 & 2032
- Table 110: Italy Specialty Nitriles Market Volume (K Tons) Forecast, by Application 2019 & 2032
- Table 111: Rest of Europe Specialty Nitriles Market Revenue (Billion) Forecast, by Application 2019 & 2032
- Table 112: Rest of Europe Specialty Nitriles Market Volume (K Tons) Forecast, by Application 2019 & 2032
- Table 113: Global Specialty Nitriles Market Revenue Billion Forecast, by Manufacturing Process 2019 & 2032
- Table 114: Global Specialty Nitriles Market Volume K Tons Forecast, by Manufacturing Process 2019 & 2032
- Table 115: Global Specialty Nitriles Market Revenue Billion Forecast, by Types 2019 & 2032
- Table 116: Global Specialty Nitriles Market Volume K Tons Forecast, by Types 2019 & 2032
- Table 117: Global Specialty Nitriles Market Revenue Billion Forecast, by Application 2019 & 2032
- Table 118: Global Specialty Nitriles Market Volume K Tons Forecast, by Application 2019 & 2032
- Table 119: Global Specialty Nitriles Market Revenue Billion Forecast, by Country 2019 & 2032
- Table 120: Global Specialty Nitriles Market Volume K Tons Forecast, by Country 2019 & 2032
- Table 121: Brazil Specialty Nitriles Market Revenue (Billion) Forecast, by Application 2019 & 2032
- Table 122: Brazil Specialty Nitriles Market Volume (K Tons) Forecast, by Application 2019 & 2032
- Table 123: Argentina Specialty Nitriles Market Revenue (Billion) Forecast, by Application 2019 & 2032
- Table 124: Argentina Specialty Nitriles Market Volume (K Tons) Forecast, by Application 2019 & 2032
- Table 125: Rest of South America Specialty Nitriles Market Revenue (Billion) Forecast, by Application 2019 & 2032
- Table 126: Rest of South America Specialty Nitriles Market Volume (K Tons) Forecast, by Application 2019 & 2032
- Table 127: Global Specialty Nitriles Market Revenue Billion Forecast, by Manufacturing Process 2019 & 2032
- Table 128: Global Specialty Nitriles Market Volume K Tons Forecast, by Manufacturing Process 2019 & 2032
- Table 129: Global Specialty Nitriles Market Revenue Billion Forecast, by Types 2019 & 2032
- Table 130: Global Specialty Nitriles Market Volume K Tons Forecast, by Types 2019 & 2032
- Table 131: Global Specialty Nitriles Market Revenue Billion Forecast, by Application 2019 & 2032
- Table 132: Global Specialty Nitriles Market Volume K Tons Forecast, by Application 2019 & 2032
- Table 133: Global Specialty Nitriles Market Revenue Billion Forecast, by Country 2019 & 2032
- Table 134: Global Specialty Nitriles Market Volume K Tons Forecast, by Country 2019 & 2032
- Table 135: Saudi Arabia Specialty Nitriles Market Revenue (Billion) Forecast, by Application 2019 & 2032
- Table 136: Saudi Arabia Specialty Nitriles Market Volume (K Tons) Forecast, by Application 2019 & 2032
- Table 137: South Africa Specialty Nitriles Market Revenue (Billion) Forecast, by Application 2019 & 2032
- Table 138: South Africa Specialty Nitriles Market Volume (K Tons) Forecast, by Application 2019 & 2032
- Table 139: Rest of Middle East and Africa Specialty Nitriles Market Revenue (Billion) Forecast, by Application 2019 & 2032
- Table 140: Rest of Middle East and Africa Specialty Nitriles Market Volume (K Tons) Forecast, by Application 2019 & 2032
Frequently Asked Questions
1. What is the projected Compound Annual Growth Rate (CAGR) of the Specialty Nitriles Market?
The projected CAGR is approximately 4.5%.
2. Which companies are prominent players in the Specialty Nitriles Market?
Key companies in the market include INEOS, Duraco, Ascend Performance Materials, AlzChem Group AG, Denicso, Speciality Tapes, TIDI Products LLC, Emerald Performance Materials, Parchem fine & specialty chemicals, Marco Rubber & Plastics LLC, Zeon Chemicals L P .
3. What are the main segments of the Specialty Nitriles Market?
The market segments include Manufacturing Process, Types, Application.
4. Can you provide details about the market size?
The market size is estimated to be USD 2.9 Billion as of 2022.
5. What are some drivers contributing to market growth?
; Growing Applications in Automotive Industry; Others Drivers.
6. What are the notable trends driving market growth?
Automotive Components to Dominate the Market.
7. Are there any restraints impacting market growth?
; Health Hazard related to Nitrile Fumes; Unfavorable Conditions Arising Due to COVID-19 Outbreak.
8. Can you provide examples of recent developments in the market?
N/A
9. What pricing options are available for accessing the report?
Pricing options include single-user, multi-user, and enterprise licenses priced at USD 4750, USD 5250, and USD 8750 respectively.
10. Is the market size provided in terms of value or volume?
The market size is provided in terms of value, measured in Billion and volume, measured in K Tons.
11. Are there any specific market keywords associated with the report?
Yes, the market keyword associated with the report is "Specialty Nitriles Market," which aids in identifying and referencing the specific market segment covered.
12. How do I determine which pricing option suits my needs best?
The pricing options vary based on user requirements and access needs. Individual users may opt for single-user licenses, while businesses requiring broader access may choose multi-user or enterprise licenses for cost-effective access to the report.
13. Are there any additional resources or data provided in the Specialty Nitriles Market report?
While the report offers comprehensive insights, it's advisable to review the specific contents or supplementary materials provided to ascertain if additional resources or data are available.
14. How can I stay updated on further developments or reports in the Specialty Nitriles Market?
To stay informed about further developments, trends, and reports in the Specialty Nitriles Market, consider subscribing to industry newsletters, following relevant companies and organizations, or regularly checking reputable industry news sources and publications.
Methodology
Step 1 - Identification of Relevant Samples Size from Population Database


Step 2 - Approaches for Defining Global Market Size (Value, Volume* & Price*)

Note*: In applicable scenarios
Step 3 - Data Sources
Primary Research
- Web Analytics
- Survey Reports
- Research Institute
- Latest Research Reports
- Opinion Leaders
Secondary Research
- Annual Reports
- White Paper
- Latest Press Release
- Industry Association
- Paid Database
- Investor Presentations

Step 4 - Data Triangulation
Involves using different sources of information in order to increase the validity of a study
These sources are likely to be stakeholders in a program - participants, other researchers, program staff, other community members, and so on.
Then we put all data in single framework & apply various statistical tools to find out the dynamic on the market.
During the analysis stage, feedback from the stakeholder groups would be compared to determine areas of agreement as well as areas of divergence


