

Key Insights
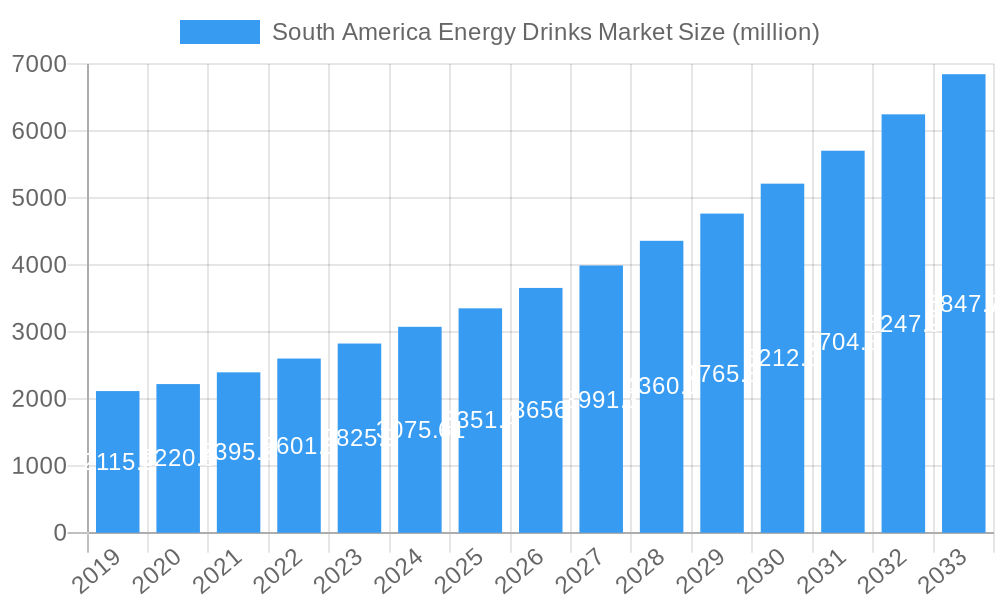
The South America energy drinks market is poised for significant growth, projected to reach USD 3075.61 million by 2024, exhibiting a robust Compound Annual Growth Rate (CAGR) of 8.2% throughout the forecast period. This expansion is primarily fueled by an increasing consumer demand for beverages that offer enhanced physical and mental performance, driven by busy lifestyles, a growing health and wellness consciousness, and the rising popularity of energy drinks among younger demographics and athletes. The market's dynamism is further supported by innovative product launches, including sugar-free and natural ingredient options, catering to evolving consumer preferences and health concerns. Strategic marketing campaigns and the expanding distribution networks, particularly in on-trade establishments and convenience stores, are also instrumental in driving market penetration and accessibility across the region.
South America Energy Drinks Market Market Size (In Billion)
Key growth drivers for the South America energy drinks market include a rising disposable income across major economies, leading to increased consumer spending on premium and performance-enhancing beverages. The expansion of the e-commerce sector is also playing a crucial role, offering consumers greater convenience and accessibility to a wider array of energy drink products. While the market benefits from these positive trends, potential restraints such as increasing regulatory scrutiny regarding health claims and ingredient transparency, as well as intense competition from established global players and emerging local brands, necessitate continuous innovation and strategic differentiation. Segments like 'Drinks' and 'Shots' are expected to witness considerable demand, with 'Bottle (PET/Glass)' and 'Cans' dominating packaging types. Geographically, Brazil and Argentina are anticipated to be the leading markets, with the 'Rest of South America' also contributing to the overall growth trajectory.
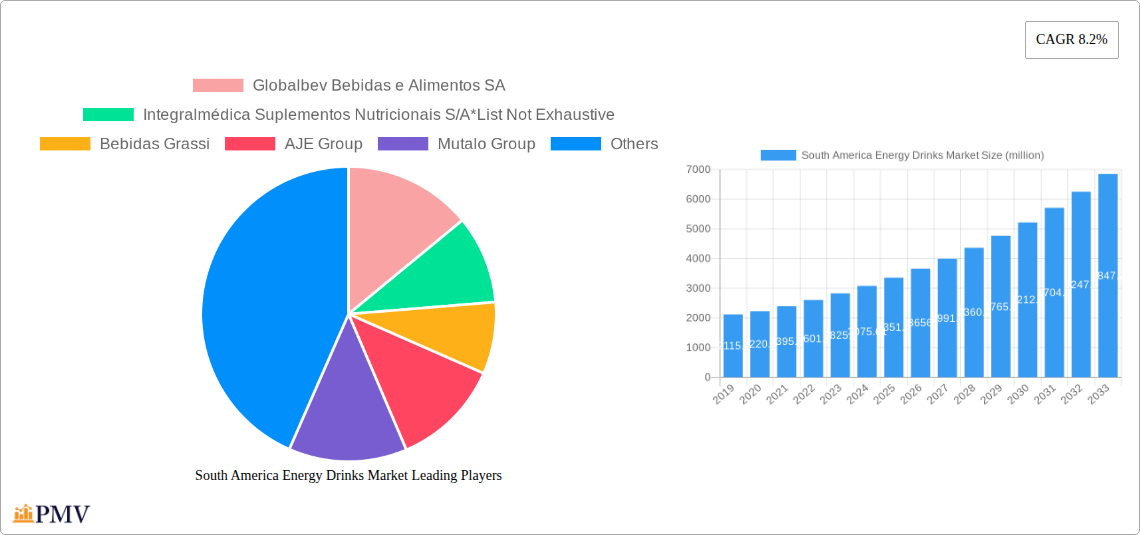
South America Energy Drinks Market Company Market Share
This in-depth report offers a detailed analysis of the South America Energy Drinks Market, providing critical insights into market dynamics, consumer behavior, competitive landscapes, and future growth trajectories. Covering the period from 2019 to 2033, with a base year of 2025, this report is an indispensable resource for stakeholders seeking to understand and capitalize on the burgeoning opportunities within this vibrant sector. Dive deep into market segmentation, identify key growth drivers and challenges, and gain a strategic outlook for the next decade.
South America Energy Drinks Market Market Structure & Competitive Dynamics
The South America energy drinks market is characterized by a dynamic and evolving competitive landscape, featuring both global giants and robust regional players. Market concentration is moderately high, with established brands holding significant market share, particularly in dominant geographies like Brazil. Innovation remains a key differentiator, with companies actively investing in R&D to introduce novel formulations and flavors catering to diverse consumer preferences. The regulatory framework, while generally supportive, requires adherence to specific labeling and ingredient standards across different countries. Product substitutes, including functional beverages and traditional soft drinks, exert competitive pressure, necessitating continuous product differentiation and value proposition enhancement. End-user trends point towards increasing demand for natural ingredients, functional benefits beyond energy enhancement (e.g., focus, immunity), and sustainable packaging. Mergers and acquisitions (M&A) activities, while not as frequent as in some mature markets, are strategic tools for market expansion and portfolio diversification. For instance, recent M&A activities in the broader beverage sector indicate a trend towards consolidation. The market share for the top 5 players is estimated to be around 60% in 2025, with M&A deal values for significant acquisitions in the regional beverage industry reaching hundreds of millions of dollars.
South America Energy Drinks Market Industry Trends & Insights
The South America energy drinks market is poised for substantial growth, driven by a confluence of factors including rising disposable incomes, increasing urbanization, and a growing awareness of the functional benefits associated with energy drinks. The market is projected to witness a Compound Annual Growth Rate (CAGR) of approximately 7.5% from 2025 to 2033. Technological disruptions are playing a pivotal role, with advancements in ingredient sourcing and manufacturing processes enabling the development of healthier and more functional formulations. Consumer preferences are shifting towards natural ingredients, reduced sugar content, and unique flavor profiles, compelling manufacturers to innovate their product offerings. The competitive dynamics are intensifying, with both international corporations and agile local brands vying for market share. Online retail channels are experiencing significant expansion, offering consumers greater convenience and access to a wider array of products. The market penetration of energy drinks in South America is currently around 15% and is expected to grow steadily. The increasing adoption of active lifestyles and the demand for on-the-go beverage solutions are further fueling market expansion. Furthermore, the influence of social media and influencer marketing is shaping consumer perceptions and driving product trial. The market is witnessing a rise in specialized energy drinks targeting specific demographics, such as gamers and athletes, with tailored formulations and branding.
Dominant Markets & Segments in South America Energy Drinks Market
Brazil stands as the dominant market within the South America energy drinks landscape, accounting for an estimated 45% of the total market share in 2025. This dominance is attributed to its large population, robust economic activity, and a well-established beverage industry. The Drinks segment, encompassing standard energy beverages, is the largest product type, holding approximately 70% of the market share. Within packaging, Cans are the preferred choice, representing about 55% of the market due to their convenience, portability, and recyclability. The Off-trade distribution channel, particularly Supermarkets/Hypermarkets, commands the lion's share, with an estimated 60% market penetration, driven by widespread availability and competitive pricing.
Key drivers for Brazil's dominance include:
- Economic Policies: Favorable trade agreements and government initiatives promoting domestic production.
- Infrastructure: Extensive retail networks and efficient logistics facilitating widespread distribution.
- Consumer Behavior: A culture that embraces convenience and readily adopts new beverage trends.
The Argentina market is the second-largest contributor, representing approximately 20% of the South American energy drinks market. Its growth is influenced by a young demographic and increasing demand for energy-boosting products. The Rest of South America, comprising countries like Colombia, Chile, and Peru, collectively forms the third-largest segment, with a growing market share of 35%. This segment offers significant untapped potential due to increasing disposable incomes and evolving consumer lifestyles.
Analyzing product type, Shots are witnessing a surge in popularity, driven by their convenience and concentrated energy boost, with an estimated market share of 15%. Mixers are also carving out a niche, catering to the growing cocktail culture. In terms of packaging, while cans dominate, Bottle (PET/Glass) packaging maintains a significant presence, especially for larger formats and premium offerings. The On-trade channel, including bars and restaurants, accounts for a substantial portion of sales, particularly for energy drink-based cocktails and mixed drinks, representing an estimated 30% of the market. Online Retail Stores are emerging as a rapidly growing distribution channel, especially in urban centers, facilitating direct-to-consumer sales and offering a wider product selection, projected to reach 15% market share by 2028.
South America Energy Drinks Market Product Innovations
Product innovation in the South America energy drinks market is primarily focused on enhancing functional benefits and catering to evolving consumer health consciousness. Companies are introducing energy drinks with added vitamins, natural caffeine sources (like guarana and yerba mate), and nootropic ingredients to improve cognitive function and focus. The development of low-sugar and sugar-free options is a significant trend, addressing concerns about sugar intake. Furthermore, unique flavor fusions and exotic fruit extracts are being incorporated to offer novel taste experiences. Competitively, these innovations provide a distinct advantage by appealing to a wider consumer base and differentiating brands in a crowded marketplace.
Report Segmentation & Scope
This report meticulously segments the South America energy drinks market across key dimensions to provide granular insights. The Product Type segmentation includes Drinks, Shots, and Mixers, each analyzed for market size, growth projections, and competitive dynamics. The Packaging Type segmentation covers Bottles (PET/Glass) and Cans, along with other packaging types, offering insights into consumer preferences and manufacturing trends. The Distribution Channel is dissected into On-trade and Off-trade, with further sub-segmentation of Off-trade into Supermarkets/Hypermarkets, Convenience Stores, Online Retail Stores, and Other Off-trade Channels, highlighting varying market penetration and growth rates. Geographically, the market is analyzed across Brazil, Argentina, and the Rest of South America, with detailed forecasts and competitive analysis for each region.
Key Drivers of South America Energy Drinks Market Growth
Several key factors are propelling the growth of the South America energy drinks market. Economically, rising disposable incomes and a growing middle class in countries like Brazil and Colombia are increasing consumer spending on premium and convenience beverages. Technologically, advancements in ingredient formulation, including the incorporation of natural caffeine sources and functional additives, are creating healthier and more appealing products. Regulatory frameworks, while requiring adherence to quality standards, have generally been supportive of market expansion, with some countries implementing initiatives to promote the beverage industry. The increasing adoption of active lifestyles and the demand for convenient energy solutions for work, study, and leisure activities are also significant drivers.
Challenges in the South America Energy Drinks Market Sector
Despite the robust growth, the South America energy drinks market faces several challenges. Regulatory hurdles related to ingredient approvals and marketing claims can vary significantly between countries, posing complexities for regional players. Intense competition from established global brands and an influx of local entrants can lead to price wars and margin erosion. Supply chain disruptions, particularly in raw material sourcing and logistics, can impact production and distribution efficiency. Furthermore, growing consumer concerns regarding the health implications of high sugar and artificial ingredient content necessitate continuous reformulation and transparent labeling to maintain consumer trust and market access.
Leading Players in the South America Energy Drinks Market Market
- Globalbev Bebidas e Alimentos SA
- Integralmédica Suplementos Nutricionais S/A
- Bebidas Grassi
- AJE Group
- Mutalo Group
- PepsiCo Inc
- Red Bull GmbH
- The Coca-Cola Company
- Anheuser-Busch InBev SA/NV (Ambev SA)
- Grupo Petrópolis
Key Developments in South America Energy Drinks Market Sector
- November 2022: Grupo Petrópolis launched a range of fruit-based energy drinks under the brand name TNT Energy Drink. The first flavor of the extended product line is Mango Summer, which consists of a mix of fruits with a high presence of mango flavor. It is available in 473ml and 269ml cans in the South American market.
- May 2022: Coca-Cola's energy drink company Monster Beverage Corporation launched multiple new products across South America. The company launched VR46 The Doctor in Argentina and expanded its product offering in Chile by introducing Melon Mania Lemon Heads and Organce Dreamsicle. Additionally, the company launched Monster Mango Loco in Colombia and Monster Ultra Gold in Puerto Rico.
- February 2022: Acer Inc., a Taiwan-based hardware and electronic gadgets manufacturer launched the PredatorShot energy drink for gamers in Brazil. The company claims that it contains taurine and caffeine which stimulate concentration and deliver more energy to the players during online matches. The product has been introduced in the country with a price of USD 7.42 (pack of 6 cans of 269 ml) which can be purchased through the online Acer online store.
Strategic South America Energy Drinks Market Market Outlook
The strategic outlook for the South America energy drinks market is highly positive, driven by sustained consumer demand and ongoing innovation. Opportunities lie in expanding into underserved regions within the "Rest of South America" and focusing on emerging distribution channels like online retail and convenience stores. Strategic partnerships with local distributors and a focus on product localization, including unique flavor profiles and culturally relevant marketing campaigns, will be crucial for success. The growing trend towards functional beverages beyond mere energy, such as those promoting mental clarity and physical performance, presents a significant avenue for growth. Companies that prioritize sustainability in packaging and ethical sourcing of ingredients will likely gain a competitive edge and resonate with an increasingly conscious consumer base.
South America Energy Drinks Market Segmentation
-
1. Product Type
- 1.1. Drinks
- 1.2. Shots
- 1.3. Mixers
-
2. Packaging Type
- 2.1. Bottle (Pet/Glass)
- 2.2. Cans
- 2.3. Other Packaging Types
-
3. Distribution Channel
- 3.1. On-trade
-
3.2. Off-trade
- 3.2.1. Supermarkets/Hypermarkets
- 3.2.2. Convenience Stores
- 3.2.3. Online Retail Stores
- 3.2.4. Other Off-trade Channels
-
4. Geography
- 4.1. Brazil
- 4.2. Argentina
- 4.3. Rest of South America
South America Energy Drinks Market Segmentation By Geography
- 1. Brazil
- 2. Argentina
- 3. Rest of South America
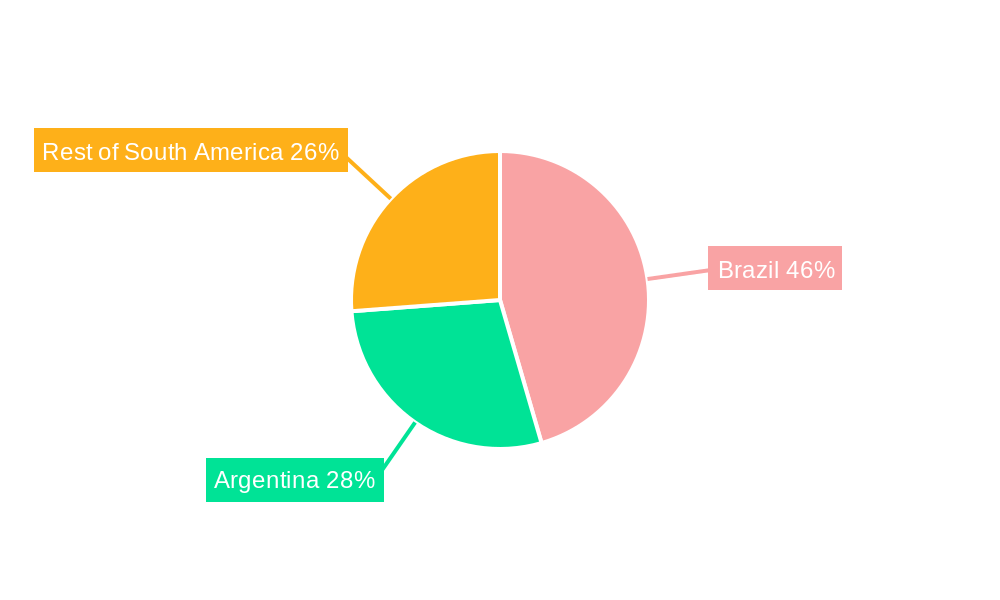
South America Energy Drinks Market Regional Market Share
Geographic Coverage of South America Energy Drinks Market
South America Energy Drinks Market REPORT HIGHLIGHTS
| Aspects | Details |
|---|---|
| Study Period | 2020-2034 |
| Base Year | 2025 |
| Estimated Year | 2026 |
| Forecast Period | 2026-2034 |
| Historical Period | 2020-2025 |
| Growth Rate | CAGR of 8.2% from 2020-2034 |
| Segmentation |
|
Table of Contents
- 1. Introduction
- 1.1. Research Scope
- 1.2. Market Segmentation
- 1.3. Research Objective
- 1.4. Definitions and Assumptions
- 2. Executive Summary
- 2.1. Market Snapshot
- 3. Market Dynamics
- 3.1. Market Drivers
- 3.2. Market Restrains
- 3.3. Market Trends
- 3.4. Market Opportunities
- 4. Market Factor Analysis
- 4.1. Porters Five Forces
- 4.1.1. Bargaining Power of Suppliers
- 4.1.2. Bargaining Power of Buyers
- 4.1.3. Threat of New Entrants
- 4.1.4. Threat of Substitutes
- 4.1.5. Competitive Rivalry
- 4.2. PESTEL analysis
- 4.3. BCG Analysis
- 4.3.1. Stars (High Growth, High Market Share)
- 4.3.2. Cash Cows (Low Growth, High Market Share)
- 4.3.3. Question Mark (High Growth, Low Market Share)
- 4.3.4. Dogs (Low Growth, Low Market Share)
- 4.4. Ansoff Matrix Analysis
- 4.5. Supply Chain Analysis
- 4.6. Regulatory Landscape
- 4.7. Current Market Potential and Opportunity Assessment (TAM–SAM–SOM Framework)
- 4.8. PMV Analyst Note
- 4.1. Porters Five Forces
- 5. Market Analysis, Insights and Forecast 2021-2033
- 5.1. Market Analysis, Insights and Forecast - by Product Type
- 5.1.1. Drinks
- 5.1.2. Shots
- 5.1.3. Mixers
- 5.2. Market Analysis, Insights and Forecast - by Packaging Type
- 5.2.1. Bottle (Pet/Glass)
- 5.2.2. Cans
- 5.2.3. Other Packaging Types
- 5.3. Market Analysis, Insights and Forecast - by Distribution Channel
- 5.3.1. On-trade
- 5.3.2. Off-trade
- 5.3.2.1. Supermarkets/Hypermarkets
- 5.3.2.2. Convenience Stores
- 5.3.2.3. Online Retail Stores
- 5.3.2.4. Other Off-trade Channels
- 5.4. Market Analysis, Insights and Forecast - by Geography
- 5.4.1. Brazil
- 5.4.2. Argentina
- 5.4.3. Rest of South America
- 5.5. Market Analysis, Insights and Forecast - by Region
- 5.5.1. Brazil
- 5.5.2. Argentina
- 5.5.3. Rest of South America
- 5.1. Market Analysis, Insights and Forecast - by Product Type
- 6. South America Energy Drinks Market Analysis, Insights and Forecast, 2021-2033
- 6.1. Market Analysis, Insights and Forecast - by Product Type
- 6.1.1. Drinks
- 6.1.2. Shots
- 6.1.3. Mixers
- 6.2. Market Analysis, Insights and Forecast - by Packaging Type
- 6.2.1. Bottle (Pet/Glass)
- 6.2.2. Cans
- 6.2.3. Other Packaging Types
- 6.3. Market Analysis, Insights and Forecast - by Distribution Channel
- 6.3.1. On-trade
- 6.3.2. Off-trade
- 6.3.2.1. Supermarkets/Hypermarkets
- 6.3.2.2. Convenience Stores
- 6.3.2.3. Online Retail Stores
- 6.3.2.4. Other Off-trade Channels
- 6.4. Market Analysis, Insights and Forecast - by Geography
- 6.4.1. Brazil
- 6.4.2. Argentina
- 6.4.3. Rest of South America
- 6.1. Market Analysis, Insights and Forecast - by Product Type
- 7. Brazil South America Energy Drinks Market Analysis, Insights and Forecast, 2020-2032
- 7.1. Market Analysis, Insights and Forecast - by Product Type
- 7.1.1. Drinks
- 7.1.2. Shots
- 7.1.3. Mixers
- 7.2. Market Analysis, Insights and Forecast - by Packaging Type
- 7.2.1. Bottle (Pet/Glass)
- 7.2.2. Cans
- 7.2.3. Other Packaging Types
- 7.3. Market Analysis, Insights and Forecast - by Distribution Channel
- 7.3.1. On-trade
- 7.3.2. Off-trade
- 7.3.2.1. Supermarkets/Hypermarkets
- 7.3.2.2. Convenience Stores
- 7.3.2.3. Online Retail Stores
- 7.3.2.4. Other Off-trade Channels
- 7.4. Market Analysis, Insights and Forecast - by Geography
- 7.4.1. Brazil
- 7.4.2. Argentina
- 7.4.3. Rest of South America
- 7.1. Market Analysis, Insights and Forecast - by Product Type
- 8. Argentina South America Energy Drinks Market Analysis, Insights and Forecast, 2020-2032
- 8.1. Market Analysis, Insights and Forecast - by Product Type
- 8.1.1. Drinks
- 8.1.2. Shots
- 8.1.3. Mixers
- 8.2. Market Analysis, Insights and Forecast - by Packaging Type
- 8.2.1. Bottle (Pet/Glass)
- 8.2.2. Cans
- 8.2.3. Other Packaging Types
- 8.3. Market Analysis, Insights and Forecast - by Distribution Channel
- 8.3.1. On-trade
- 8.3.2. Off-trade
- 8.3.2.1. Supermarkets/Hypermarkets
- 8.3.2.2. Convenience Stores
- 8.3.2.3. Online Retail Stores
- 8.3.2.4. Other Off-trade Channels
- 8.4. Market Analysis, Insights and Forecast - by Geography
- 8.4.1. Brazil
- 8.4.2. Argentina
- 8.4.3. Rest of South America
- 8.1. Market Analysis, Insights and Forecast - by Product Type
- 9. Rest of South America South America Energy Drinks Market Analysis, Insights and Forecast, 2020-2032
- 9.1. Market Analysis, Insights and Forecast - by Product Type
- 9.1.1. Drinks
- 9.1.2. Shots
- 9.1.3. Mixers
- 9.2. Market Analysis, Insights and Forecast - by Packaging Type
- 9.2.1. Bottle (Pet/Glass)
- 9.2.2. Cans
- 9.2.3. Other Packaging Types
- 9.3. Market Analysis, Insights and Forecast - by Distribution Channel
- 9.3.1. On-trade
- 9.3.2. Off-trade
- 9.3.2.1. Supermarkets/Hypermarkets
- 9.3.2.2. Convenience Stores
- 9.3.2.3. Online Retail Stores
- 9.3.2.4. Other Off-trade Channels
- 9.4. Market Analysis, Insights and Forecast - by Geography
- 9.4.1. Brazil
- 9.4.2. Argentina
- 9.4.3. Rest of South America
- 9.1. Market Analysis, Insights and Forecast - by Product Type
- 10. Competitive Analysis
- 10.1. Company Profiles
- 10.1.1 Globalbev Bebidas e Alimentos SA
- 10.1.1.1. Company Overview
- 10.1.1.2. Products
- 10.1.1.3. Company Financials
- 10.1.1.4. SWOT Analysis
- 10.1.2 Integralmédica Suplementos Nutricionais S/A*List Not Exhaustive
- 10.1.2.1. Company Overview
- 10.1.2.2. Products
- 10.1.2.3. Company Financials
- 10.1.2.4. SWOT Analysis
- 10.1.3 Bebidas Grassi
- 10.1.3.1. Company Overview
- 10.1.3.2. Products
- 10.1.3.3. Company Financials
- 10.1.3.4. SWOT Analysis
- 10.1.4 AJE Group
- 10.1.4.1. Company Overview
- 10.1.4.2. Products
- 10.1.4.3. Company Financials
- 10.1.4.4. SWOT Analysis
- 10.1.5 Mutalo Group
- 10.1.5.1. Company Overview
- 10.1.5.2. Products
- 10.1.5.3. Company Financials
- 10.1.5.4. SWOT Analysis
- 10.1.6 PepsiCo Inc
- 10.1.6.1. Company Overview
- 10.1.6.2. Products
- 10.1.6.3. Company Financials
- 10.1.6.4. SWOT Analysis
- 10.1.7 Red Bull GmbH
- 10.1.7.1. Company Overview
- 10.1.7.2. Products
- 10.1.7.3. Company Financials
- 10.1.7.4. SWOT Analysis
- 10.1.8 The Coca-Cola Company
- 10.1.8.1. Company Overview
- 10.1.8.2. Products
- 10.1.8.3. Company Financials
- 10.1.8.4. SWOT Analysis
- 10.1.9 Anheuser-Busch InBev SA/NV (Ambev SA)
- 10.1.9.1. Company Overview
- 10.1.9.2. Products
- 10.1.9.3. Company Financials
- 10.1.9.4. SWOT Analysis
- 10.1.10 Grupo Petrópolis
- 10.1.10.1. Company Overview
- 10.1.10.2. Products
- 10.1.10.3. Company Financials
- 10.1.10.4. SWOT Analysis
- 10.1.1 Globalbev Bebidas e Alimentos SA
- 10.2. Market Entropy
- 10.2.1 Company's Key Areas Served
- 10.2.2 Recent Developments
- 10.3. Company Market Share Analysis 2025
- 10.3.1 Top 5 Companies Market Share Analysis
- 10.3.2 Top 3 Companies Market Share Analysis
- 10.4. List of Potential Customers
- 11. Research Methodology
List of Figures
- Figure 1: South America Energy Drinks Market Revenue Breakdown (million, %) by Product 2025 & 2033
- Figure 2: South America Energy Drinks Market Share (%) by Company 2025
List of Tables
- Table 1: South America Energy Drinks Market Revenue million Forecast, by Product Type 2020 & 2033
- Table 2: South America Energy Drinks Market Revenue million Forecast, by Packaging Type 2020 & 2033
- Table 3: South America Energy Drinks Market Revenue million Forecast, by Distribution Channel 2020 & 2033
- Table 4: South America Energy Drinks Market Revenue million Forecast, by Geography 2020 & 2033
- Table 5: South America Energy Drinks Market Revenue million Forecast, by Region 2020 & 2033
- Table 6: South America Energy Drinks Market Revenue million Forecast, by Product Type 2020 & 2033
- Table 7: South America Energy Drinks Market Revenue million Forecast, by Packaging Type 2020 & 2033
- Table 8: South America Energy Drinks Market Revenue million Forecast, by Distribution Channel 2020 & 2033
- Table 9: South America Energy Drinks Market Revenue million Forecast, by Geography 2020 & 2033
- Table 10: South America Energy Drinks Market Revenue million Forecast, by Country 2020 & 2033
- Table 11: South America Energy Drinks Market Revenue million Forecast, by Product Type 2020 & 2033
- Table 12: South America Energy Drinks Market Revenue million Forecast, by Packaging Type 2020 & 2033
- Table 13: South America Energy Drinks Market Revenue million Forecast, by Distribution Channel 2020 & 2033
- Table 14: South America Energy Drinks Market Revenue million Forecast, by Geography 2020 & 2033
- Table 15: South America Energy Drinks Market Revenue million Forecast, by Country 2020 & 2033
- Table 16: South America Energy Drinks Market Revenue million Forecast, by Product Type 2020 & 2033
- Table 17: South America Energy Drinks Market Revenue million Forecast, by Packaging Type 2020 & 2033
- Table 18: South America Energy Drinks Market Revenue million Forecast, by Distribution Channel 2020 & 2033
- Table 19: South America Energy Drinks Market Revenue million Forecast, by Geography 2020 & 2033
- Table 20: South America Energy Drinks Market Revenue million Forecast, by Country 2020 & 2033
Frequently Asked Questions
1. What is the projected Compound Annual Growth Rate (CAGR) of the South America Energy Drinks Market?
The projected CAGR is approximately 8.2%.
2. Which companies are prominent players in the South America Energy Drinks Market?
Key companies in the market include Globalbev Bebidas e Alimentos SA, Integralmédica Suplementos Nutricionais S/A*List Not Exhaustive, Bebidas Grassi, AJE Group, Mutalo Group, PepsiCo Inc, Red Bull GmbH, The Coca-Cola Company, Anheuser-Busch InBev SA/NV (Ambev SA), Grupo Petrópolis.
3. What are the main segments of the South America Energy Drinks Market?
The market segments include Product Type, Packaging Type, Distribution Channel, Geography.
4. Can you provide details about the market size?
The market size is estimated to be USD 3075.61 million as of 2022.
5. What are some drivers contributing to market growth?
Inclination Toward Low-Sugar/Sugar-free Beverages.
6. What are the notable trends driving market growth?
Foodservice and E-commerce Channels Significantly Creating Shelf Space to Energy Drinks.
7. Are there any restraints impacting market growth?
Concerns Over Health Issues Associated with Functional Beverages.
8. Can you provide examples of recent developments in the market?
In November 2022, Grupo Petrópolis launched a range of fruit-based energy drinks under the brand name TNT Energy Drink. The first flavor of the extended product line is Mango Summer, which consists of a mix of fruits with a high presence of mango flavor. It is available in 473ml and 269ml cans in the South American market.
9. What pricing options are available for accessing the report?
Pricing options include single-user, multi-user, and enterprise licenses priced at USD 4750, USD 5250, and USD 8750 respectively.
10. Is the market size provided in terms of value or volume?
The market size is provided in terms of value, measured in million.
11. Are there any specific market keywords associated with the report?
Yes, the market keyword associated with the report is "South America Energy Drinks Market," which aids in identifying and referencing the specific market segment covered.
12. How do I determine which pricing option suits my needs best?
The pricing options vary based on user requirements and access needs. Individual users may opt for single-user licenses, while businesses requiring broader access may choose multi-user or enterprise licenses for cost-effective access to the report.
13. Are there any additional resources or data provided in the South America Energy Drinks Market report?
While the report offers comprehensive insights, it's advisable to review the specific contents or supplementary materials provided to ascertain if additional resources or data are available.
14. How can I stay updated on further developments or reports in the South America Energy Drinks Market?
To stay informed about further developments, trends, and reports in the South America Energy Drinks Market, consider subscribing to industry newsletters, following relevant companies and organizations, or regularly checking reputable industry news sources and publications.
Methodology
Step 1 - Identification of Relevant Samples Size from Population Database


Step 2 - Approaches for Defining Global Market Size (Value, Volume* & Price*)

Note*: In applicable scenarios
Step 3 - Data Sources
Primary Research
- Web Analytics
- Survey Reports
- Research Institute
- Latest Research Reports
- Opinion Leaders
Secondary Research
- Annual Reports
- White Paper
- Latest Press Release
- Industry Association
- Paid Database
- Investor Presentations

Step 4 - Data Triangulation
Involves using different sources of information in order to increase the validity of a study
These sources are likely to be stakeholders in a program - participants, other researchers, program staff, other community members, and so on.
Then we put all data in single framework & apply various statistical tools to find out the dynamic on the market.
During the analysis stage, feedback from the stakeholder groups would be compared to determine areas of agreement as well as areas of divergence