

Key Insights
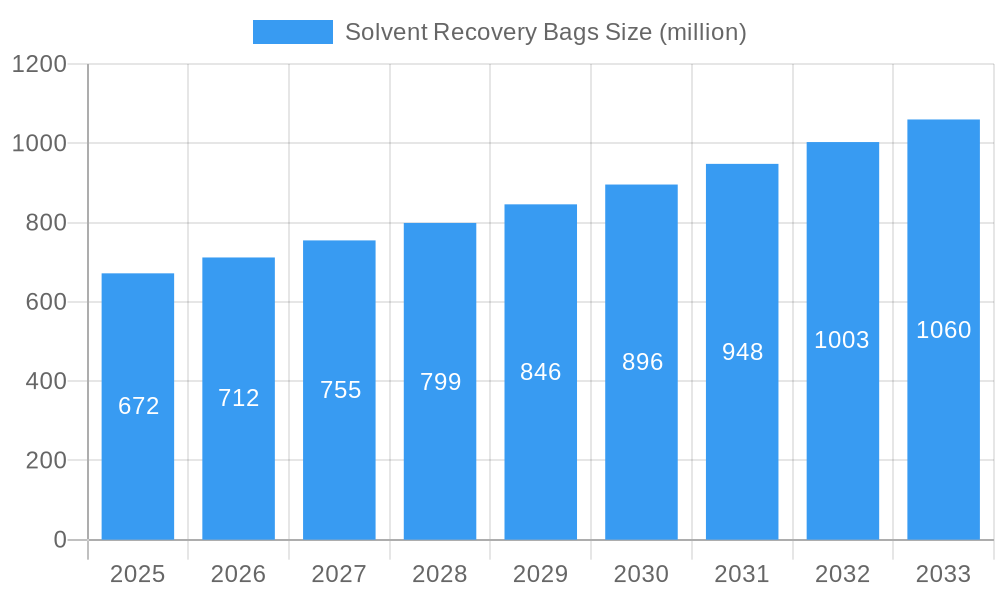
The solvent recovery bag market, currently valued at $672 million in 2025, is projected to experience robust growth, driven by increasing environmental regulations aimed at reducing volatile organic compound (VOC) emissions and the rising adoption of sustainable waste management practices across various industries. The market's 5.8% CAGR indicates a steady expansion through 2033, fueled by the increasing demand for efficient and cost-effective solvent recovery solutions. Key drivers include the growing awareness of environmental protection, stringent regulations regarding hazardous waste disposal, and the rising demand for sustainable and eco-friendly alternatives to traditional solvent recovery methods. The expanding manufacturing, chemical processing, and pharmaceutical sectors are major contributors to this growth. Furthermore, technological advancements leading to improved bag durability, increased solvent recovery rates, and easier handling are also boosting market expansion. Competition among established players like BECCA, Xinwang Advanced Materials Technology, and NexGen Enviro Systems is driving innovation and price optimization within the market.
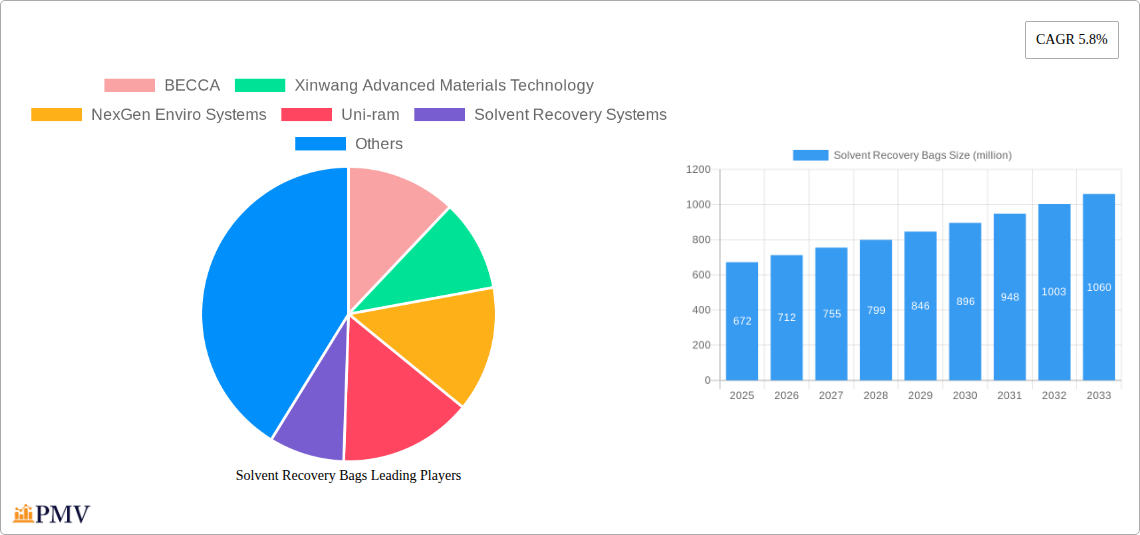
Solvent Recovery Bags Market Size (In Million)
While the market enjoys positive momentum, challenges remain. Fluctuations in raw material prices, particularly polymers used in bag manufacturing, could impact profitability. Also, the potential for leakage and the need for proper disposal procedures after use present ongoing operational and environmental considerations for users. Despite these challenges, the long-term outlook for the solvent recovery bag market remains optimistic, driven by continuous technological improvements, increased environmental awareness, and the rising demand for efficient and sustainable waste management across diverse industrial applications. The market is segmented by type (size, material), application (industry), and geography, with further analysis expected to reveal regional growth disparities and specific application trends.
Solvent Recovery Bags Company Market Share
Solvent Recovery Bags Market Report: 2019-2033
This comprehensive report provides a detailed analysis of the global Solvent Recovery Bags market, offering invaluable insights for businesses, investors, and researchers. The study period covers 2019-2033, with a base year of 2025 and a forecast period of 2025-2033. The report delves into market structure, competitive dynamics, industry trends, dominant segments, product innovations, and key challenges, presenting a holistic view of this crucial sector. The estimated market size in 2025 is projected to be $xx million, with a CAGR of xx% during the forecast period.
Solvent Recovery Bags Market Structure & Competitive Dynamics
The global Solvent Recovery Bags market exhibits a moderately concentrated structure, with a few dominant players commanding significant market share. Key players like BECCA, Xinwang Advanced Materials Technology, and NexGen Enviro Systems hold a combined xx% market share in 2025, indicating a competitive landscape with both established players and emerging innovators. The market's innovation ecosystem is driven by continuous improvements in material science, focusing on enhanced durability, solvent compatibility, and reusability. Regulatory frameworks, particularly concerning environmental compliance and waste management, significantly impact market dynamics. Product substitutes, such as alternative solvent recycling technologies, pose a moderate competitive threat. End-user trends towards sustainable practices and stricter environmental regulations are pushing the demand for efficient and eco-friendly solvent recovery solutions. M&A activities in the sector have been relatively moderate in recent years, with a total deal value of approximately $xx million during the historical period (2019-2024). Future M&A activity is anticipated to increase as companies seek to expand their market reach and enhance their technological capabilities.
- Market Concentration: Moderately concentrated, with top 3 players holding xx% market share in 2025.
- Innovation Ecosystem: Focused on material science advancements for improved durability and reusability.
- Regulatory Framework: Stringent environmental regulations drive market growth.
- Product Substitutes: Alternative solvent recycling technologies pose moderate competition.
- End-User Trends: Growing preference for sustainable practices fuels demand.
- M&A Activity: Total deal value of approximately $xx million (2019-2024).
Solvent Recovery Bags Industry Trends & Insights
The Solvent Recovery Bags market is experiencing robust growth, driven by several key factors. The increasing adoption of sustainable practices across various industries, coupled with stringent environmental regulations, is a primary growth driver. Technological advancements, particularly in materials science, are leading to the development of more efficient and durable solvent recovery bags, further boosting market growth. Consumer preferences are shifting towards eco-friendly and cost-effective solutions, creating a significant demand for improved solvent recovery technologies. Competitive dynamics are characterized by innovation, product differentiation, and strategic partnerships. The market's CAGR is projected at xx% during the forecast period (2025-2033), indicating sustained growth. Market penetration in key sectors such as printing, automotive, and pharmaceuticals is expected to reach xx% by 2033. Challenges such as fluctuating raw material prices and potential supply chain disruptions could impact future market growth.
Dominant Markets & Segments in Solvent Recovery Bags
The North American region currently holds the largest market share, driven by robust industrial activity and stringent environmental regulations. Within North America, the United States represents the dominant market, fueled by a large manufacturing base and strong demand for sustainable solvent management practices.
- Key Drivers in North America:
- Stringent environmental regulations promoting sustainable waste management.
- High industrial activity across various sectors (e.g., printing, automotive).
- Robust research and development in advanced materials and recycling technologies.
- Favorable government policies and incentives supporting sustainable practices.
The dominance of North America is primarily attributed to a combination of factors. Stringent environmental regulations are incentivizing the adoption of solvent recovery bags, while the significant presence of various industries requiring solvent management further fuels market growth. Furthermore, substantial research and development efforts within the region continuously advance material science and recycling technologies. Government support through favorable policies and financial incentives also plays a key role in boosting market adoption.
Solvent Recovery Bags Product Innovations
Recent product innovations in solvent recovery bags focus on enhanced durability, improved solvent compatibility, and easier handling. Manufacturers are employing advanced materials like multi-layer films and specialized coatings to enhance the performance and lifespan of these bags. These innovations provide competitive advantages by offering superior solvent containment, reducing waste, and improving overall efficiency. The market is witnessing a strong trend towards reusable and recyclable solvent recovery bags, aligning with the growing emphasis on sustainability.
Report Segmentation & Scope
This report segments the Solvent Recovery Bags market based on several key factors: by material type, including polypropylene, polyethylene, and others; by capacity, encompassing small, medium, and large capacity bags; by end-use industry, covering printing, automotive, pharmaceuticals, and others; by region, including North America, Europe, Asia Pacific, and the rest of the world. Each segment's growth projection, market size, and competitive dynamics are analyzed in detail. For example, the printing industry segment is projected to exhibit strong growth due to increasing demand for sustainable printing practices.
Key Drivers of Solvent Recovery Bags Growth
The growth of the Solvent Recovery Bags market is propelled by several key factors. Stringent environmental regulations across the globe are driving the adoption of sustainable waste management solutions, including solvent recovery bags. The increasing awareness of environmental concerns and the shift towards eco-friendly practices are also contributing factors. Furthermore, technological advancements in material science are leading to the development of more durable and efficient solvent recovery bags, enhancing their market appeal.
Challenges in the Solvent Recovery Bags Sector
Challenges facing the Solvent Recovery Bags sector include fluctuating raw material prices, which directly impact production costs. Supply chain disruptions can also lead to production delays and increased costs. Intense competition among various manufacturers necessitates continuous innovation and cost optimization strategies. Moreover, compliance with evolving environmental regulations requires significant investments in research and development. These challenges necessitate a strategic approach to navigate the dynamic market landscape and maintain profitability.
Leading Players in the Solvent Recovery Bags Market
- BECCA
- Xinwang Advanced Materials Technology
- NexGen Enviro Systems
- Uni-ram
- Solvent Recovery Systems
- PPC Technologies & Solutions
- Hongyi Environmental Tech
- Ingeniven
- Mid-States Equipment
- Maratek
- Recbags
- ALPHA LINER
- Sidewinder
- Martin Senour
- Sprayfish
- CleanPlanet Chemical
- Maratek Environmental
- CBG Technologies
- IST Pure
- Pollution Control Products
- Safetykleen
Key Developments in Solvent Recovery Bags Sector
- 2022-Q4: NexGen Enviro Systems launched a new line of reusable solvent recovery bags with enhanced durability.
- 2023-Q1: BECCA announced a strategic partnership with a major chemical supplier to expand its market reach.
- 2023-Q3: Xinwang Advanced Materials Technology introduced a new biodegradable solvent recovery bag. (Further developments can be added here)
Strategic Solvent Recovery Bags Market Outlook
The Solvent Recovery Bags market presents significant growth opportunities for companies that can effectively navigate the challenges and capitalize on the industry trends. Technological innovation, strategic partnerships, and a focus on sustainability will be crucial for success in this sector. The market's projected growth, coupled with the increasing demand for environmentally responsible solutions, indicates a promising outlook for the future. Continued development of advanced materials and expansion into new markets will shape the future competitive landscape.
Solvent Recovery Bags Segmentation
-
1. Application
- 1.1. Oil Industry
- 1.2. Gas Industry
- 1.3. Pharmaceutical Industry
- 1.4. Others
-
2. Type
- 2.1. Customized Size
- 2.2. Standard Size
Solvent Recovery Bags Segmentation By Geography
-
1. North America
- 1.1. United States
- 1.2. Canada
- 1.3. Mexico
-
2. South America
- 2.1. Brazil
- 2.2. Argentina
- 2.3. Rest of South America
-
3. Europe
- 3.1. United Kingdom
- 3.2. Germany
- 3.3. France
- 3.4. Italy
- 3.5. Spain
- 3.6. Russia
- 3.7. Benelux
- 3.8. Nordics
- 3.9. Rest of Europe
-
4. Middle East & Africa
- 4.1. Turkey
- 4.2. Israel
- 4.3. GCC
- 4.4. North Africa
- 4.5. South Africa
- 4.6. Rest of Middle East & Africa
-
5. Asia Pacific
- 5.1. China
- 5.2. India
- 5.3. Japan
- 5.4. South Korea
- 5.5. ASEAN
- 5.6. Oceania
- 5.7. Rest of Asia Pacific
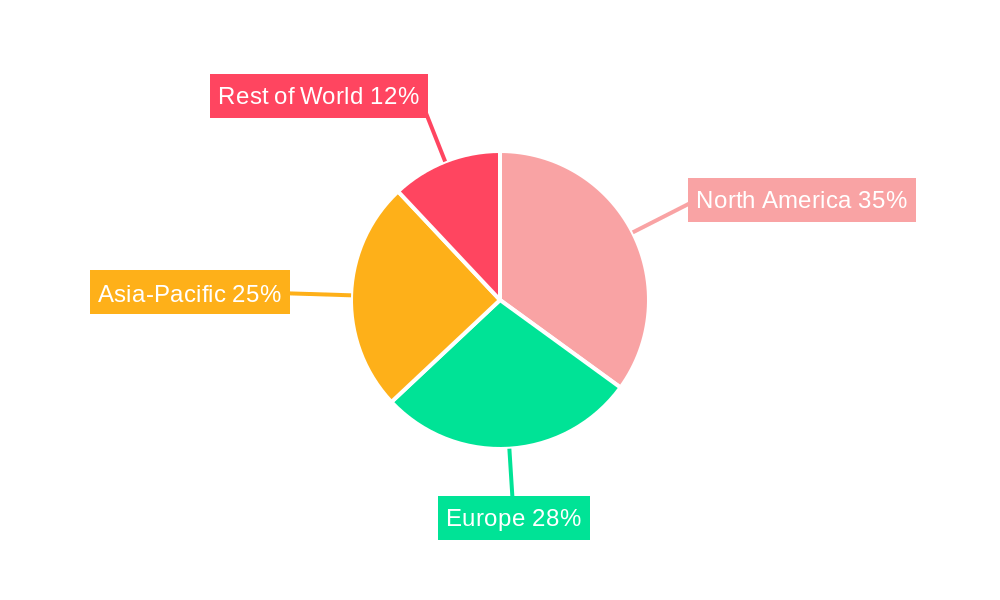
Solvent Recovery Bags Regional Market Share
Geographic Coverage of Solvent Recovery Bags
Solvent Recovery Bags REPORT HIGHLIGHTS
| Aspects | Details |
|---|---|
| Study Period | 2020-2034 |
| Base Year | 2025 |
| Estimated Year | 2026 |
| Forecast Period | 2026-2034 |
| Historical Period | 2020-2025 |
| Growth Rate | CAGR of 5.8% from 2020-2034 |
| Segmentation |
|
Table of Contents
- 1. Introduction
- 1.1. Research Scope
- 1.2. Market Segmentation
- 1.3. Research Methodology
- 1.4. Definitions and Assumptions
- 2. Executive Summary
- 2.1. Introduction
- 3. Market Dynamics
- 3.1. Introduction
- 3.2. Market Drivers
- 3.3. Market Restrains
- 3.4. Market Trends
- 4. Market Factor Analysis
- 4.1. Porters Five Forces
- 4.2. Supply/Value Chain
- 4.3. PESTEL analysis
- 4.4. Market Entropy
- 4.5. Patent/Trademark Analysis
- 5. Global Solvent Recovery Bags Analysis, Insights and Forecast, 2020-2032
- 5.1. Market Analysis, Insights and Forecast - by Application
- 5.1.1. Oil Industry
- 5.1.2. Gas Industry
- 5.1.3. Pharmaceutical Industry
- 5.1.4. Others
- 5.2. Market Analysis, Insights and Forecast - by Type
- 5.2.1. Customized Size
- 5.2.2. Standard Size
- 5.3. Market Analysis, Insights and Forecast - by Region
- 5.3.1. North America
- 5.3.2. South America
- 5.3.3. Europe
- 5.3.4. Middle East & Africa
- 5.3.5. Asia Pacific
- 5.1. Market Analysis, Insights and Forecast - by Application
- 6. North America Solvent Recovery Bags Analysis, Insights and Forecast, 2020-2032
- 6.1. Market Analysis, Insights and Forecast - by Application
- 6.1.1. Oil Industry
- 6.1.2. Gas Industry
- 6.1.3. Pharmaceutical Industry
- 6.1.4. Others
- 6.2. Market Analysis, Insights and Forecast - by Type
- 6.2.1. Customized Size
- 6.2.2. Standard Size
- 6.1. Market Analysis, Insights and Forecast - by Application
- 7. South America Solvent Recovery Bags Analysis, Insights and Forecast, 2020-2032
- 7.1. Market Analysis, Insights and Forecast - by Application
- 7.1.1. Oil Industry
- 7.1.2. Gas Industry
- 7.1.3. Pharmaceutical Industry
- 7.1.4. Others
- 7.2. Market Analysis, Insights and Forecast - by Type
- 7.2.1. Customized Size
- 7.2.2. Standard Size
- 7.1. Market Analysis, Insights and Forecast - by Application
- 8. Europe Solvent Recovery Bags Analysis, Insights and Forecast, 2020-2032
- 8.1. Market Analysis, Insights and Forecast - by Application
- 8.1.1. Oil Industry
- 8.1.2. Gas Industry
- 8.1.3. Pharmaceutical Industry
- 8.1.4. Others
- 8.2. Market Analysis, Insights and Forecast - by Type
- 8.2.1. Customized Size
- 8.2.2. Standard Size
- 8.1. Market Analysis, Insights and Forecast - by Application
- 9. Middle East & Africa Solvent Recovery Bags Analysis, Insights and Forecast, 2020-2032
- 9.1. Market Analysis, Insights and Forecast - by Application
- 9.1.1. Oil Industry
- 9.1.2. Gas Industry
- 9.1.3. Pharmaceutical Industry
- 9.1.4. Others
- 9.2. Market Analysis, Insights and Forecast - by Type
- 9.2.1. Customized Size
- 9.2.2. Standard Size
- 9.1. Market Analysis, Insights and Forecast - by Application
- 10. Asia Pacific Solvent Recovery Bags Analysis, Insights and Forecast, 2020-2032
- 10.1. Market Analysis, Insights and Forecast - by Application
- 10.1.1. Oil Industry
- 10.1.2. Gas Industry
- 10.1.3. Pharmaceutical Industry
- 10.1.4. Others
- 10.2. Market Analysis, Insights and Forecast - by Type
- 10.2.1. Customized Size
- 10.2.2. Standard Size
- 10.1. Market Analysis, Insights and Forecast - by Application
- 11. Competitive Analysis
- 11.1. Global Market Share Analysis 2025
- 11.2. Company Profiles
- 11.2.1 BECCA
- 11.2.1.1. Overview
- 11.2.1.2. Products
- 11.2.1.3. SWOT Analysis
- 11.2.1.4. Recent Developments
- 11.2.1.5. Financials (Based on Availability)
- 11.2.2 Xinwang Advanced Materials Technology
- 11.2.2.1. Overview
- 11.2.2.2. Products
- 11.2.2.3. SWOT Analysis
- 11.2.2.4. Recent Developments
- 11.2.2.5. Financials (Based on Availability)
- 11.2.3 NexGen Enviro Systems
- 11.2.3.1. Overview
- 11.2.3.2. Products
- 11.2.3.3. SWOT Analysis
- 11.2.3.4. Recent Developments
- 11.2.3.5. Financials (Based on Availability)
- 11.2.4 Uni-ram
- 11.2.4.1. Overview
- 11.2.4.2. Products
- 11.2.4.3. SWOT Analysis
- 11.2.4.4. Recent Developments
- 11.2.4.5. Financials (Based on Availability)
- 11.2.5 Solvent Recovery Systems
- 11.2.5.1. Overview
- 11.2.5.2. Products
- 11.2.5.3. SWOT Analysis
- 11.2.5.4. Recent Developments
- 11.2.5.5. Financials (Based on Availability)
- 11.2.6 PPC Technologies & Solutions
- 11.2.6.1. Overview
- 11.2.6.2. Products
- 11.2.6.3. SWOT Analysis
- 11.2.6.4. Recent Developments
- 11.2.6.5. Financials (Based on Availability)
- 11.2.7 Hongyi Environmental Tech
- 11.2.7.1. Overview
- 11.2.7.2. Products
- 11.2.7.3. SWOT Analysis
- 11.2.7.4. Recent Developments
- 11.2.7.5. Financials (Based on Availability)
- 11.2.8 Ingeniven
- 11.2.8.1. Overview
- 11.2.8.2. Products
- 11.2.8.3. SWOT Analysis
- 11.2.8.4. Recent Developments
- 11.2.8.5. Financials (Based on Availability)
- 11.2.9 Mid-States Equipment
- 11.2.9.1. Overview
- 11.2.9.2. Products
- 11.2.9.3. SWOT Analysis
- 11.2.9.4. Recent Developments
- 11.2.9.5. Financials (Based on Availability)
- 11.2.10 Maratek
- 11.2.10.1. Overview
- 11.2.10.2. Products
- 11.2.10.3. SWOT Analysis
- 11.2.10.4. Recent Developments
- 11.2.10.5. Financials (Based on Availability)
- 11.2.11 Recbags
- 11.2.11.1. Overview
- 11.2.11.2. Products
- 11.2.11.3. SWOT Analysis
- 11.2.11.4. Recent Developments
- 11.2.11.5. Financials (Based on Availability)
- 11.2.12 ALPHA LINER
- 11.2.12.1. Overview
- 11.2.12.2. Products
- 11.2.12.3. SWOT Analysis
- 11.2.12.4. Recent Developments
- 11.2.12.5. Financials (Based on Availability)
- 11.2.13 Sidewinder
- 11.2.13.1. Overview
- 11.2.13.2. Products
- 11.2.13.3. SWOT Analysis
- 11.2.13.4. Recent Developments
- 11.2.13.5. Financials (Based on Availability)
- 11.2.14 Martin Senour
- 11.2.14.1. Overview
- 11.2.14.2. Products
- 11.2.14.3. SWOT Analysis
- 11.2.14.4. Recent Developments
- 11.2.14.5. Financials (Based on Availability)
- 11.2.15 Sprayfish
- 11.2.15.1. Overview
- 11.2.15.2. Products
- 11.2.15.3. SWOT Analysis
- 11.2.15.4. Recent Developments
- 11.2.15.5. Financials (Based on Availability)
- 11.2.16 CleanPlanet Chemical
- 11.2.16.1. Overview
- 11.2.16.2. Products
- 11.2.16.3. SWOT Analysis
- 11.2.16.4. Recent Developments
- 11.2.16.5. Financials (Based on Availability)
- 11.2.17 Maratek Environmental
- 11.2.17.1. Overview
- 11.2.17.2. Products
- 11.2.17.3. SWOT Analysis
- 11.2.17.4. Recent Developments
- 11.2.17.5. Financials (Based on Availability)
- 11.2.18 CBG Technologies
- 11.2.18.1. Overview
- 11.2.18.2. Products
- 11.2.18.3. SWOT Analysis
- 11.2.18.4. Recent Developments
- 11.2.18.5. Financials (Based on Availability)
- 11.2.19 IST Pure
- 11.2.19.1. Overview
- 11.2.19.2. Products
- 11.2.19.3. SWOT Analysis
- 11.2.19.4. Recent Developments
- 11.2.19.5. Financials (Based on Availability)
- 11.2.20 Pollution Control Products
- 11.2.20.1. Overview
- 11.2.20.2. Products
- 11.2.20.3. SWOT Analysis
- 11.2.20.4. Recent Developments
- 11.2.20.5. Financials (Based on Availability)
- 11.2.21 Safetykleen
- 11.2.21.1. Overview
- 11.2.21.2. Products
- 11.2.21.3. SWOT Analysis
- 11.2.21.4. Recent Developments
- 11.2.21.5. Financials (Based on Availability)
- 11.2.1 BECCA
List of Figures
- Figure 1: Global Solvent Recovery Bags Revenue Breakdown (undefined, %) by Region 2025 & 2033
- Figure 2: Global Solvent Recovery Bags Volume Breakdown (K, %) by Region 2025 & 2033
- Figure 3: North America Solvent Recovery Bags Revenue (undefined), by Application 2025 & 2033
- Figure 4: North America Solvent Recovery Bags Volume (K), by Application 2025 & 2033
- Figure 5: North America Solvent Recovery Bags Revenue Share (%), by Application 2025 & 2033
- Figure 6: North America Solvent Recovery Bags Volume Share (%), by Application 2025 & 2033
- Figure 7: North America Solvent Recovery Bags Revenue (undefined), by Type 2025 & 2033
- Figure 8: North America Solvent Recovery Bags Volume (K), by Type 2025 & 2033
- Figure 9: North America Solvent Recovery Bags Revenue Share (%), by Type 2025 & 2033
- Figure 10: North America Solvent Recovery Bags Volume Share (%), by Type 2025 & 2033
- Figure 11: North America Solvent Recovery Bags Revenue (undefined), by Country 2025 & 2033
- Figure 12: North America Solvent Recovery Bags Volume (K), by Country 2025 & 2033
- Figure 13: North America Solvent Recovery Bags Revenue Share (%), by Country 2025 & 2033
- Figure 14: North America Solvent Recovery Bags Volume Share (%), by Country 2025 & 2033
- Figure 15: South America Solvent Recovery Bags Revenue (undefined), by Application 2025 & 2033
- Figure 16: South America Solvent Recovery Bags Volume (K), by Application 2025 & 2033
- Figure 17: South America Solvent Recovery Bags Revenue Share (%), by Application 2025 & 2033
- Figure 18: South America Solvent Recovery Bags Volume Share (%), by Application 2025 & 2033
- Figure 19: South America Solvent Recovery Bags Revenue (undefined), by Type 2025 & 2033
- Figure 20: South America Solvent Recovery Bags Volume (K), by Type 2025 & 2033
- Figure 21: South America Solvent Recovery Bags Revenue Share (%), by Type 2025 & 2033
- Figure 22: South America Solvent Recovery Bags Volume Share (%), by Type 2025 & 2033
- Figure 23: South America Solvent Recovery Bags Revenue (undefined), by Country 2025 & 2033
- Figure 24: South America Solvent Recovery Bags Volume (K), by Country 2025 & 2033
- Figure 25: South America Solvent Recovery Bags Revenue Share (%), by Country 2025 & 2033
- Figure 26: South America Solvent Recovery Bags Volume Share (%), by Country 2025 & 2033
- Figure 27: Europe Solvent Recovery Bags Revenue (undefined), by Application 2025 & 2033
- Figure 28: Europe Solvent Recovery Bags Volume (K), by Application 2025 & 2033
- Figure 29: Europe Solvent Recovery Bags Revenue Share (%), by Application 2025 & 2033
- Figure 30: Europe Solvent Recovery Bags Volume Share (%), by Application 2025 & 2033
- Figure 31: Europe Solvent Recovery Bags Revenue (undefined), by Type 2025 & 2033
- Figure 32: Europe Solvent Recovery Bags Volume (K), by Type 2025 & 2033
- Figure 33: Europe Solvent Recovery Bags Revenue Share (%), by Type 2025 & 2033
- Figure 34: Europe Solvent Recovery Bags Volume Share (%), by Type 2025 & 2033
- Figure 35: Europe Solvent Recovery Bags Revenue (undefined), by Country 2025 & 2033
- Figure 36: Europe Solvent Recovery Bags Volume (K), by Country 2025 & 2033
- Figure 37: Europe Solvent Recovery Bags Revenue Share (%), by Country 2025 & 2033
- Figure 38: Europe Solvent Recovery Bags Volume Share (%), by Country 2025 & 2033
- Figure 39: Middle East & Africa Solvent Recovery Bags Revenue (undefined), by Application 2025 & 2033
- Figure 40: Middle East & Africa Solvent Recovery Bags Volume (K), by Application 2025 & 2033
- Figure 41: Middle East & Africa Solvent Recovery Bags Revenue Share (%), by Application 2025 & 2033
- Figure 42: Middle East & Africa Solvent Recovery Bags Volume Share (%), by Application 2025 & 2033
- Figure 43: Middle East & Africa Solvent Recovery Bags Revenue (undefined), by Type 2025 & 2033
- Figure 44: Middle East & Africa Solvent Recovery Bags Volume (K), by Type 2025 & 2033
- Figure 45: Middle East & Africa Solvent Recovery Bags Revenue Share (%), by Type 2025 & 2033
- Figure 46: Middle East & Africa Solvent Recovery Bags Volume Share (%), by Type 2025 & 2033
- Figure 47: Middle East & Africa Solvent Recovery Bags Revenue (undefined), by Country 2025 & 2033
- Figure 48: Middle East & Africa Solvent Recovery Bags Volume (K), by Country 2025 & 2033
- Figure 49: Middle East & Africa Solvent Recovery Bags Revenue Share (%), by Country 2025 & 2033
- Figure 50: Middle East & Africa Solvent Recovery Bags Volume Share (%), by Country 2025 & 2033
- Figure 51: Asia Pacific Solvent Recovery Bags Revenue (undefined), by Application 2025 & 2033
- Figure 52: Asia Pacific Solvent Recovery Bags Volume (K), by Application 2025 & 2033
- Figure 53: Asia Pacific Solvent Recovery Bags Revenue Share (%), by Application 2025 & 2033
- Figure 54: Asia Pacific Solvent Recovery Bags Volume Share (%), by Application 2025 & 2033
- Figure 55: Asia Pacific Solvent Recovery Bags Revenue (undefined), by Type 2025 & 2033
- Figure 56: Asia Pacific Solvent Recovery Bags Volume (K), by Type 2025 & 2033
- Figure 57: Asia Pacific Solvent Recovery Bags Revenue Share (%), by Type 2025 & 2033
- Figure 58: Asia Pacific Solvent Recovery Bags Volume Share (%), by Type 2025 & 2033
- Figure 59: Asia Pacific Solvent Recovery Bags Revenue (undefined), by Country 2025 & 2033
- Figure 60: Asia Pacific Solvent Recovery Bags Volume (K), by Country 2025 & 2033
- Figure 61: Asia Pacific Solvent Recovery Bags Revenue Share (%), by Country 2025 & 2033
- Figure 62: Asia Pacific Solvent Recovery Bags Volume Share (%), by Country 2025 & 2033
List of Tables
- Table 1: Global Solvent Recovery Bags Revenue undefined Forecast, by Application 2020 & 2033
- Table 2: Global Solvent Recovery Bags Volume K Forecast, by Application 2020 & 2033
- Table 3: Global Solvent Recovery Bags Revenue undefined Forecast, by Type 2020 & 2033
- Table 4: Global Solvent Recovery Bags Volume K Forecast, by Type 2020 & 2033
- Table 5: Global Solvent Recovery Bags Revenue undefined Forecast, by Region 2020 & 2033
- Table 6: Global Solvent Recovery Bags Volume K Forecast, by Region 2020 & 2033
- Table 7: Global Solvent Recovery Bags Revenue undefined Forecast, by Application 2020 & 2033
- Table 8: Global Solvent Recovery Bags Volume K Forecast, by Application 2020 & 2033
- Table 9: Global Solvent Recovery Bags Revenue undefined Forecast, by Type 2020 & 2033
- Table 10: Global Solvent Recovery Bags Volume K Forecast, by Type 2020 & 2033
- Table 11: Global Solvent Recovery Bags Revenue undefined Forecast, by Country 2020 & 2033
- Table 12: Global Solvent Recovery Bags Volume K Forecast, by Country 2020 & 2033
- Table 13: United States Solvent Recovery Bags Revenue (undefined) Forecast, by Application 2020 & 2033
- Table 14: United States Solvent Recovery Bags Volume (K) Forecast, by Application 2020 & 2033
- Table 15: Canada Solvent Recovery Bags Revenue (undefined) Forecast, by Application 2020 & 2033
- Table 16: Canada Solvent Recovery Bags Volume (K) Forecast, by Application 2020 & 2033
- Table 17: Mexico Solvent Recovery Bags Revenue (undefined) Forecast, by Application 2020 & 2033
- Table 18: Mexico Solvent Recovery Bags Volume (K) Forecast, by Application 2020 & 2033
- Table 19: Global Solvent Recovery Bags Revenue undefined Forecast, by Application 2020 & 2033
- Table 20: Global Solvent Recovery Bags Volume K Forecast, by Application 2020 & 2033
- Table 21: Global Solvent Recovery Bags Revenue undefined Forecast, by Type 2020 & 2033
- Table 22: Global Solvent Recovery Bags Volume K Forecast, by Type 2020 & 2033
- Table 23: Global Solvent Recovery Bags Revenue undefined Forecast, by Country 2020 & 2033
- Table 24: Global Solvent Recovery Bags Volume K Forecast, by Country 2020 & 2033
- Table 25: Brazil Solvent Recovery Bags Revenue (undefined) Forecast, by Application 2020 & 2033
- Table 26: Brazil Solvent Recovery Bags Volume (K) Forecast, by Application 2020 & 2033
- Table 27: Argentina Solvent Recovery Bags Revenue (undefined) Forecast, by Application 2020 & 2033
- Table 28: Argentina Solvent Recovery Bags Volume (K) Forecast, by Application 2020 & 2033
- Table 29: Rest of South America Solvent Recovery Bags Revenue (undefined) Forecast, by Application 2020 & 2033
- Table 30: Rest of South America Solvent Recovery Bags Volume (K) Forecast, by Application 2020 & 2033
- Table 31: Global Solvent Recovery Bags Revenue undefined Forecast, by Application 2020 & 2033
- Table 32: Global Solvent Recovery Bags Volume K Forecast, by Application 2020 & 2033
- Table 33: Global Solvent Recovery Bags Revenue undefined Forecast, by Type 2020 & 2033
- Table 34: Global Solvent Recovery Bags Volume K Forecast, by Type 2020 & 2033
- Table 35: Global Solvent Recovery Bags Revenue undefined Forecast, by Country 2020 & 2033
- Table 36: Global Solvent Recovery Bags Volume K Forecast, by Country 2020 & 2033
- Table 37: United Kingdom Solvent Recovery Bags Revenue (undefined) Forecast, by Application 2020 & 2033
- Table 38: United Kingdom Solvent Recovery Bags Volume (K) Forecast, by Application 2020 & 2033
- Table 39: Germany Solvent Recovery Bags Revenue (undefined) Forecast, by Application 2020 & 2033
- Table 40: Germany Solvent Recovery Bags Volume (K) Forecast, by Application 2020 & 2033
- Table 41: France Solvent Recovery Bags Revenue (undefined) Forecast, by Application 2020 & 2033
- Table 42: France Solvent Recovery Bags Volume (K) Forecast, by Application 2020 & 2033
- Table 43: Italy Solvent Recovery Bags Revenue (undefined) Forecast, by Application 2020 & 2033
- Table 44: Italy Solvent Recovery Bags Volume (K) Forecast, by Application 2020 & 2033
- Table 45: Spain Solvent Recovery Bags Revenue (undefined) Forecast, by Application 2020 & 2033
- Table 46: Spain Solvent Recovery Bags Volume (K) Forecast, by Application 2020 & 2033
- Table 47: Russia Solvent Recovery Bags Revenue (undefined) Forecast, by Application 2020 & 2033
- Table 48: Russia Solvent Recovery Bags Volume (K) Forecast, by Application 2020 & 2033
- Table 49: Benelux Solvent Recovery Bags Revenue (undefined) Forecast, by Application 2020 & 2033
- Table 50: Benelux Solvent Recovery Bags Volume (K) Forecast, by Application 2020 & 2033
- Table 51: Nordics Solvent Recovery Bags Revenue (undefined) Forecast, by Application 2020 & 2033
- Table 52: Nordics Solvent Recovery Bags Volume (K) Forecast, by Application 2020 & 2033
- Table 53: Rest of Europe Solvent Recovery Bags Revenue (undefined) Forecast, by Application 2020 & 2033
- Table 54: Rest of Europe Solvent Recovery Bags Volume (K) Forecast, by Application 2020 & 2033
- Table 55: Global Solvent Recovery Bags Revenue undefined Forecast, by Application 2020 & 2033
- Table 56: Global Solvent Recovery Bags Volume K Forecast, by Application 2020 & 2033
- Table 57: Global Solvent Recovery Bags Revenue undefined Forecast, by Type 2020 & 2033
- Table 58: Global Solvent Recovery Bags Volume K Forecast, by Type 2020 & 2033
- Table 59: Global Solvent Recovery Bags Revenue undefined Forecast, by Country 2020 & 2033
- Table 60: Global Solvent Recovery Bags Volume K Forecast, by Country 2020 & 2033
- Table 61: Turkey Solvent Recovery Bags Revenue (undefined) Forecast, by Application 2020 & 2033
- Table 62: Turkey Solvent Recovery Bags Volume (K) Forecast, by Application 2020 & 2033
- Table 63: Israel Solvent Recovery Bags Revenue (undefined) Forecast, by Application 2020 & 2033
- Table 64: Israel Solvent Recovery Bags Volume (K) Forecast, by Application 2020 & 2033
- Table 65: GCC Solvent Recovery Bags Revenue (undefined) Forecast, by Application 2020 & 2033
- Table 66: GCC Solvent Recovery Bags Volume (K) Forecast, by Application 2020 & 2033
- Table 67: North Africa Solvent Recovery Bags Revenue (undefined) Forecast, by Application 2020 & 2033
- Table 68: North Africa Solvent Recovery Bags Volume (K) Forecast, by Application 2020 & 2033
- Table 69: South Africa Solvent Recovery Bags Revenue (undefined) Forecast, by Application 2020 & 2033
- Table 70: South Africa Solvent Recovery Bags Volume (K) Forecast, by Application 2020 & 2033
- Table 71: Rest of Middle East & Africa Solvent Recovery Bags Revenue (undefined) Forecast, by Application 2020 & 2033
- Table 72: Rest of Middle East & Africa Solvent Recovery Bags Volume (K) Forecast, by Application 2020 & 2033
- Table 73: Global Solvent Recovery Bags Revenue undefined Forecast, by Application 2020 & 2033
- Table 74: Global Solvent Recovery Bags Volume K Forecast, by Application 2020 & 2033
- Table 75: Global Solvent Recovery Bags Revenue undefined Forecast, by Type 2020 & 2033
- Table 76: Global Solvent Recovery Bags Volume K Forecast, by Type 2020 & 2033
- Table 77: Global Solvent Recovery Bags Revenue undefined Forecast, by Country 2020 & 2033
- Table 78: Global Solvent Recovery Bags Volume K Forecast, by Country 2020 & 2033
- Table 79: China Solvent Recovery Bags Revenue (undefined) Forecast, by Application 2020 & 2033
- Table 80: China Solvent Recovery Bags Volume (K) Forecast, by Application 2020 & 2033
- Table 81: India Solvent Recovery Bags Revenue (undefined) Forecast, by Application 2020 & 2033
- Table 82: India Solvent Recovery Bags Volume (K) Forecast, by Application 2020 & 2033
- Table 83: Japan Solvent Recovery Bags Revenue (undefined) Forecast, by Application 2020 & 2033
- Table 84: Japan Solvent Recovery Bags Volume (K) Forecast, by Application 2020 & 2033
- Table 85: South Korea Solvent Recovery Bags Revenue (undefined) Forecast, by Application 2020 & 2033
- Table 86: South Korea Solvent Recovery Bags Volume (K) Forecast, by Application 2020 & 2033
- Table 87: ASEAN Solvent Recovery Bags Revenue (undefined) Forecast, by Application 2020 & 2033
- Table 88: ASEAN Solvent Recovery Bags Volume (K) Forecast, by Application 2020 & 2033
- Table 89: Oceania Solvent Recovery Bags Revenue (undefined) Forecast, by Application 2020 & 2033
- Table 90: Oceania Solvent Recovery Bags Volume (K) Forecast, by Application 2020 & 2033
- Table 91: Rest of Asia Pacific Solvent Recovery Bags Revenue (undefined) Forecast, by Application 2020 & 2033
- Table 92: Rest of Asia Pacific Solvent Recovery Bags Volume (K) Forecast, by Application 2020 & 2033
Frequently Asked Questions
1. What is the projected Compound Annual Growth Rate (CAGR) of the Solvent Recovery Bags?
The projected CAGR is approximately 5.8%.
2. Which companies are prominent players in the Solvent Recovery Bags?
Key companies in the market include BECCA, Xinwang Advanced Materials Technology, NexGen Enviro Systems, Uni-ram, Solvent Recovery Systems, PPC Technologies & Solutions, Hongyi Environmental Tech, Ingeniven, Mid-States Equipment, Maratek, Recbags, ALPHA LINER, Sidewinder, Martin Senour, Sprayfish, CleanPlanet Chemical, Maratek Environmental, CBG Technologies, IST Pure, Pollution Control Products, Safetykleen.
3. What are the main segments of the Solvent Recovery Bags?
The market segments include Application, Type.
4. Can you provide details about the market size?
The market size is estimated to be USD XXX N/A as of 2022.
5. What are some drivers contributing to market growth?
N/A
6. What are the notable trends driving market growth?
N/A
7. Are there any restraints impacting market growth?
N/A
8. Can you provide examples of recent developments in the market?
N/A
9. What pricing options are available for accessing the report?
Pricing options include single-user, multi-user, and enterprise licenses priced at USD 3950.00, USD 5925.00, and USD 7900.00 respectively.
10. Is the market size provided in terms of value or volume?
The market size is provided in terms of value, measured in N/A and volume, measured in K.
11. Are there any specific market keywords associated with the report?
Yes, the market keyword associated with the report is "Solvent Recovery Bags," which aids in identifying and referencing the specific market segment covered.
12. How do I determine which pricing option suits my needs best?
The pricing options vary based on user requirements and access needs. Individual users may opt for single-user licenses, while businesses requiring broader access may choose multi-user or enterprise licenses for cost-effective access to the report.
13. Are there any additional resources or data provided in the Solvent Recovery Bags report?
While the report offers comprehensive insights, it's advisable to review the specific contents or supplementary materials provided to ascertain if additional resources or data are available.
14. How can I stay updated on further developments or reports in the Solvent Recovery Bags?
To stay informed about further developments, trends, and reports in the Solvent Recovery Bags, consider subscribing to industry newsletters, following relevant companies and organizations, or regularly checking reputable industry news sources and publications.
Methodology
Step 1 - Identification of Relevant Samples Size from Population Database


Step 2 - Approaches for Defining Global Market Size (Value, Volume* & Price*)

Note*: In applicable scenarios
Step 3 - Data Sources
Primary Research
- Web Analytics
- Survey Reports
- Research Institute
- Latest Research Reports
- Opinion Leaders
Secondary Research
- Annual Reports
- White Paper
- Latest Press Release
- Industry Association
- Paid Database
- Investor Presentations

Step 4 - Data Triangulation
Involves using different sources of information in order to increase the validity of a study
These sources are likely to be stakeholders in a program - participants, other researchers, program staff, other community members, and so on.
Then we put all data in single framework & apply various statistical tools to find out the dynamic on the market.
During the analysis stage, feedback from the stakeholder groups would be compared to determine areas of agreement as well as areas of divergence