


Key Insights
The global soft drink flavored concentrate market, valued at $40.04 billion in 2025, is poised for significant expansion. This growth is propelled by increasing consumer demand for convenient, ready-to-mix beverage solutions, particularly among younger demographics. Emerging health-conscious trends are also driving market evolution, with a rising preference for natural and low-sugar concentrates. Manufacturers are responding by innovating healthier formulations, featuring reduced sugar content and incorporating natural flavors and colors, a trend expected to persist. While carbonated concentrates remain dominant, non-carbonated options are gaining traction due to perceived health benefits. Online sales channels are experiencing rapid growth, offering new direct-to-consumer opportunities and expanded distribution. Key industry leaders, including Coca-Cola and PepsiCo, leverage established brands and extensive networks. Concurrently, niche players are introducing innovative flavors and health-focused products, fostering market dynamism. Geographic expansion, especially in developing economies across Asia and Africa, further contributes to market growth. The projected 5.7% CAGR from 2025 to 2033 underscores a promising future, driven by evolving consumer preferences and continuous industry innovation.
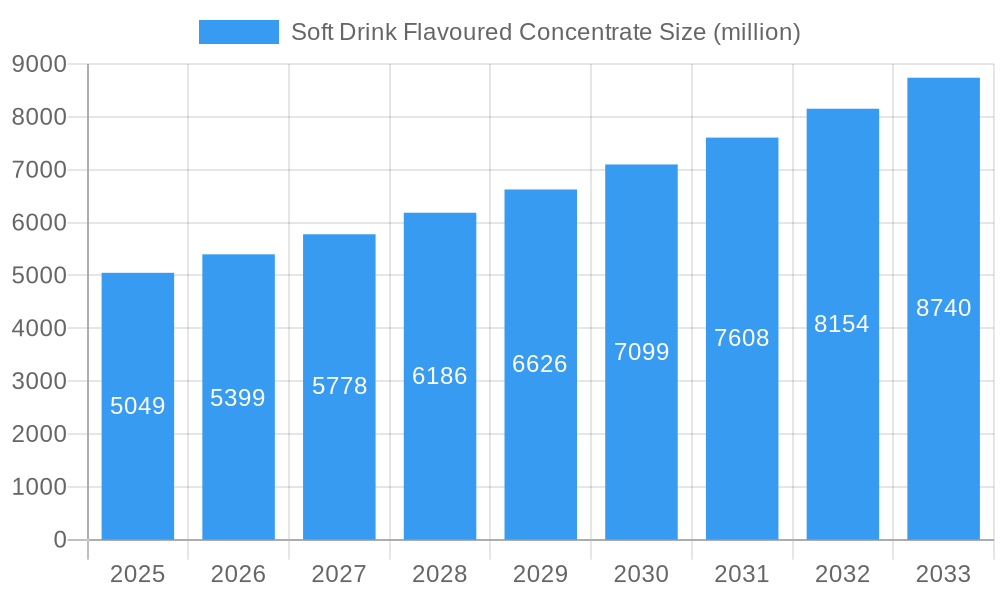
Soft Drink Flavoured Concentrate Market Size (In Billion)

The competitive environment features a blend of multinational corporations and regional contenders. Major players maintain market share through brand recognition and robust distribution, while smaller companies focus on specialized segments like organic or functional beverages, often utilizing direct-to-consumer strategies and e-commerce platforms. Regional taste preferences and purchasing behaviors necessitate tailored localization approaches. Regulatory influences, particularly concerning sugar content and labeling, shape product formulations and marketing across diverse geographies. Ongoing shifts in consumer tastes, health awareness, and technological advancements are fueling innovation in flavor profiles, packaging, and distribution, contributing to the market's dynamic nature. Future growth is anticipated through novel product introductions, expansion into new markets, and adaptation to consumer demand for healthier and more sustainable beverage options.
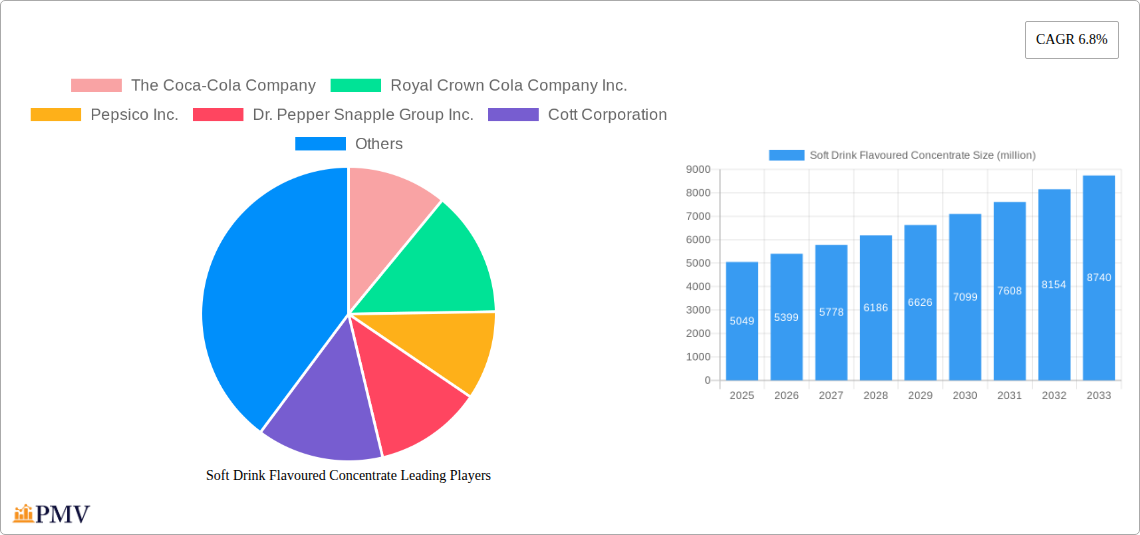
Soft Drink Flavoured Concentrate Company Market Share
Soft Drink Flavoured Concentrate Market Report: 2019-2033
This comprehensive report provides an in-depth analysis of the global soft drink flavoured concentrate market, offering invaluable insights for businesses operating within this dynamic sector. Covering the period from 2019 to 2033, with a base year of 2025 and a forecast period of 2025-2033, this report leverages extensive data analysis to deliver actionable intelligence. The market size is projected to reach xx million by 2033, showcasing significant growth opportunities.
Soft Drink Flavoured Concentrate Market Structure & Competitive Dynamics
The global soft drink flavoured concentrate market exhibits a moderately concentrated structure, with key players like The Coca-Cola Company, PepsiCo Inc., and Dr. Pepper Snapple Group Inc. holding significant market share. The combined market share of these three giants is estimated at approximately 60% in 2025. Innovation ecosystems are robust, with ongoing R&D efforts focused on new flavour profiles, healthier formulations (reduced sugar, natural sweeteners), and sustainable packaging. Regulatory frameworks vary across geographies, impacting ingredient sourcing and labelling requirements. Significant product substitutes exist in the form of other beverages like juices, teas, and water, posing competitive pressure. End-user trends towards healthier options and personalized experiences are reshaping the market. M&A activities have been significant in the historical period (2019-2024), with deal values totaling approximately $xx million, primarily focused on expanding product portfolios and geographical reach.
- Market Concentration: Highly concentrated, with top 3 players holding approximately 60% market share in 2025.
- Innovation: Focus on new flavours, healthier formulations, and sustainable packaging.
- Regulatory Landscape: Varying regulations globally impact ingredient sourcing and labeling.
- Substitutes: Juices, teas, and water pose competitive pressure.
- M&A Activity (2019-2024): Total deal value estimated at $xx million.
Soft Drink Flavoured Concentrate Industry Trends & Insights
The soft drink flavoured concentrate market is witnessing robust growth, driven by factors such as increasing disposable incomes, changing consumer preferences towards diverse flavour profiles, and the growing popularity of ready-to-drink beverages. The market's CAGR during the forecast period (2025-2033) is projected to be xx%, fueled by expanding distribution channels, particularly e-commerce. Technological disruptions, such as advancements in flavour creation and packaging technologies, further enhance the market's dynamism. Consumer preferences are shifting towards healthier options, prompting manufacturers to introduce low-sugar and natural sweetener varieties. Competitive intensity remains high, with companies constantly vying for market share through product innovation, aggressive marketing, and strategic partnerships. Market penetration is expected to reach xx% by 2033.
Dominant Markets & Segments in Soft Drink Flavoured Concentrate
The North American market currently dominates the global soft drink flavoured concentrate landscape, accounting for approximately xx% of global revenue in 2025. This dominance is attributed to high per capita consumption, strong brand loyalty, and well-established distribution networks. The carbonated segment holds a larger share than the non-carbonated segment, reflecting traditional consumer preferences. Offline sales currently contribute a larger share to the overall revenue, but online sales are exhibiting higher growth rates.
Key Drivers of North American Dominance:
- High per capita consumption
- Strong brand loyalty
- Extensive distribution networks
- Established consumer base
Offline Sales: Dominated by traditional retail channels; high volume, established infrastructure.
Online Sales: Rapidly growing segment; e-commerce platforms, direct-to-consumer models driving growth.
Carbonated Segment: Larger market share due to established consumer preference.
Non-Carbonated Segment: Growing steadily, driven by health-conscious consumer trends.
Soft Drink Flavoured Concentrate Product Innovations
Recent innovations in the soft drink flavoured concentrate sector have focused on creating healthier, more sustainable, and personalized products. This includes the development of concentrates with reduced sugar content, using natural sweeteners, and incorporating functional ingredients like vitamins or antioxidants. Sustainable packaging options, such as recycled materials and reduced-size containers, are also gaining traction. These innovations aim to cater to evolving consumer demands and enhance the competitive advantages of manufacturers.
Report Segmentation & Scope
This report segments the soft drink flavoured concentrate market across several key parameters:
- Application: Online Sales and Offline Sales. Online sales are projected to experience faster growth than offline sales due to the expansion of e-commerce and the growing reach of online retailers.
- Type: Carbonated and Non-Carbonated. The carbonated segment holds a larger market share currently but the non-carbonated segment is showing stronger growth potential due to the increasing demand for healthier beverage choices.
Each segment is analyzed in detail, providing market size estimations, growth projections, and competitive dynamics.
Key Drivers of Soft Drink Flavoured Concentrate Growth
Several key factors are driving the growth of the soft drink flavoured concentrate market. These include rising disposable incomes in emerging economies, increasing demand for convenient beverages, and the introduction of innovative flavour combinations and healthier formulations. Government regulations regarding sugar content in beverages are also impacting product development and market dynamics. Technological advancements in flavor creation and packaging are further contributing to market expansion.
Challenges in the Soft Drink Flavoured Concentrate Sector
The soft drink flavoured concentrate sector faces several challenges. Stricter health and wellness regulations globally are forcing manufacturers to reformulate products, increasing costs. Fluctuations in raw material prices and supply chain disruptions pose significant risks. Intense competition and the rise of substitute beverages create pricing pressure and hinder market expansion. These challenges, if not adequately addressed, could impact the overall market growth. The estimated impact of these challenges on market growth is approximately xx million annually.
Leading Players in the Soft Drink Flavoured Concentrate Market
- The Coca-Cola Company
- Royal Crown Cola Company Inc.
- Pepsico Inc.
- Dr. Pepper Snapple Group Inc.
- Cott Corporation
- Monster Beverage Corporation
- Royal Cosun
- Dohler Group
- Big Red Inc.
- David Berryman Limited
- Kraft Foods
Key Developments in Soft Drink Flavoured Concentrate Sector
- 2022-Q4: The Coca-Cola Company launched a new line of low-sugar flavored concentrates.
- 2023-Q1: PepsiCo acquired a smaller concentrate producer, expanding its product portfolio.
- 2023-Q3: New regulations regarding artificial sweeteners came into effect in several key markets. (Specific details about regulatory changes would need to be inserted here. )
Strategic Soft Drink Flavoured Concentrate Market Outlook
The future of the soft drink flavoured concentrate market is promising, driven by sustained growth in emerging markets and ongoing innovation in product formulations and packaging. Strategic opportunities lie in tapping into the growing demand for healthier options, exploring sustainable practices, and capitalizing on the increasing popularity of e-commerce channels. Companies that effectively adapt to changing consumer preferences and regulatory landscapes are best positioned to capture significant market share in the coming years. The projected market value shows substantial growth potential, emphasizing the strategic importance of this sector.
Soft Drink Flavoured Concentrate Segmentation
-
1. Application
- 1.1. Online Sales
- 1.2. Offline Sales
-
2. Type
- 2.1. Non-Carbonated
- 2.2. Carbonated
Soft Drink Flavoured Concentrate Segmentation By Geography
-
1. North America
- 1.1. United States
- 1.2. Canada
- 1.3. Mexico
-
2. South America
- 2.1. Brazil
- 2.2. Argentina
- 2.3. Rest of South America
-
3. Europe
- 3.1. United Kingdom
- 3.2. Germany
- 3.3. France
- 3.4. Italy
- 3.5. Spain
- 3.6. Russia
- 3.7. Benelux
- 3.8. Nordics
- 3.9. Rest of Europe
-
4. Middle East & Africa
- 4.1. Turkey
- 4.2. Israel
- 4.3. GCC
- 4.4. North Africa
- 4.5. South Africa
- 4.6. Rest of Middle East & Africa
-
5. Asia Pacific
- 5.1. China
- 5.2. India
- 5.3. Japan
- 5.4. South Korea
- 5.5. ASEAN
- 5.6. Oceania
- 5.7. Rest of Asia Pacific
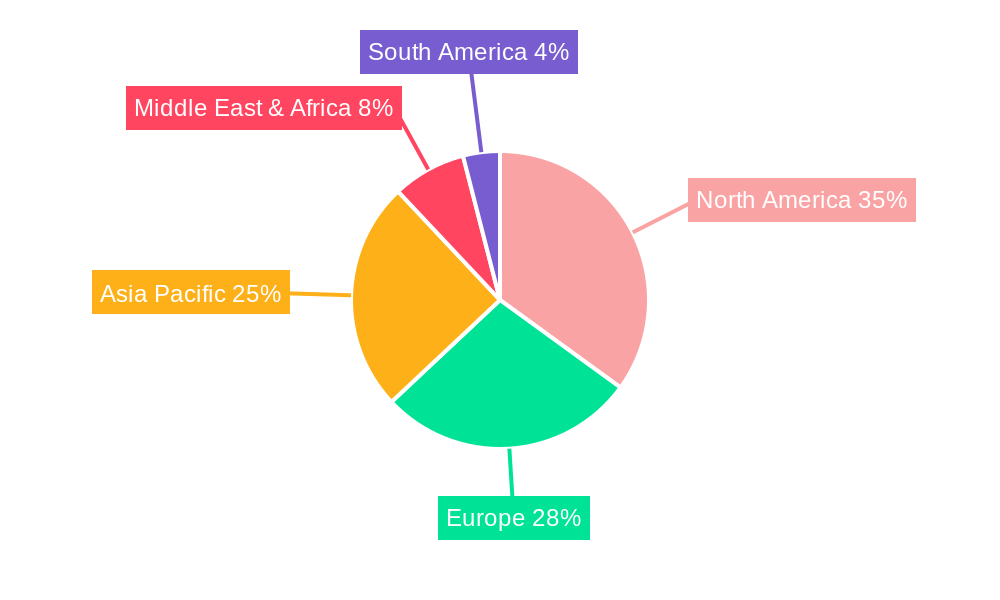
Soft Drink Flavoured Concentrate Regional Market Share
Geographic Coverage of Soft Drink Flavoured Concentrate
Soft Drink Flavoured Concentrate REPORT HIGHLIGHTS
| Aspects | Details |
|---|---|
| Study Period | 2020-2034 |
| Base Year | 2025 |
| Estimated Year | 2026 |
| Forecast Period | 2026-2034 |
| Historical Period | 2020-2025 |
| Growth Rate | CAGR of 5.7% from 2020-2034 |
| Segmentation |
|
Table of Contents
- 1. Introduction
- 1.1. Research Scope
- 1.2. Market Segmentation
- 1.3. Research Methodology
- 1.4. Definitions and Assumptions
- 2. Executive Summary
- 2.1. Introduction
- 3. Market Dynamics
- 3.1. Introduction
- 3.2. Market Drivers
- 3.3. Market Restrains
- 3.4. Market Trends
- 4. Market Factor Analysis
- 4.1. Porters Five Forces
- 4.2. Supply/Value Chain
- 4.3. PESTEL analysis
- 4.4. Market Entropy
- 4.5. Patent/Trademark Analysis
- 5. Global Soft Drink Flavoured Concentrate Analysis, Insights and Forecast, 2020-2032
- 5.1. Market Analysis, Insights and Forecast - by Application
- 5.1.1. Online Sales
- 5.1.2. Offline Sales
- 5.2. Market Analysis, Insights and Forecast - by Type
- 5.2.1. Non-Carbonated
- 5.2.2. Carbonated
- 5.3. Market Analysis, Insights and Forecast - by Region
- 5.3.1. North America
- 5.3.2. South America
- 5.3.3. Europe
- 5.3.4. Middle East & Africa
- 5.3.5. Asia Pacific
- 5.1. Market Analysis, Insights and Forecast - by Application
- 6. North America Soft Drink Flavoured Concentrate Analysis, Insights and Forecast, 2020-2032
- 6.1. Market Analysis, Insights and Forecast - by Application
- 6.1.1. Online Sales
- 6.1.2. Offline Sales
- 6.2. Market Analysis, Insights and Forecast - by Type
- 6.2.1. Non-Carbonated
- 6.2.2. Carbonated
- 6.1. Market Analysis, Insights and Forecast - by Application
- 7. South America Soft Drink Flavoured Concentrate Analysis, Insights and Forecast, 2020-2032
- 7.1. Market Analysis, Insights and Forecast - by Application
- 7.1.1. Online Sales
- 7.1.2. Offline Sales
- 7.2. Market Analysis, Insights and Forecast - by Type
- 7.2.1. Non-Carbonated
- 7.2.2. Carbonated
- 7.1. Market Analysis, Insights and Forecast - by Application
- 8. Europe Soft Drink Flavoured Concentrate Analysis, Insights and Forecast, 2020-2032
- 8.1. Market Analysis, Insights and Forecast - by Application
- 8.1.1. Online Sales
- 8.1.2. Offline Sales
- 8.2. Market Analysis, Insights and Forecast - by Type
- 8.2.1. Non-Carbonated
- 8.2.2. Carbonated
- 8.1. Market Analysis, Insights and Forecast - by Application
- 9. Middle East & Africa Soft Drink Flavoured Concentrate Analysis, Insights and Forecast, 2020-2032
- 9.1. Market Analysis, Insights and Forecast - by Application
- 9.1.1. Online Sales
- 9.1.2. Offline Sales
- 9.2. Market Analysis, Insights and Forecast - by Type
- 9.2.1. Non-Carbonated
- 9.2.2. Carbonated
- 9.1. Market Analysis, Insights and Forecast - by Application
- 10. Asia Pacific Soft Drink Flavoured Concentrate Analysis, Insights and Forecast, 2020-2032
- 10.1. Market Analysis, Insights and Forecast - by Application
- 10.1.1. Online Sales
- 10.1.2. Offline Sales
- 10.2. Market Analysis, Insights and Forecast - by Type
- 10.2.1. Non-Carbonated
- 10.2.2. Carbonated
- 10.1. Market Analysis, Insights and Forecast - by Application
- 11. Competitive Analysis
- 11.1. Global Market Share Analysis 2025
- 11.2. Company Profiles
- 11.2.1 The Coca-Cola Company
- 11.2.1.1. Overview
- 11.2.1.2. Products
- 11.2.1.3. SWOT Analysis
- 11.2.1.4. Recent Developments
- 11.2.1.5. Financials (Based on Availability)
- 11.2.2 Royal Crown Cola Company Inc.
- 11.2.2.1. Overview
- 11.2.2.2. Products
- 11.2.2.3. SWOT Analysis
- 11.2.2.4. Recent Developments
- 11.2.2.5. Financials (Based on Availability)
- 11.2.3 Pepsico Inc.
- 11.2.3.1. Overview
- 11.2.3.2. Products
- 11.2.3.3. SWOT Analysis
- 11.2.3.4. Recent Developments
- 11.2.3.5. Financials (Based on Availability)
- 11.2.4 Dr. Pepper Snapple Group Inc.
- 11.2.4.1. Overview
- 11.2.4.2. Products
- 11.2.4.3. SWOT Analysis
- 11.2.4.4. Recent Developments
- 11.2.4.5. Financials (Based on Availability)
- 11.2.5 Cott Corporation
- 11.2.5.1. Overview
- 11.2.5.2. Products
- 11.2.5.3. SWOT Analysis
- 11.2.5.4. Recent Developments
- 11.2.5.5. Financials (Based on Availability)
- 11.2.6 Monster Beverage Corporation
- 11.2.6.1. Overview
- 11.2.6.2. Products
- 11.2.6.3. SWOT Analysis
- 11.2.6.4. Recent Developments
- 11.2.6.5. Financials (Based on Availability)
- 11.2.7 Royal Cosun
- 11.2.7.1. Overview
- 11.2.7.2. Products
- 11.2.7.3. SWOT Analysis
- 11.2.7.4. Recent Developments
- 11.2.7.5. Financials (Based on Availability)
- 11.2.8 Dohler Group
- 11.2.8.1. Overview
- 11.2.8.2. Products
- 11.2.8.3. SWOT Analysis
- 11.2.8.4. Recent Developments
- 11.2.8.5. Financials (Based on Availability)
- 11.2.9 Big Red Inc.
- 11.2.9.1. Overview
- 11.2.9.2. Products
- 11.2.9.3. SWOT Analysis
- 11.2.9.4. Recent Developments
- 11.2.9.5. Financials (Based on Availability)
- 11.2.10 David Berryman Limited
- 11.2.10.1. Overview
- 11.2.10.2. Products
- 11.2.10.3. SWOT Analysis
- 11.2.10.4. Recent Developments
- 11.2.10.5. Financials (Based on Availability)
- 11.2.11 Kraft Foods
- 11.2.11.1. Overview
- 11.2.11.2. Products
- 11.2.11.3. SWOT Analysis
- 11.2.11.4. Recent Developments
- 11.2.11.5. Financials (Based on Availability)
- 11.2.1 The Coca-Cola Company
List of Figures
- Figure 1: Global Soft Drink Flavoured Concentrate Revenue Breakdown (billion, %) by Region 2025 & 2033
- Figure 2: Global Soft Drink Flavoured Concentrate Volume Breakdown (K, %) by Region 2025 & 2033
- Figure 3: North America Soft Drink Flavoured Concentrate Revenue (billion), by Application 2025 & 2033
- Figure 4: North America Soft Drink Flavoured Concentrate Volume (K), by Application 2025 & 2033
- Figure 5: North America Soft Drink Flavoured Concentrate Revenue Share (%), by Application 2025 & 2033
- Figure 6: North America Soft Drink Flavoured Concentrate Volume Share (%), by Application 2025 & 2033
- Figure 7: North America Soft Drink Flavoured Concentrate Revenue (billion), by Type 2025 & 2033
- Figure 8: North America Soft Drink Flavoured Concentrate Volume (K), by Type 2025 & 2033
- Figure 9: North America Soft Drink Flavoured Concentrate Revenue Share (%), by Type 2025 & 2033
- Figure 10: North America Soft Drink Flavoured Concentrate Volume Share (%), by Type 2025 & 2033
- Figure 11: North America Soft Drink Flavoured Concentrate Revenue (billion), by Country 2025 & 2033
- Figure 12: North America Soft Drink Flavoured Concentrate Volume (K), by Country 2025 & 2033
- Figure 13: North America Soft Drink Flavoured Concentrate Revenue Share (%), by Country 2025 & 2033
- Figure 14: North America Soft Drink Flavoured Concentrate Volume Share (%), by Country 2025 & 2033
- Figure 15: South America Soft Drink Flavoured Concentrate Revenue (billion), by Application 2025 & 2033
- Figure 16: South America Soft Drink Flavoured Concentrate Volume (K), by Application 2025 & 2033
- Figure 17: South America Soft Drink Flavoured Concentrate Revenue Share (%), by Application 2025 & 2033
- Figure 18: South America Soft Drink Flavoured Concentrate Volume Share (%), by Application 2025 & 2033
- Figure 19: South America Soft Drink Flavoured Concentrate Revenue (billion), by Type 2025 & 2033
- Figure 20: South America Soft Drink Flavoured Concentrate Volume (K), by Type 2025 & 2033
- Figure 21: South America Soft Drink Flavoured Concentrate Revenue Share (%), by Type 2025 & 2033
- Figure 22: South America Soft Drink Flavoured Concentrate Volume Share (%), by Type 2025 & 2033
- Figure 23: South America Soft Drink Flavoured Concentrate Revenue (billion), by Country 2025 & 2033
- Figure 24: South America Soft Drink Flavoured Concentrate Volume (K), by Country 2025 & 2033
- Figure 25: South America Soft Drink Flavoured Concentrate Revenue Share (%), by Country 2025 & 2033
- Figure 26: South America Soft Drink Flavoured Concentrate Volume Share (%), by Country 2025 & 2033
- Figure 27: Europe Soft Drink Flavoured Concentrate Revenue (billion), by Application 2025 & 2033
- Figure 28: Europe Soft Drink Flavoured Concentrate Volume (K), by Application 2025 & 2033
- Figure 29: Europe Soft Drink Flavoured Concentrate Revenue Share (%), by Application 2025 & 2033
- Figure 30: Europe Soft Drink Flavoured Concentrate Volume Share (%), by Application 2025 & 2033
- Figure 31: Europe Soft Drink Flavoured Concentrate Revenue (billion), by Type 2025 & 2033
- Figure 32: Europe Soft Drink Flavoured Concentrate Volume (K), by Type 2025 & 2033
- Figure 33: Europe Soft Drink Flavoured Concentrate Revenue Share (%), by Type 2025 & 2033
- Figure 34: Europe Soft Drink Flavoured Concentrate Volume Share (%), by Type 2025 & 2033
- Figure 35: Europe Soft Drink Flavoured Concentrate Revenue (billion), by Country 2025 & 2033
- Figure 36: Europe Soft Drink Flavoured Concentrate Volume (K), by Country 2025 & 2033
- Figure 37: Europe Soft Drink Flavoured Concentrate Revenue Share (%), by Country 2025 & 2033
- Figure 38: Europe Soft Drink Flavoured Concentrate Volume Share (%), by Country 2025 & 2033
- Figure 39: Middle East & Africa Soft Drink Flavoured Concentrate Revenue (billion), by Application 2025 & 2033
- Figure 40: Middle East & Africa Soft Drink Flavoured Concentrate Volume (K), by Application 2025 & 2033
- Figure 41: Middle East & Africa Soft Drink Flavoured Concentrate Revenue Share (%), by Application 2025 & 2033
- Figure 42: Middle East & Africa Soft Drink Flavoured Concentrate Volume Share (%), by Application 2025 & 2033
- Figure 43: Middle East & Africa Soft Drink Flavoured Concentrate Revenue (billion), by Type 2025 & 2033
- Figure 44: Middle East & Africa Soft Drink Flavoured Concentrate Volume (K), by Type 2025 & 2033
- Figure 45: Middle East & Africa Soft Drink Flavoured Concentrate Revenue Share (%), by Type 2025 & 2033
- Figure 46: Middle East & Africa Soft Drink Flavoured Concentrate Volume Share (%), by Type 2025 & 2033
- Figure 47: Middle East & Africa Soft Drink Flavoured Concentrate Revenue (billion), by Country 2025 & 2033
- Figure 48: Middle East & Africa Soft Drink Flavoured Concentrate Volume (K), by Country 2025 & 2033
- Figure 49: Middle East & Africa Soft Drink Flavoured Concentrate Revenue Share (%), by Country 2025 & 2033
- Figure 50: Middle East & Africa Soft Drink Flavoured Concentrate Volume Share (%), by Country 2025 & 2033
- Figure 51: Asia Pacific Soft Drink Flavoured Concentrate Revenue (billion), by Application 2025 & 2033
- Figure 52: Asia Pacific Soft Drink Flavoured Concentrate Volume (K), by Application 2025 & 2033
- Figure 53: Asia Pacific Soft Drink Flavoured Concentrate Revenue Share (%), by Application 2025 & 2033
- Figure 54: Asia Pacific Soft Drink Flavoured Concentrate Volume Share (%), by Application 2025 & 2033
- Figure 55: Asia Pacific Soft Drink Flavoured Concentrate Revenue (billion), by Type 2025 & 2033
- Figure 56: Asia Pacific Soft Drink Flavoured Concentrate Volume (K), by Type 2025 & 2033
- Figure 57: Asia Pacific Soft Drink Flavoured Concentrate Revenue Share (%), by Type 2025 & 2033
- Figure 58: Asia Pacific Soft Drink Flavoured Concentrate Volume Share (%), by Type 2025 & 2033
- Figure 59: Asia Pacific Soft Drink Flavoured Concentrate Revenue (billion), by Country 2025 & 2033
- Figure 60: Asia Pacific Soft Drink Flavoured Concentrate Volume (K), by Country 2025 & 2033
- Figure 61: Asia Pacific Soft Drink Flavoured Concentrate Revenue Share (%), by Country 2025 & 2033
- Figure 62: Asia Pacific Soft Drink Flavoured Concentrate Volume Share (%), by Country 2025 & 2033
List of Tables
- Table 1: Global Soft Drink Flavoured Concentrate Revenue billion Forecast, by Application 2020 & 2033
- Table 2: Global Soft Drink Flavoured Concentrate Volume K Forecast, by Application 2020 & 2033
- Table 3: Global Soft Drink Flavoured Concentrate Revenue billion Forecast, by Type 2020 & 2033
- Table 4: Global Soft Drink Flavoured Concentrate Volume K Forecast, by Type 2020 & 2033
- Table 5: Global Soft Drink Flavoured Concentrate Revenue billion Forecast, by Region 2020 & 2033
- Table 6: Global Soft Drink Flavoured Concentrate Volume K Forecast, by Region 2020 & 2033
- Table 7: Global Soft Drink Flavoured Concentrate Revenue billion Forecast, by Application 2020 & 2033
- Table 8: Global Soft Drink Flavoured Concentrate Volume K Forecast, by Application 2020 & 2033
- Table 9: Global Soft Drink Flavoured Concentrate Revenue billion Forecast, by Type 2020 & 2033
- Table 10: Global Soft Drink Flavoured Concentrate Volume K Forecast, by Type 2020 & 2033
- Table 11: Global Soft Drink Flavoured Concentrate Revenue billion Forecast, by Country 2020 & 2033
- Table 12: Global Soft Drink Flavoured Concentrate Volume K Forecast, by Country 2020 & 2033
- Table 13: United States Soft Drink Flavoured Concentrate Revenue (billion) Forecast, by Application 2020 & 2033
- Table 14: United States Soft Drink Flavoured Concentrate Volume (K) Forecast, by Application 2020 & 2033
- Table 15: Canada Soft Drink Flavoured Concentrate Revenue (billion) Forecast, by Application 2020 & 2033
- Table 16: Canada Soft Drink Flavoured Concentrate Volume (K) Forecast, by Application 2020 & 2033
- Table 17: Mexico Soft Drink Flavoured Concentrate Revenue (billion) Forecast, by Application 2020 & 2033
- Table 18: Mexico Soft Drink Flavoured Concentrate Volume (K) Forecast, by Application 2020 & 2033
- Table 19: Global Soft Drink Flavoured Concentrate Revenue billion Forecast, by Application 2020 & 2033
- Table 20: Global Soft Drink Flavoured Concentrate Volume K Forecast, by Application 2020 & 2033
- Table 21: Global Soft Drink Flavoured Concentrate Revenue billion Forecast, by Type 2020 & 2033
- Table 22: Global Soft Drink Flavoured Concentrate Volume K Forecast, by Type 2020 & 2033
- Table 23: Global Soft Drink Flavoured Concentrate Revenue billion Forecast, by Country 2020 & 2033
- Table 24: Global Soft Drink Flavoured Concentrate Volume K Forecast, by Country 2020 & 2033
- Table 25: Brazil Soft Drink Flavoured Concentrate Revenue (billion) Forecast, by Application 2020 & 2033
- Table 26: Brazil Soft Drink Flavoured Concentrate Volume (K) Forecast, by Application 2020 & 2033
- Table 27: Argentina Soft Drink Flavoured Concentrate Revenue (billion) Forecast, by Application 2020 & 2033
- Table 28: Argentina Soft Drink Flavoured Concentrate Volume (K) Forecast, by Application 2020 & 2033
- Table 29: Rest of South America Soft Drink Flavoured Concentrate Revenue (billion) Forecast, by Application 2020 & 2033
- Table 30: Rest of South America Soft Drink Flavoured Concentrate Volume (K) Forecast, by Application 2020 & 2033
- Table 31: Global Soft Drink Flavoured Concentrate Revenue billion Forecast, by Application 2020 & 2033
- Table 32: Global Soft Drink Flavoured Concentrate Volume K Forecast, by Application 2020 & 2033
- Table 33: Global Soft Drink Flavoured Concentrate Revenue billion Forecast, by Type 2020 & 2033
- Table 34: Global Soft Drink Flavoured Concentrate Volume K Forecast, by Type 2020 & 2033
- Table 35: Global Soft Drink Flavoured Concentrate Revenue billion Forecast, by Country 2020 & 2033
- Table 36: Global Soft Drink Flavoured Concentrate Volume K Forecast, by Country 2020 & 2033
- Table 37: United Kingdom Soft Drink Flavoured Concentrate Revenue (billion) Forecast, by Application 2020 & 2033
- Table 38: United Kingdom Soft Drink Flavoured Concentrate Volume (K) Forecast, by Application 2020 & 2033
- Table 39: Germany Soft Drink Flavoured Concentrate Revenue (billion) Forecast, by Application 2020 & 2033
- Table 40: Germany Soft Drink Flavoured Concentrate Volume (K) Forecast, by Application 2020 & 2033
- Table 41: France Soft Drink Flavoured Concentrate Revenue (billion) Forecast, by Application 2020 & 2033
- Table 42: France Soft Drink Flavoured Concentrate Volume (K) Forecast, by Application 2020 & 2033
- Table 43: Italy Soft Drink Flavoured Concentrate Revenue (billion) Forecast, by Application 2020 & 2033
- Table 44: Italy Soft Drink Flavoured Concentrate Volume (K) Forecast, by Application 2020 & 2033
- Table 45: Spain Soft Drink Flavoured Concentrate Revenue (billion) Forecast, by Application 2020 & 2033
- Table 46: Spain Soft Drink Flavoured Concentrate Volume (K) Forecast, by Application 2020 & 2033
- Table 47: Russia Soft Drink Flavoured Concentrate Revenue (billion) Forecast, by Application 2020 & 2033
- Table 48: Russia Soft Drink Flavoured Concentrate Volume (K) Forecast, by Application 2020 & 2033
- Table 49: Benelux Soft Drink Flavoured Concentrate Revenue (billion) Forecast, by Application 2020 & 2033
- Table 50: Benelux Soft Drink Flavoured Concentrate Volume (K) Forecast, by Application 2020 & 2033
- Table 51: Nordics Soft Drink Flavoured Concentrate Revenue (billion) Forecast, by Application 2020 & 2033
- Table 52: Nordics Soft Drink Flavoured Concentrate Volume (K) Forecast, by Application 2020 & 2033
- Table 53: Rest of Europe Soft Drink Flavoured Concentrate Revenue (billion) Forecast, by Application 2020 & 2033
- Table 54: Rest of Europe Soft Drink Flavoured Concentrate Volume (K) Forecast, by Application 2020 & 2033
- Table 55: Global Soft Drink Flavoured Concentrate Revenue billion Forecast, by Application 2020 & 2033
- Table 56: Global Soft Drink Flavoured Concentrate Volume K Forecast, by Application 2020 & 2033
- Table 57: Global Soft Drink Flavoured Concentrate Revenue billion Forecast, by Type 2020 & 2033
- Table 58: Global Soft Drink Flavoured Concentrate Volume K Forecast, by Type 2020 & 2033
- Table 59: Global Soft Drink Flavoured Concentrate Revenue billion Forecast, by Country 2020 & 2033
- Table 60: Global Soft Drink Flavoured Concentrate Volume K Forecast, by Country 2020 & 2033
- Table 61: Turkey Soft Drink Flavoured Concentrate Revenue (billion) Forecast, by Application 2020 & 2033
- Table 62: Turkey Soft Drink Flavoured Concentrate Volume (K) Forecast, by Application 2020 & 2033
- Table 63: Israel Soft Drink Flavoured Concentrate Revenue (billion) Forecast, by Application 2020 & 2033
- Table 64: Israel Soft Drink Flavoured Concentrate Volume (K) Forecast, by Application 2020 & 2033
- Table 65: GCC Soft Drink Flavoured Concentrate Revenue (billion) Forecast, by Application 2020 & 2033
- Table 66: GCC Soft Drink Flavoured Concentrate Volume (K) Forecast, by Application 2020 & 2033
- Table 67: North Africa Soft Drink Flavoured Concentrate Revenue (billion) Forecast, by Application 2020 & 2033
- Table 68: North Africa Soft Drink Flavoured Concentrate Volume (K) Forecast, by Application 2020 & 2033
- Table 69: South Africa Soft Drink Flavoured Concentrate Revenue (billion) Forecast, by Application 2020 & 2033
- Table 70: South Africa Soft Drink Flavoured Concentrate Volume (K) Forecast, by Application 2020 & 2033
- Table 71: Rest of Middle East & Africa Soft Drink Flavoured Concentrate Revenue (billion) Forecast, by Application 2020 & 2033
- Table 72: Rest of Middle East & Africa Soft Drink Flavoured Concentrate Volume (K) Forecast, by Application 2020 & 2033
- Table 73: Global Soft Drink Flavoured Concentrate Revenue billion Forecast, by Application 2020 & 2033
- Table 74: Global Soft Drink Flavoured Concentrate Volume K Forecast, by Application 2020 & 2033
- Table 75: Global Soft Drink Flavoured Concentrate Revenue billion Forecast, by Type 2020 & 2033
- Table 76: Global Soft Drink Flavoured Concentrate Volume K Forecast, by Type 2020 & 2033
- Table 77: Global Soft Drink Flavoured Concentrate Revenue billion Forecast, by Country 2020 & 2033
- Table 78: Global Soft Drink Flavoured Concentrate Volume K Forecast, by Country 2020 & 2033
- Table 79: China Soft Drink Flavoured Concentrate Revenue (billion) Forecast, by Application 2020 & 2033
- Table 80: China Soft Drink Flavoured Concentrate Volume (K) Forecast, by Application 2020 & 2033
- Table 81: India Soft Drink Flavoured Concentrate Revenue (billion) Forecast, by Application 2020 & 2033
- Table 82: India Soft Drink Flavoured Concentrate Volume (K) Forecast, by Application 2020 & 2033
- Table 83: Japan Soft Drink Flavoured Concentrate Revenue (billion) Forecast, by Application 2020 & 2033
- Table 84: Japan Soft Drink Flavoured Concentrate Volume (K) Forecast, by Application 2020 & 2033
- Table 85: South Korea Soft Drink Flavoured Concentrate Revenue (billion) Forecast, by Application 2020 & 2033
- Table 86: South Korea Soft Drink Flavoured Concentrate Volume (K) Forecast, by Application 2020 & 2033
- Table 87: ASEAN Soft Drink Flavoured Concentrate Revenue (billion) Forecast, by Application 2020 & 2033
- Table 88: ASEAN Soft Drink Flavoured Concentrate Volume (K) Forecast, by Application 2020 & 2033
- Table 89: Oceania Soft Drink Flavoured Concentrate Revenue (billion) Forecast, by Application 2020 & 2033
- Table 90: Oceania Soft Drink Flavoured Concentrate Volume (K) Forecast, by Application 2020 & 2033
- Table 91: Rest of Asia Pacific Soft Drink Flavoured Concentrate Revenue (billion) Forecast, by Application 2020 & 2033
- Table 92: Rest of Asia Pacific Soft Drink Flavoured Concentrate Volume (K) Forecast, by Application 2020 & 2033
Frequently Asked Questions
1. What is the projected Compound Annual Growth Rate (CAGR) of the Soft Drink Flavoured Concentrate?
The projected CAGR is approximately 5.7%.
2. Which companies are prominent players in the Soft Drink Flavoured Concentrate?
Key companies in the market include The Coca-Cola Company, Royal Crown Cola Company Inc., Pepsico Inc., Dr. Pepper Snapple Group Inc., Cott Corporation, Monster Beverage Corporation, Royal Cosun, Dohler Group, Big Red Inc., David Berryman Limited, Kraft Foods.
3. What are the main segments of the Soft Drink Flavoured Concentrate?
The market segments include Application, Type.
4. Can you provide details about the market size?
The market size is estimated to be USD 40.04 billion as of 2022.
5. What are some drivers contributing to market growth?
N/A
6. What are the notable trends driving market growth?
N/A
7. Are there any restraints impacting market growth?
N/A
8. Can you provide examples of recent developments in the market?
N/A
9. What pricing options are available for accessing the report?
Pricing options include single-user, multi-user, and enterprise licenses priced at USD 3950.00, USD 5925.00, and USD 7900.00 respectively.
10. Is the market size provided in terms of value or volume?
The market size is provided in terms of value, measured in billion and volume, measured in K.
11. Are there any specific market keywords associated with the report?
Yes, the market keyword associated with the report is "Soft Drink Flavoured Concentrate," which aids in identifying and referencing the specific market segment covered.
12. How do I determine which pricing option suits my needs best?
The pricing options vary based on user requirements and access needs. Individual users may opt for single-user licenses, while businesses requiring broader access may choose multi-user or enterprise licenses for cost-effective access to the report.
13. Are there any additional resources or data provided in the Soft Drink Flavoured Concentrate report?
While the report offers comprehensive insights, it's advisable to review the specific contents or supplementary materials provided to ascertain if additional resources or data are available.
14. How can I stay updated on further developments or reports in the Soft Drink Flavoured Concentrate?
To stay informed about further developments, trends, and reports in the Soft Drink Flavoured Concentrate, consider subscribing to industry newsletters, following relevant companies and organizations, or regularly checking reputable industry news sources and publications.
Methodology
Step 1 - Identification of Relevant Samples Size from Population Database


Step 2 - Approaches for Defining Global Market Size (Value, Volume* & Price*)

Note*: In applicable scenarios
Step 3 - Data Sources
Primary Research
- Web Analytics
- Survey Reports
- Research Institute
- Latest Research Reports
- Opinion Leaders
Secondary Research
- Annual Reports
- White Paper
- Latest Press Release
- Industry Association
- Paid Database
- Investor Presentations

Step 4 - Data Triangulation
Involves using different sources of information in order to increase the validity of a study
These sources are likely to be stakeholders in a program - participants, other researchers, program staff, other community members, and so on.
Then we put all data in single framework & apply various statistical tools to find out the dynamic on the market.
During the analysis stage, feedback from the stakeholder groups would be compared to determine areas of agreement as well as areas of divergence