


Key Insights
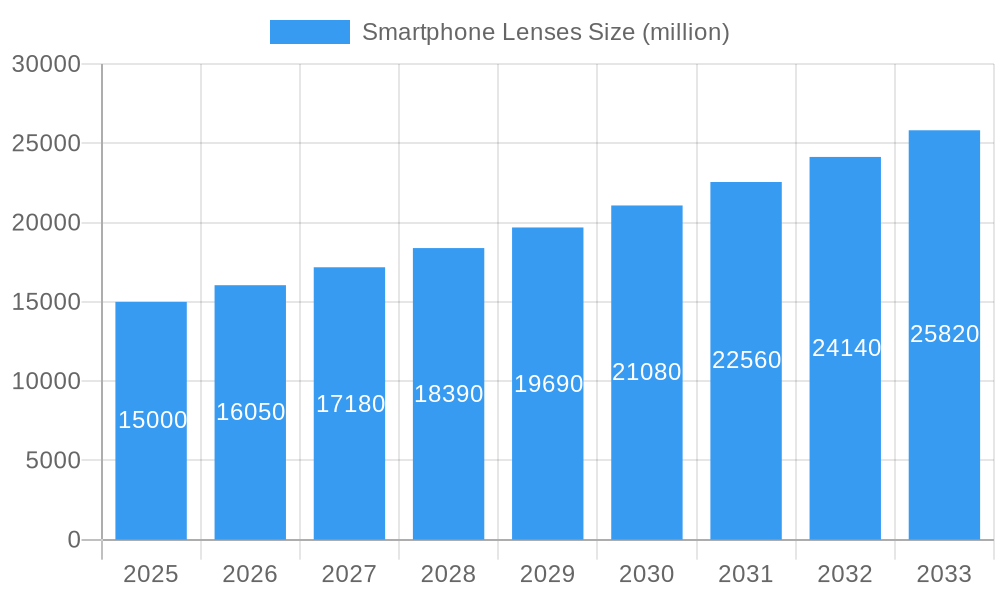
The global smartphone lens market is experiencing robust growth, driven by the increasing demand for high-resolution cameras in smartphones and the proliferation of multi-camera systems. The market, estimated at $15 billion in 2025, is projected to witness a Compound Annual Growth Rate (CAGR) of 7% from 2025 to 2033, reaching approximately $25 billion by 2033. This expansion is fueled by several key trends, including the rising adoption of higher megapixel sensors (64+ MEGA and 108+ MEGA lenses are gaining significant traction), advancements in lens technology (e.g., periscope lenses for enhanced optical zoom), and the integration of advanced features like optical image stabilization (OIS) and autofocus systems. The market is segmented by application (front and rear lenses) and by megapixel count, with higher megapixel lenses commanding a premium price point and driving overall market value. Leading players like Sunny Optical, Largan Precision, and Kantatsu Corporation hold significant market share, leveraging their technological expertise and manufacturing capabilities. However, increasing competition from emerging players and the potential for supply chain disruptions pose challenges to consistent market growth.
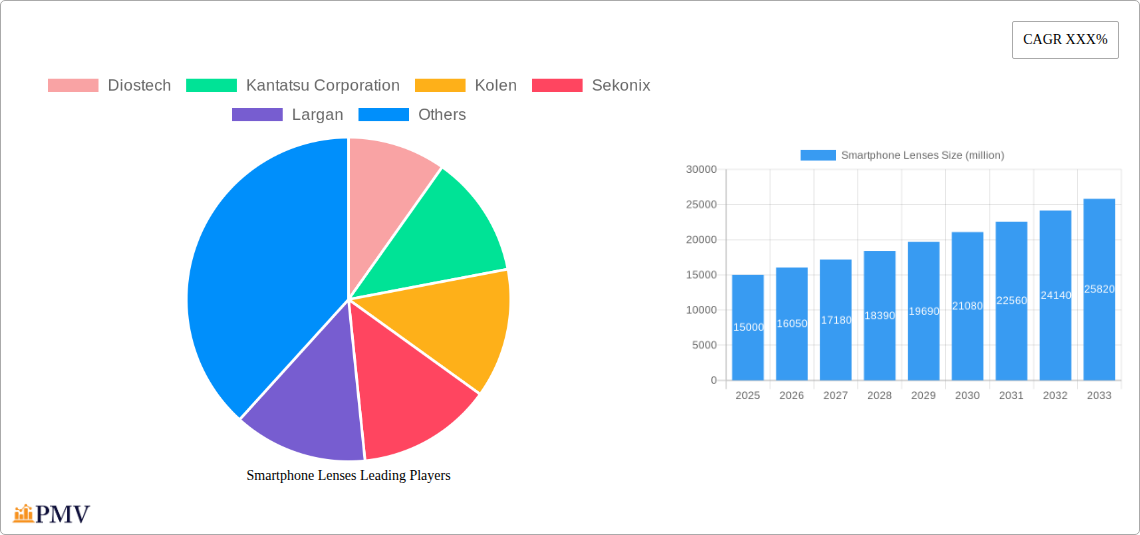
Smartphone Lenses Market Size (In Billion)

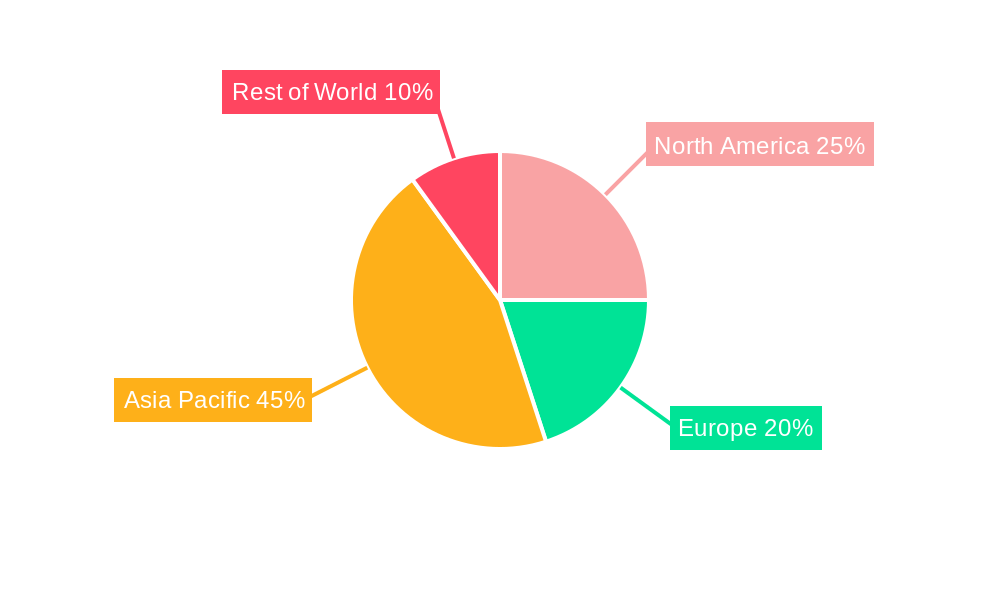
The regional landscape is diverse, with Asia Pacific, particularly China and India, dominating the market due to high smartphone production and consumption. North America and Europe also represent significant markets, showcasing strong demand for high-end smartphones with advanced camera features. While the market faces restraints such as fluctuating raw material prices and potential geopolitical uncertainties impacting supply chains, the long-term outlook remains positive, driven by continuous innovation in smartphone camera technology and the increasing penetration of smartphones in developing economies. Further segmentation analysis reveals that the 16+ MEGA and 32+ MEGA lens segments currently dominate the market but the higher megapixel segments are expected to experience substantial growth in the coming years, influencing overall market dynamics.
Smartphone Lenses Company Market Share
Smartphone Lenses Market Report: 2019-2033 - A Comprehensive Analysis
This comprehensive report provides an in-depth analysis of the global Smartphone Lenses market, offering invaluable insights for industry stakeholders, investors, and strategic decision-makers. The study covers the period from 2019 to 2033, with a focus on the forecast period (2025-2033), using 2025 as the base year and estimated year. The report meticulously examines market structure, competitive dynamics, technological advancements, and key growth drivers, providing a detailed understanding of this rapidly evolving sector. The market size is projected to reach xx million by 2033.
Smartphone Lenses Market Structure & Competitive Dynamics
The global smartphone lenses market is characterized by a moderately concentrated structure, with several key players dominating the market share. The top ten companies, including Largan, Sunny Optical, and Diostech, control an estimated xx% of the market, indicating a significant level of consolidation. However, the presence of numerous smaller players, especially in the Asian region, fosters a dynamic and competitive landscape. Innovation ecosystems are primarily concentrated in East Asia, particularly Taiwan, China, and South Korea, benefiting from robust R&D investments and a skilled workforce. Regulatory frameworks impacting the industry include those related to import/export, material sourcing, and environmental regulations, which vary by country. Product substitutes are limited; however, advances in software-based image enhancement could potentially impact demand. The market witnesses significant M&A activity, with deal values exceeding xx million in recent years. These transactions often involve smaller companies being acquired by larger players to expand their product portfolios and manufacturing capabilities.
- Market Concentration: Top 10 players control approximately xx% of the global market.
- Innovation Hubs: East Asia (Taiwan, China, South Korea).
- M&A Activity: Total deal value exceeding xx million in the past five years.
- Key Players: Largan, Sunny Optical, Diostech, and others.
Smartphone Lenses Industry Trends & Insights
The smartphone lenses market is experiencing robust growth, driven by several key factors. The increasing demand for high-resolution cameras in smartphones is a major catalyst, fueled by consumer preference for superior image quality and advanced camera features. Technological advancements, such as the development of multi-lens systems, periscope lenses, and improved sensor technology, are further propelling market growth. The rising adoption of smartphones globally, particularly in emerging economies, also contributes significantly to the market's expansion. Competitive dynamics are marked by continuous innovation, strategic partnerships, and aggressive pricing strategies. The Compound Annual Growth Rate (CAGR) for the forecast period (2025-2033) is projected at xx%, indicating substantial market expansion. Market penetration is increasing steadily, particularly for higher megapixel lenses.
Dominant Markets & Segments in Smartphone Lenses
The Asian market, particularly China, dominates the global smartphone lenses market, driven by the concentration of smartphone manufacturers and a large consumer base. Within the application segments, the rear lens segment holds a significantly larger market share than the front lens segment, reflecting consumer preferences for high-quality rear cameras. In terms of lens types, the 16+ MEGA and 24+ MEGA segments are currently experiencing the strongest growth due to the increasing demand for improved camera resolution.
- Key Drivers for Asia's Dominance: Large consumer base, established manufacturing infrastructure, and government support for technology industries.
- Application Segment Dominance: Rear lenses.
- Type Segment Dominance: 16+ MEGA and 24+ MEGA lenses.
Smartphone Lenses Product Innovations
Recent innovations include advancements in lens materials, such as the use of high-refractive index glass, enabling slimmer and more efficient lens designs. The integration of optical image stabilization (OIS) and other advanced features is also a key focus. These innovations enhance image quality, reduce camera shake, and improve low-light performance, addressing key consumer demands. The market is also seeing a growing adoption of multi-lens systems, allowing for increased zoom capabilities and wider field of view.
Report Segmentation & Scope
The report segments the market by application (front lens, rear lens) and lens type (3 MEGA, 5 MEGA, 8 MEGA, 13 MEGA, 16+ MEGA, 24+MEGA, 32+MEGA, 64+MEGA, 108+MEGA). Each segment's growth projections, market size, and competitive dynamics are thoroughly analyzed. For example, the 108+ MEGA segment is anticipated to exhibit high growth due to the premium smartphone market's expanding demand. The 3 MEGA segment, while smaller, still plays a role in budget-friendly smartphones.
Key Drivers of Smartphone Lenses Growth
The market's growth is primarily driven by the increasing demand for high-resolution cameras in smartphones, the adoption of advanced imaging technologies (like multi-lens systems), and the expansion of the smartphone market, particularly in developing countries. Technological advancements, such as the development of new lens materials and manufacturing processes, also contribute significantly to market growth. Favorable economic conditions in several key regions support the high demand for high-end smartphones and related components.
Challenges in the Smartphone Lenses Sector
The smartphone lenses sector faces challenges, including intense competition, supply chain disruptions, and the increasing cost of R&D. Fluctuations in raw material prices also impact profitability. Stringent quality standards and the need for continuous innovation to maintain a competitive edge add to the industry's challenges. The sector's dependence on advanced manufacturing technologies can lead to high capital expenditure requirements.
Leading Players in the Smartphone Lenses Market
- Diostech
- Kantatsu Corporation
- Kolen
- Sekonix
- Largan
- Sunny Optical
- GeniuS Electronic Optical (GSEO)
- CoAsia Optics Corp
- Asia Optical
- Newmax
- Ability Opto-Electronics Technology
- KINKO OPTICAL CO., LTD.
- Guangdong Xuye Optoelectronics Technology
- Foxconn International
- Q Technology Group
Key Developments in Smartphone Lenses Sector
- 2022 Q4: Sunny Optical announced a new periscope lens technology.
- 2023 Q1: Largan launched a high-resolution lens for next-generation smartphones.
- 2023 Q3: Diostech partnered with a major smartphone manufacturer for a new camera system. (Further developments will be added in the final report)
Strategic Smartphone Lenses Market Outlook
The smartphone lenses market is poised for continued growth, fueled by ongoing technological advancements, the expansion of the smartphone market, and increased consumer demand for enhanced camera features. Strategic opportunities lie in developing innovative lens technologies, such as improved zoom capabilities, enhanced low-light performance, and smaller, more energy-efficient designs. Companies focusing on high-quality production, R&D, and strategic partnerships are expected to thrive in this dynamic market.
Smartphone Lenses Segmentation
-
1. Application
- 1.1. Front Lens
- 1.2. Rear Lens
-
2. Type
- 2.1. 3 MEGA
- 2.2. 5 MEGA
- 2.3. 8 MEGA
- 2.4. 13 MEGA
- 2.5. 16+ MEGA
- 2.6. 24+MEGA
- 2.7. 32+MEGA
- 2.8. 64+MEGA
- 2.9. 108+MEGA
Smartphone Lenses Segmentation By Geography
-
1. North America
- 1.1. United States
- 1.2. Canada
- 1.3. Mexico
-
2. South America
- 2.1. Brazil
- 2.2. Argentina
- 2.3. Rest of South America
-
3. Europe
- 3.1. United Kingdom
- 3.2. Germany
- 3.3. France
- 3.4. Italy
- 3.5. Spain
- 3.6. Russia
- 3.7. Benelux
- 3.8. Nordics
- 3.9. Rest of Europe
-
4. Middle East & Africa
- 4.1. Turkey
- 4.2. Israel
- 4.3. GCC
- 4.4. North Africa
- 4.5. South Africa
- 4.6. Rest of Middle East & Africa
-
5. Asia Pacific
- 5.1. China
- 5.2. India
- 5.3. Japan
- 5.4. South Korea
- 5.5. ASEAN
- 5.6. Oceania
- 5.7. Rest of Asia Pacific
Smartphone Lenses Regional Market Share
Geographic Coverage of Smartphone Lenses
Smartphone Lenses REPORT HIGHLIGHTS
| Aspects | Details |
|---|---|
| Study Period | 2020-2034 |
| Base Year | 2025 |
| Estimated Year | 2026 |
| Forecast Period | 2026-2034 |
| Historical Period | 2020-2025 |
| Growth Rate | CAGR of 6.87% from 2020-2034 |
| Segmentation |
|
Table of Contents
- 1. Introduction
- 1.1. Research Scope
- 1.2. Market Segmentation
- 1.3. Research Methodology
- 1.4. Definitions and Assumptions
- 2. Executive Summary
- 2.1. Introduction
- 3. Market Dynamics
- 3.1. Introduction
- 3.2. Market Drivers
- 3.3. Market Restrains
- 3.4. Market Trends
- 4. Market Factor Analysis
- 4.1. Porters Five Forces
- 4.2. Supply/Value Chain
- 4.3. PESTEL analysis
- 4.4. Market Entropy
- 4.5. Patent/Trademark Analysis
- 5. Global Smartphone Lenses Analysis, Insights and Forecast, 2020-2032
- 5.1. Market Analysis, Insights and Forecast - by Application
- 5.1.1. Front Lens
- 5.1.2. Rear Lens
- 5.2. Market Analysis, Insights and Forecast - by Type
- 5.2.1. 3 MEGA
- 5.2.2. 5 MEGA
- 5.2.3. 8 MEGA
- 5.2.4. 13 MEGA
- 5.2.5. 16+ MEGA
- 5.2.6. 24+MEGA
- 5.2.7. 32+MEGA
- 5.2.8. 64+MEGA
- 5.2.9. 108+MEGA
- 5.3. Market Analysis, Insights and Forecast - by Region
- 5.3.1. North America
- 5.3.2. South America
- 5.3.3. Europe
- 5.3.4. Middle East & Africa
- 5.3.5. Asia Pacific
- 5.1. Market Analysis, Insights and Forecast - by Application
- 6. North America Smartphone Lenses Analysis, Insights and Forecast, 2020-2032
- 6.1. Market Analysis, Insights and Forecast - by Application
- 6.1.1. Front Lens
- 6.1.2. Rear Lens
- 6.2. Market Analysis, Insights and Forecast - by Type
- 6.2.1. 3 MEGA
- 6.2.2. 5 MEGA
- 6.2.3. 8 MEGA
- 6.2.4. 13 MEGA
- 6.2.5. 16+ MEGA
- 6.2.6. 24+MEGA
- 6.2.7. 32+MEGA
- 6.2.8. 64+MEGA
- 6.2.9. 108+MEGA
- 6.1. Market Analysis, Insights and Forecast - by Application
- 7. South America Smartphone Lenses Analysis, Insights and Forecast, 2020-2032
- 7.1. Market Analysis, Insights and Forecast - by Application
- 7.1.1. Front Lens
- 7.1.2. Rear Lens
- 7.2. Market Analysis, Insights and Forecast - by Type
- 7.2.1. 3 MEGA
- 7.2.2. 5 MEGA
- 7.2.3. 8 MEGA
- 7.2.4. 13 MEGA
- 7.2.5. 16+ MEGA
- 7.2.6. 24+MEGA
- 7.2.7. 32+MEGA
- 7.2.8. 64+MEGA
- 7.2.9. 108+MEGA
- 7.1. Market Analysis, Insights and Forecast - by Application
- 8. Europe Smartphone Lenses Analysis, Insights and Forecast, 2020-2032
- 8.1. Market Analysis, Insights and Forecast - by Application
- 8.1.1. Front Lens
- 8.1.2. Rear Lens
- 8.2. Market Analysis, Insights and Forecast - by Type
- 8.2.1. 3 MEGA
- 8.2.2. 5 MEGA
- 8.2.3. 8 MEGA
- 8.2.4. 13 MEGA
- 8.2.5. 16+ MEGA
- 8.2.6. 24+MEGA
- 8.2.7. 32+MEGA
- 8.2.8. 64+MEGA
- 8.2.9. 108+MEGA
- 8.1. Market Analysis, Insights and Forecast - by Application
- 9. Middle East & Africa Smartphone Lenses Analysis, Insights and Forecast, 2020-2032
- 9.1. Market Analysis, Insights and Forecast - by Application
- 9.1.1. Front Lens
- 9.1.2. Rear Lens
- 9.2. Market Analysis, Insights and Forecast - by Type
- 9.2.1. 3 MEGA
- 9.2.2. 5 MEGA
- 9.2.3. 8 MEGA
- 9.2.4. 13 MEGA
- 9.2.5. 16+ MEGA
- 9.2.6. 24+MEGA
- 9.2.7. 32+MEGA
- 9.2.8. 64+MEGA
- 9.2.9. 108+MEGA
- 9.1. Market Analysis, Insights and Forecast - by Application
- 10. Asia Pacific Smartphone Lenses Analysis, Insights and Forecast, 2020-2032
- 10.1. Market Analysis, Insights and Forecast - by Application
- 10.1.1. Front Lens
- 10.1.2. Rear Lens
- 10.2. Market Analysis, Insights and Forecast - by Type
- 10.2.1. 3 MEGA
- 10.2.2. 5 MEGA
- 10.2.3. 8 MEGA
- 10.2.4. 13 MEGA
- 10.2.5. 16+ MEGA
- 10.2.6. 24+MEGA
- 10.2.7. 32+MEGA
- 10.2.8. 64+MEGA
- 10.2.9. 108+MEGA
- 10.1. Market Analysis, Insights and Forecast - by Application
- 11. Competitive Analysis
- 11.1. Global Market Share Analysis 2025
- 11.2. Company Profiles
- 11.2.1 Diostech
- 11.2.1.1. Overview
- 11.2.1.2. Products
- 11.2.1.3. SWOT Analysis
- 11.2.1.4. Recent Developments
- 11.2.1.5. Financials (Based on Availability)
- 11.2.2 Kantatsu Corporation
- 11.2.2.1. Overview
- 11.2.2.2. Products
- 11.2.2.3. SWOT Analysis
- 11.2.2.4. Recent Developments
- 11.2.2.5. Financials (Based on Availability)
- 11.2.3 Kolen
- 11.2.3.1. Overview
- 11.2.3.2. Products
- 11.2.3.3. SWOT Analysis
- 11.2.3.4. Recent Developments
- 11.2.3.5. Financials (Based on Availability)
- 11.2.4 Sekonix
- 11.2.4.1. Overview
- 11.2.4.2. Products
- 11.2.4.3. SWOT Analysis
- 11.2.4.4. Recent Developments
- 11.2.4.5. Financials (Based on Availability)
- 11.2.5 Largan
- 11.2.5.1. Overview
- 11.2.5.2. Products
- 11.2.5.3. SWOT Analysis
- 11.2.5.4. Recent Developments
- 11.2.5.5. Financials (Based on Availability)
- 11.2.6 Sunny Optical
- 11.2.6.1. Overview
- 11.2.6.2. Products
- 11.2.6.3. SWOT Analysis
- 11.2.6.4. Recent Developments
- 11.2.6.5. Financials (Based on Availability)
- 11.2.7 GeniuS Electronic Optical (GSEO)
- 11.2.7.1. Overview
- 11.2.7.2. Products
- 11.2.7.3. SWOT Analysis
- 11.2.7.4. Recent Developments
- 11.2.7.5. Financials (Based on Availability)
- 11.2.8 CoAsia Optics Corp
- 11.2.8.1. Overview
- 11.2.8.2. Products
- 11.2.8.3. SWOT Analysis
- 11.2.8.4. Recent Developments
- 11.2.8.5. Financials (Based on Availability)
- 11.2.9 Asia Optical
- 11.2.9.1. Overview
- 11.2.9.2. Products
- 11.2.9.3. SWOT Analysis
- 11.2.9.4. Recent Developments
- 11.2.9.5. Financials (Based on Availability)
- 11.2.10 Newmax
- 11.2.10.1. Overview
- 11.2.10.2. Products
- 11.2.10.3. SWOT Analysis
- 11.2.10.4. Recent Developments
- 11.2.10.5. Financials (Based on Availability)
- 11.2.11 Ability Opto-Electronics Technology
- 11.2.11.1. Overview
- 11.2.11.2. Products
- 11.2.11.3. SWOT Analysis
- 11.2.11.4. Recent Developments
- 11.2.11.5. Financials (Based on Availability)
- 11.2.12 KINKO OPTICAL CO. LTD.
- 11.2.12.1. Overview
- 11.2.12.2. Products
- 11.2.12.3. SWOT Analysis
- 11.2.12.4. Recent Developments
- 11.2.12.5. Financials (Based on Availability)
- 11.2.13 Guangdong Xuye Optoelectronics Technology
- 11.2.13.1. Overview
- 11.2.13.2. Products
- 11.2.13.3. SWOT Analysis
- 11.2.13.4. Recent Developments
- 11.2.13.5. Financials (Based on Availability)
- 11.2.14 Foxconn International
- 11.2.14.1. Overview
- 11.2.14.2. Products
- 11.2.14.3. SWOT Analysis
- 11.2.14.4. Recent Developments
- 11.2.14.5. Financials (Based on Availability)
- 11.2.15 Q Technology Group
- 11.2.15.1. Overview
- 11.2.15.2. Products
- 11.2.15.3. SWOT Analysis
- 11.2.15.4. Recent Developments
- 11.2.15.5. Financials (Based on Availability)
- 11.2.1 Diostech
List of Figures
- Figure 1: Global Smartphone Lenses Revenue Breakdown (undefined, %) by Region 2025 & 2033
- Figure 2: Global Smartphone Lenses Volume Breakdown (K, %) by Region 2025 & 2033
- Figure 3: North America Smartphone Lenses Revenue (undefined), by Application 2025 & 2033
- Figure 4: North America Smartphone Lenses Volume (K), by Application 2025 & 2033
- Figure 5: North America Smartphone Lenses Revenue Share (%), by Application 2025 & 2033
- Figure 6: North America Smartphone Lenses Volume Share (%), by Application 2025 & 2033
- Figure 7: North America Smartphone Lenses Revenue (undefined), by Type 2025 & 2033
- Figure 8: North America Smartphone Lenses Volume (K), by Type 2025 & 2033
- Figure 9: North America Smartphone Lenses Revenue Share (%), by Type 2025 & 2033
- Figure 10: North America Smartphone Lenses Volume Share (%), by Type 2025 & 2033
- Figure 11: North America Smartphone Lenses Revenue (undefined), by Country 2025 & 2033
- Figure 12: North America Smartphone Lenses Volume (K), by Country 2025 & 2033
- Figure 13: North America Smartphone Lenses Revenue Share (%), by Country 2025 & 2033
- Figure 14: North America Smartphone Lenses Volume Share (%), by Country 2025 & 2033
- Figure 15: South America Smartphone Lenses Revenue (undefined), by Application 2025 & 2033
- Figure 16: South America Smartphone Lenses Volume (K), by Application 2025 & 2033
- Figure 17: South America Smartphone Lenses Revenue Share (%), by Application 2025 & 2033
- Figure 18: South America Smartphone Lenses Volume Share (%), by Application 2025 & 2033
- Figure 19: South America Smartphone Lenses Revenue (undefined), by Type 2025 & 2033
- Figure 20: South America Smartphone Lenses Volume (K), by Type 2025 & 2033
- Figure 21: South America Smartphone Lenses Revenue Share (%), by Type 2025 & 2033
- Figure 22: South America Smartphone Lenses Volume Share (%), by Type 2025 & 2033
- Figure 23: South America Smartphone Lenses Revenue (undefined), by Country 2025 & 2033
- Figure 24: South America Smartphone Lenses Volume (K), by Country 2025 & 2033
- Figure 25: South America Smartphone Lenses Revenue Share (%), by Country 2025 & 2033
- Figure 26: South America Smartphone Lenses Volume Share (%), by Country 2025 & 2033
- Figure 27: Europe Smartphone Lenses Revenue (undefined), by Application 2025 & 2033
- Figure 28: Europe Smartphone Lenses Volume (K), by Application 2025 & 2033
- Figure 29: Europe Smartphone Lenses Revenue Share (%), by Application 2025 & 2033
- Figure 30: Europe Smartphone Lenses Volume Share (%), by Application 2025 & 2033
- Figure 31: Europe Smartphone Lenses Revenue (undefined), by Type 2025 & 2033
- Figure 32: Europe Smartphone Lenses Volume (K), by Type 2025 & 2033
- Figure 33: Europe Smartphone Lenses Revenue Share (%), by Type 2025 & 2033
- Figure 34: Europe Smartphone Lenses Volume Share (%), by Type 2025 & 2033
- Figure 35: Europe Smartphone Lenses Revenue (undefined), by Country 2025 & 2033
- Figure 36: Europe Smartphone Lenses Volume (K), by Country 2025 & 2033
- Figure 37: Europe Smartphone Lenses Revenue Share (%), by Country 2025 & 2033
- Figure 38: Europe Smartphone Lenses Volume Share (%), by Country 2025 & 2033
- Figure 39: Middle East & Africa Smartphone Lenses Revenue (undefined), by Application 2025 & 2033
- Figure 40: Middle East & Africa Smartphone Lenses Volume (K), by Application 2025 & 2033
- Figure 41: Middle East & Africa Smartphone Lenses Revenue Share (%), by Application 2025 & 2033
- Figure 42: Middle East & Africa Smartphone Lenses Volume Share (%), by Application 2025 & 2033
- Figure 43: Middle East & Africa Smartphone Lenses Revenue (undefined), by Type 2025 & 2033
- Figure 44: Middle East & Africa Smartphone Lenses Volume (K), by Type 2025 & 2033
- Figure 45: Middle East & Africa Smartphone Lenses Revenue Share (%), by Type 2025 & 2033
- Figure 46: Middle East & Africa Smartphone Lenses Volume Share (%), by Type 2025 & 2033
- Figure 47: Middle East & Africa Smartphone Lenses Revenue (undefined), by Country 2025 & 2033
- Figure 48: Middle East & Africa Smartphone Lenses Volume (K), by Country 2025 & 2033
- Figure 49: Middle East & Africa Smartphone Lenses Revenue Share (%), by Country 2025 & 2033
- Figure 50: Middle East & Africa Smartphone Lenses Volume Share (%), by Country 2025 & 2033
- Figure 51: Asia Pacific Smartphone Lenses Revenue (undefined), by Application 2025 & 2033
- Figure 52: Asia Pacific Smartphone Lenses Volume (K), by Application 2025 & 2033
- Figure 53: Asia Pacific Smartphone Lenses Revenue Share (%), by Application 2025 & 2033
- Figure 54: Asia Pacific Smartphone Lenses Volume Share (%), by Application 2025 & 2033
- Figure 55: Asia Pacific Smartphone Lenses Revenue (undefined), by Type 2025 & 2033
- Figure 56: Asia Pacific Smartphone Lenses Volume (K), by Type 2025 & 2033
- Figure 57: Asia Pacific Smartphone Lenses Revenue Share (%), by Type 2025 & 2033
- Figure 58: Asia Pacific Smartphone Lenses Volume Share (%), by Type 2025 & 2033
- Figure 59: Asia Pacific Smartphone Lenses Revenue (undefined), by Country 2025 & 2033
- Figure 60: Asia Pacific Smartphone Lenses Volume (K), by Country 2025 & 2033
- Figure 61: Asia Pacific Smartphone Lenses Revenue Share (%), by Country 2025 & 2033
- Figure 62: Asia Pacific Smartphone Lenses Volume Share (%), by Country 2025 & 2033
List of Tables
- Table 1: Global Smartphone Lenses Revenue undefined Forecast, by Application 2020 & 2033
- Table 2: Global Smartphone Lenses Volume K Forecast, by Application 2020 & 2033
- Table 3: Global Smartphone Lenses Revenue undefined Forecast, by Type 2020 & 2033
- Table 4: Global Smartphone Lenses Volume K Forecast, by Type 2020 & 2033
- Table 5: Global Smartphone Lenses Revenue undefined Forecast, by Region 2020 & 2033
- Table 6: Global Smartphone Lenses Volume K Forecast, by Region 2020 & 2033
- Table 7: Global Smartphone Lenses Revenue undefined Forecast, by Application 2020 & 2033
- Table 8: Global Smartphone Lenses Volume K Forecast, by Application 2020 & 2033
- Table 9: Global Smartphone Lenses Revenue undefined Forecast, by Type 2020 & 2033
- Table 10: Global Smartphone Lenses Volume K Forecast, by Type 2020 & 2033
- Table 11: Global Smartphone Lenses Revenue undefined Forecast, by Country 2020 & 2033
- Table 12: Global Smartphone Lenses Volume K Forecast, by Country 2020 & 2033
- Table 13: United States Smartphone Lenses Revenue (undefined) Forecast, by Application 2020 & 2033
- Table 14: United States Smartphone Lenses Volume (K) Forecast, by Application 2020 & 2033
- Table 15: Canada Smartphone Lenses Revenue (undefined) Forecast, by Application 2020 & 2033
- Table 16: Canada Smartphone Lenses Volume (K) Forecast, by Application 2020 & 2033
- Table 17: Mexico Smartphone Lenses Revenue (undefined) Forecast, by Application 2020 & 2033
- Table 18: Mexico Smartphone Lenses Volume (K) Forecast, by Application 2020 & 2033
- Table 19: Global Smartphone Lenses Revenue undefined Forecast, by Application 2020 & 2033
- Table 20: Global Smartphone Lenses Volume K Forecast, by Application 2020 & 2033
- Table 21: Global Smartphone Lenses Revenue undefined Forecast, by Type 2020 & 2033
- Table 22: Global Smartphone Lenses Volume K Forecast, by Type 2020 & 2033
- Table 23: Global Smartphone Lenses Revenue undefined Forecast, by Country 2020 & 2033
- Table 24: Global Smartphone Lenses Volume K Forecast, by Country 2020 & 2033
- Table 25: Brazil Smartphone Lenses Revenue (undefined) Forecast, by Application 2020 & 2033
- Table 26: Brazil Smartphone Lenses Volume (K) Forecast, by Application 2020 & 2033
- Table 27: Argentina Smartphone Lenses Revenue (undefined) Forecast, by Application 2020 & 2033
- Table 28: Argentina Smartphone Lenses Volume (K) Forecast, by Application 2020 & 2033
- Table 29: Rest of South America Smartphone Lenses Revenue (undefined) Forecast, by Application 2020 & 2033
- Table 30: Rest of South America Smartphone Lenses Volume (K) Forecast, by Application 2020 & 2033
- Table 31: Global Smartphone Lenses Revenue undefined Forecast, by Application 2020 & 2033
- Table 32: Global Smartphone Lenses Volume K Forecast, by Application 2020 & 2033
- Table 33: Global Smartphone Lenses Revenue undefined Forecast, by Type 2020 & 2033
- Table 34: Global Smartphone Lenses Volume K Forecast, by Type 2020 & 2033
- Table 35: Global Smartphone Lenses Revenue undefined Forecast, by Country 2020 & 2033
- Table 36: Global Smartphone Lenses Volume K Forecast, by Country 2020 & 2033
- Table 37: United Kingdom Smartphone Lenses Revenue (undefined) Forecast, by Application 2020 & 2033
- Table 38: United Kingdom Smartphone Lenses Volume (K) Forecast, by Application 2020 & 2033
- Table 39: Germany Smartphone Lenses Revenue (undefined) Forecast, by Application 2020 & 2033
- Table 40: Germany Smartphone Lenses Volume (K) Forecast, by Application 2020 & 2033
- Table 41: France Smartphone Lenses Revenue (undefined) Forecast, by Application 2020 & 2033
- Table 42: France Smartphone Lenses Volume (K) Forecast, by Application 2020 & 2033
- Table 43: Italy Smartphone Lenses Revenue (undefined) Forecast, by Application 2020 & 2033
- Table 44: Italy Smartphone Lenses Volume (K) Forecast, by Application 2020 & 2033
- Table 45: Spain Smartphone Lenses Revenue (undefined) Forecast, by Application 2020 & 2033
- Table 46: Spain Smartphone Lenses Volume (K) Forecast, by Application 2020 & 2033
- Table 47: Russia Smartphone Lenses Revenue (undefined) Forecast, by Application 2020 & 2033
- Table 48: Russia Smartphone Lenses Volume (K) Forecast, by Application 2020 & 2033
- Table 49: Benelux Smartphone Lenses Revenue (undefined) Forecast, by Application 2020 & 2033
- Table 50: Benelux Smartphone Lenses Volume (K) Forecast, by Application 2020 & 2033
- Table 51: Nordics Smartphone Lenses Revenue (undefined) Forecast, by Application 2020 & 2033
- Table 52: Nordics Smartphone Lenses Volume (K) Forecast, by Application 2020 & 2033
- Table 53: Rest of Europe Smartphone Lenses Revenue (undefined) Forecast, by Application 2020 & 2033
- Table 54: Rest of Europe Smartphone Lenses Volume (K) Forecast, by Application 2020 & 2033
- Table 55: Global Smartphone Lenses Revenue undefined Forecast, by Application 2020 & 2033
- Table 56: Global Smartphone Lenses Volume K Forecast, by Application 2020 & 2033
- Table 57: Global Smartphone Lenses Revenue undefined Forecast, by Type 2020 & 2033
- Table 58: Global Smartphone Lenses Volume K Forecast, by Type 2020 & 2033
- Table 59: Global Smartphone Lenses Revenue undefined Forecast, by Country 2020 & 2033
- Table 60: Global Smartphone Lenses Volume K Forecast, by Country 2020 & 2033
- Table 61: Turkey Smartphone Lenses Revenue (undefined) Forecast, by Application 2020 & 2033
- Table 62: Turkey Smartphone Lenses Volume (K) Forecast, by Application 2020 & 2033
- Table 63: Israel Smartphone Lenses Revenue (undefined) Forecast, by Application 2020 & 2033
- Table 64: Israel Smartphone Lenses Volume (K) Forecast, by Application 2020 & 2033
- Table 65: GCC Smartphone Lenses Revenue (undefined) Forecast, by Application 2020 & 2033
- Table 66: GCC Smartphone Lenses Volume (K) Forecast, by Application 2020 & 2033
- Table 67: North Africa Smartphone Lenses Revenue (undefined) Forecast, by Application 2020 & 2033
- Table 68: North Africa Smartphone Lenses Volume (K) Forecast, by Application 2020 & 2033
- Table 69: South Africa Smartphone Lenses Revenue (undefined) Forecast, by Application 2020 & 2033
- Table 70: South Africa Smartphone Lenses Volume (K) Forecast, by Application 2020 & 2033
- Table 71: Rest of Middle East & Africa Smartphone Lenses Revenue (undefined) Forecast, by Application 2020 & 2033
- Table 72: Rest of Middle East & Africa Smartphone Lenses Volume (K) Forecast, by Application 2020 & 2033
- Table 73: Global Smartphone Lenses Revenue undefined Forecast, by Application 2020 & 2033
- Table 74: Global Smartphone Lenses Volume K Forecast, by Application 2020 & 2033
- Table 75: Global Smartphone Lenses Revenue undefined Forecast, by Type 2020 & 2033
- Table 76: Global Smartphone Lenses Volume K Forecast, by Type 2020 & 2033
- Table 77: Global Smartphone Lenses Revenue undefined Forecast, by Country 2020 & 2033
- Table 78: Global Smartphone Lenses Volume K Forecast, by Country 2020 & 2033
- Table 79: China Smartphone Lenses Revenue (undefined) Forecast, by Application 2020 & 2033
- Table 80: China Smartphone Lenses Volume (K) Forecast, by Application 2020 & 2033
- Table 81: India Smartphone Lenses Revenue (undefined) Forecast, by Application 2020 & 2033
- Table 82: India Smartphone Lenses Volume (K) Forecast, by Application 2020 & 2033
- Table 83: Japan Smartphone Lenses Revenue (undefined) Forecast, by Application 2020 & 2033
- Table 84: Japan Smartphone Lenses Volume (K) Forecast, by Application 2020 & 2033
- Table 85: South Korea Smartphone Lenses Revenue (undefined) Forecast, by Application 2020 & 2033
- Table 86: South Korea Smartphone Lenses Volume (K) Forecast, by Application 2020 & 2033
- Table 87: ASEAN Smartphone Lenses Revenue (undefined) Forecast, by Application 2020 & 2033
- Table 88: ASEAN Smartphone Lenses Volume (K) Forecast, by Application 2020 & 2033
- Table 89: Oceania Smartphone Lenses Revenue (undefined) Forecast, by Application 2020 & 2033
- Table 90: Oceania Smartphone Lenses Volume (K) Forecast, by Application 2020 & 2033
- Table 91: Rest of Asia Pacific Smartphone Lenses Revenue (undefined) Forecast, by Application 2020 & 2033
- Table 92: Rest of Asia Pacific Smartphone Lenses Volume (K) Forecast, by Application 2020 & 2033
Frequently Asked Questions
1. What is the projected Compound Annual Growth Rate (CAGR) of the Smartphone Lenses?
The projected CAGR is approximately 6.87%.
2. Which companies are prominent players in the Smartphone Lenses?
Key companies in the market include Diostech, Kantatsu Corporation, Kolen, Sekonix, Largan, Sunny Optical, GeniuS Electronic Optical (GSEO), CoAsia Optics Corp, Asia Optical, Newmax, Ability Opto-Electronics Technology, KINKO OPTICAL CO., LTD., Guangdong Xuye Optoelectronics Technology, Foxconn International, Q Technology Group.
3. What are the main segments of the Smartphone Lenses?
The market segments include Application, Type.
4. Can you provide details about the market size?
The market size is estimated to be USD XXX N/A as of 2022.
5. What are some drivers contributing to market growth?
N/A
6. What are the notable trends driving market growth?
N/A
7. Are there any restraints impacting market growth?
N/A
8. Can you provide examples of recent developments in the market?
N/A
9. What pricing options are available for accessing the report?
Pricing options include single-user, multi-user, and enterprise licenses priced at USD 3950.00, USD 5925.00, and USD 7900.00 respectively.
10. Is the market size provided in terms of value or volume?
The market size is provided in terms of value, measured in N/A and volume, measured in K.
11. Are there any specific market keywords associated with the report?
Yes, the market keyword associated with the report is "Smartphone Lenses," which aids in identifying and referencing the specific market segment covered.
12. How do I determine which pricing option suits my needs best?
The pricing options vary based on user requirements and access needs. Individual users may opt for single-user licenses, while businesses requiring broader access may choose multi-user or enterprise licenses for cost-effective access to the report.
13. Are there any additional resources or data provided in the Smartphone Lenses report?
While the report offers comprehensive insights, it's advisable to review the specific contents or supplementary materials provided to ascertain if additional resources or data are available.
14. How can I stay updated on further developments or reports in the Smartphone Lenses?
To stay informed about further developments, trends, and reports in the Smartphone Lenses, consider subscribing to industry newsletters, following relevant companies and organizations, or regularly checking reputable industry news sources and publications.
Methodology
Step 1 - Identification of Relevant Samples Size from Population Database


Step 2 - Approaches for Defining Global Market Size (Value, Volume* & Price*)

Note*: In applicable scenarios
Step 3 - Data Sources
Primary Research
- Web Analytics
- Survey Reports
- Research Institute
- Latest Research Reports
- Opinion Leaders
Secondary Research
- Annual Reports
- White Paper
- Latest Press Release
- Industry Association
- Paid Database
- Investor Presentations

Step 4 - Data Triangulation
Involves using different sources of information in order to increase the validity of a study
These sources are likely to be stakeholders in a program - participants, other researchers, program staff, other community members, and so on.
Then we put all data in single framework & apply various statistical tools to find out the dynamic on the market.
During the analysis stage, feedback from the stakeholder groups would be compared to determine areas of agreement as well as areas of divergence