
Key Insights
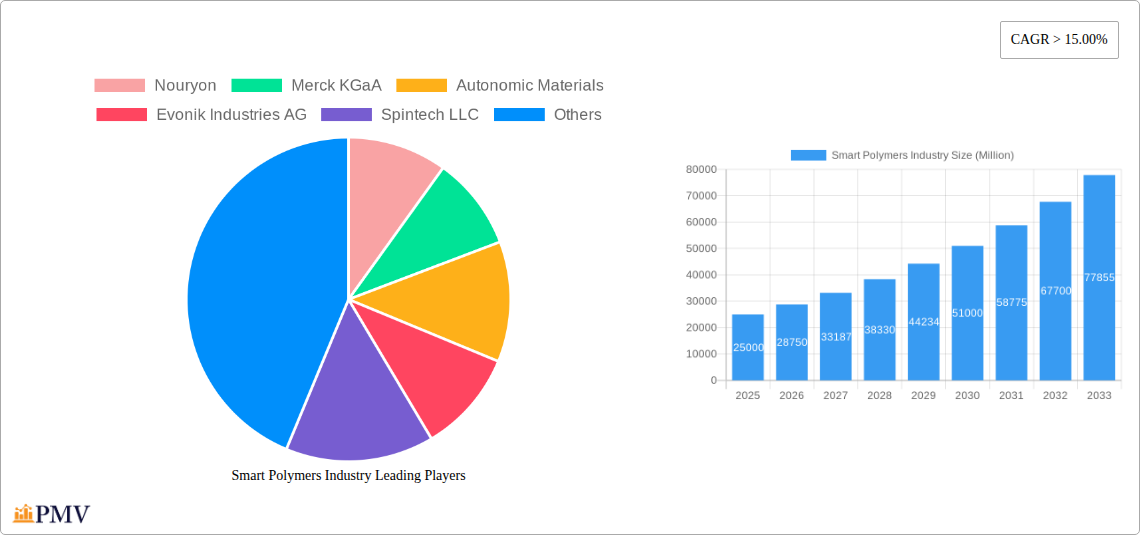
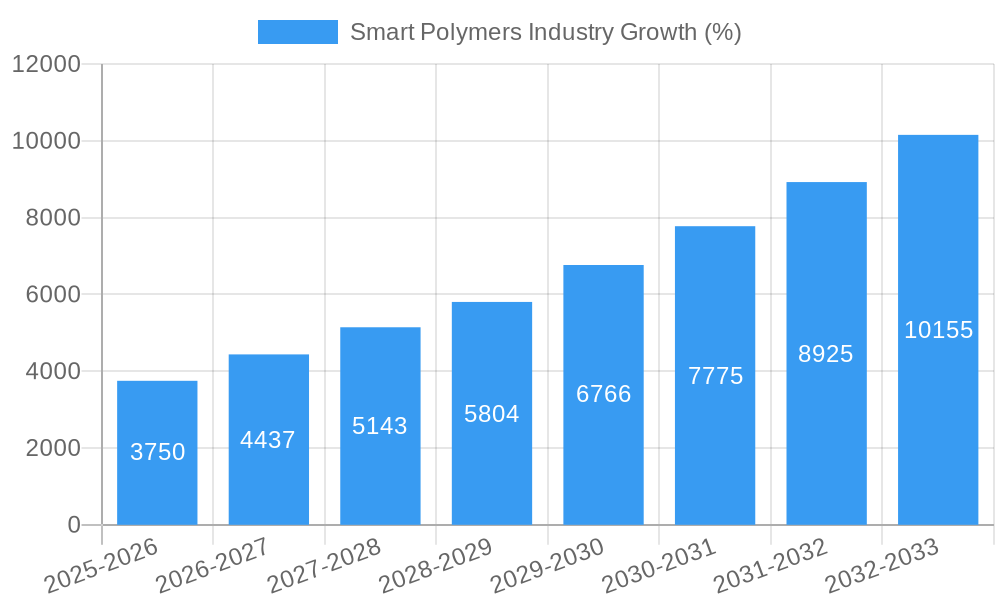
The smart polymers market is experiencing robust growth, driven by increasing demand across diverse sectors. A compound annual growth rate (CAGR) exceeding 15% from 2019 to 2024 indicates a significant expansion, projected to continue through 2033. This surge is fueled by several key factors. The biomedical and healthcare industry is a major driver, with smart polymers finding applications in drug delivery systems, tissue engineering, and advanced prosthetics. The electrical and electronics sector also contributes significantly, leveraging smart polymers' properties for flexible displays, sensors, and actuators. Furthermore, the automotive industry is adopting smart polymers for lightweighting and improved safety features, while the textile industry benefits from their use in creating performance fabrics. Technological advancements in material science, particularly in the development of self-healing and stimuli-responsive polymers, are further propelling market expansion. The ability of these materials to adapt to changing conditions, offering enhanced functionality and durability, is a key differentiator driving adoption. While supply chain constraints and the cost of advanced materials present some challenges, the overall market outlook remains highly positive, fueled by ongoing innovation and the expanding application base across diverse industries.
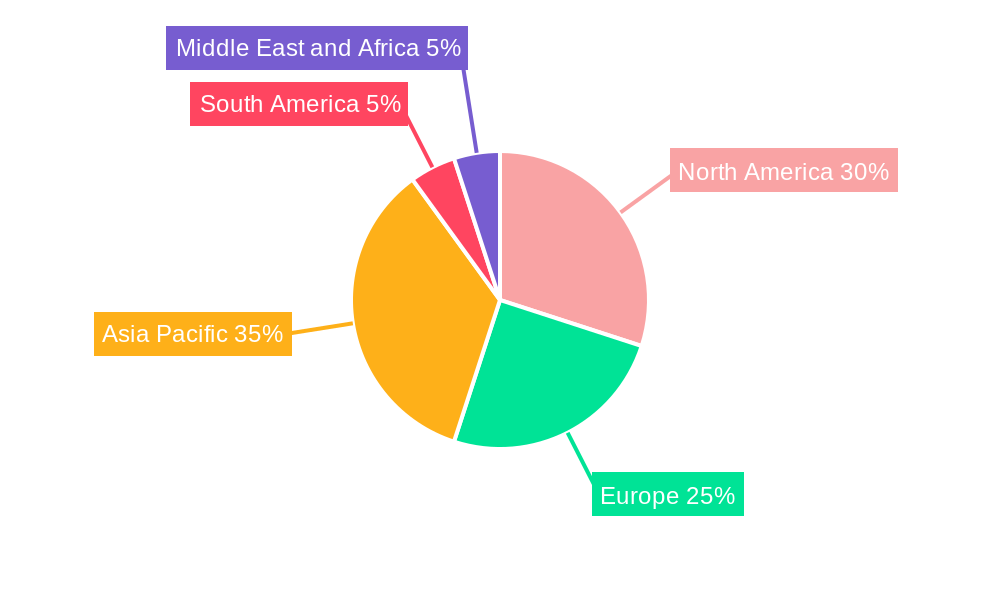
The market segmentation reveals a dynamic landscape. Electroactive and magnetically-responsive polymers are leading the way, followed by pH-responsive and biologically-stimuli responsive types. Self-healing polymers are a rapidly growing segment, capitalizing on their inherent ability to repair minor damage, extending product lifespan and reducing material waste. Geographic analysis suggests that the Asia-Pacific region, particularly China and India, is a significant growth engine, driven by increasing industrialization and rising disposable incomes. North America and Europe continue to hold substantial market shares, fueled by strong R&D activities and early adoption of innovative technologies. However, emerging markets in South America and the Middle East and Africa are showing increasing potential and are likely to experience accelerated growth in the coming years. This growth trajectory points toward the smart polymers market becoming a key component of future technological advancements across a broad range of industries. Competition among key players including Nouryon, Merck KGaA, and others is intense, fostering innovation and driving down costs, making smart polymers more accessible across various applications.
Smart Polymers Industry Market Report: 2019-2033
This comprehensive report provides a detailed analysis of the global Smart Polymers market, offering invaluable insights for businesses, investors, and researchers. Covering the period from 2019 to 2033, with a base year of 2025 and a forecast period of 2025-2033, this report meticulously examines market structure, competitive dynamics, key trends, and future growth prospects. The report segments the market by type (Physical Stimuli-responsive, Chemical Stimuli-responsive, pH-responsive, Biological Stimuli-responsive, Enzymes-responsive, Self-healing Polymers, Other Types), end-user industry (Biomedical and Healthcare, Electrical and Electronics, Textile, Automotive, Other End-user Industries), and leading players including Nouryon, Merck KGaA, Autonomic Materials, Evonik Industries AG, Spintech LLC, Huntsman International LLC, DuPont, The Lubrizol Corporation, Covestro AG, SMP Technologies Inc, and TNO. The total market size is projected to reach xx Million by 2033.
Smart Polymers Industry Market Structure & Competitive Dynamics
The global smart polymers market exhibits a moderately concentrated structure, with several major players holding significant market share. The market is characterized by intense competition, driven by innovation in material science and the increasing demand across diverse end-user industries. Market share data for 2024 indicates that the top five players collectively hold approximately 45% of the market, with the remaining share distributed among numerous smaller companies and emerging players. Innovation ecosystems play a crucial role, with companies investing heavily in R&D to develop novel smart polymer applications. Regulatory frameworks, particularly concerning safety and environmental impact, influence market dynamics significantly. Product substitutes, such as traditional polymers and alternative materials, pose a competitive threat, though the unique properties of smart polymers offer a significant advantage in specific applications. End-user trends, including increasing demand for sustainable and high-performance materials, drive market growth.
M&A Activities:
- The acquisition of JeNaCell by Evonik in August 2021 demonstrates the strategic importance of bio-based smart polymers. The deal value was xx Million.
- Nouryon's development of LumaTreat in March 2021 showcases innovation in smart polymer applications for water management. The value of this development is estimated at xx Million.
- Further M&A activity is anticipated in the coming years, driven by the need to expand product portfolios and access new technologies. The total value of M&A deals in the smart polymers industry between 2019 and 2024 is estimated at xx Million.
Smart Polymers Industry Industry Trends & Insights
The global smart polymers market is experiencing robust growth, driven by several factors. The Compound Annual Growth Rate (CAGR) from 2025 to 2033 is projected to be xx%, exceeding the global average polymer market growth. This growth is fueled by increasing demand from diverse sectors, including biomedical, automotive, and electronics. Technological disruptions, such as advancements in nanotechnology and 3D printing, are opening new avenues for smart polymer applications. Consumer preferences towards sustainable and eco-friendly materials are also driving the market. The market penetration rate of smart polymers in various sectors continues to increase, driven by their superior performance characteristics and the growing awareness of their potential benefits. Competitive dynamics remain intense, with companies focusing on innovation, strategic partnerships, and market expansion to maintain a competitive edge.
Dominant Markets & Segments in Smart Polymers Industry
Dominant Regions & Segments:
- North America currently dominates the global smart polymers market, owing to the presence of major players, significant R&D investment, and high demand across various end-use industries. The region’s strong economy and robust infrastructure further contribute to its dominance.
- Europe is another key market, with strong presence of chemical giants and substantial investments in material science research.
- Within segments, Biomedical and Healthcare represent the largest market share, driven by growing demand for advanced medical devices and drug delivery systems. The Electrical and Electronics segment shows significant potential due to the development of smart sensors, actuators, and flexible electronics.
- Self-healing polymers are among the fastest growing segments, with applications extending from infrastructure to consumer goods. The increased focus on sustainability and the need for longer lasting products fuels this expansion.
Key Drivers:
- Favorable economic policies promoting innovation and technological advancement.
- Investments in infrastructure development, creating demand for smart polymers in construction and transportation.
- Government regulations promoting sustainable materials, boosting the adoption of eco-friendly smart polymers.
Smart Polymers Industry Product Innovations
Recent product developments focus on improving the functionality, biocompatibility, and sustainability of smart polymers. Innovations include the integration of nanomaterials to enhance properties like conductivity and strength, and the development of biodegradable smart polymers for environmentally friendly applications. These advancements are tailored to meet specific market needs, leading to a better fit between material properties and application requirements, driving competitive advantage through superior performance and functionality. The trend towards customized smart polymer solutions for specific industry needs is also gaining significant traction.
Report Segmentation & Scope
This report segments the smart polymers market based on several crucial parameters:
By Type: The report covers Physical Stimuli-responsive, Chemical Stimuli-responsive, pH-responsive, Biological Stimuli-responsive, Enzymes-responsive, Self-healing Polymers, and Other Types, providing detailed analysis of market size, growth projections, and competitive dynamics for each segment.
By End-user Industry: The report analyzes the market across Biomedical and Healthcare, Electrical and Electronics, Textile, Automotive, and Other End-user Industries, offering insights into sector-specific application and market potential.
Key Drivers of Smart Polymers Industry Growth
Technological advancements in material science and nanotechnology are key drivers, enabling the development of smart polymers with enhanced properties. Favorable economic conditions, particularly in developing economies, are fueling demand. Government regulations and policies promoting sustainability and innovation also play a crucial role. For instance, increasing focus on reducing environmental impact boosts demand for biodegradable smart polymers.
Challenges in the Smart Polymers Industry Sector
Regulatory hurdles related to safety and environmental concerns pose challenges to market expansion. Supply chain disruptions and fluctuations in raw material prices can impact production costs and profitability. Intense competition from established polymer manufacturers and the emergence of new players can pressure profit margins. These factors can collectively affect the overall growth trajectory of the industry. The cost of developing and commercializing new smart polymer technologies also poses a significant challenge.
Leading Players in the Smart Polymers Industry Market
- Nouryon
- Merck KGaA
- Autonomic Materials
- Evonik Industries AG
- Spintech LLC
- Huntsman International LLC
- DuPont
- The Lubrizol Corporation
- Covestro AG
- SMP Technologies Inc
- TNO
Key Developments in Smart Polymers Industry Sector
- August 2021: Evonik acquired the German biotech company JeNaCell, expanding its biomaterials portfolio.
- March 2021: Nouryon launched LumaTreat, a new smart-tagged polymer line for water management.
Strategic Smart Polymers Industry Market Outlook
The future of the smart polymers market is bright, with significant growth potential driven by technological advancements, increasing demand across diverse sectors, and supportive government policies. Strategic opportunities exist in developing innovative smart polymer applications for sustainable solutions, advanced medical devices, and high-performance electronics. Companies focused on innovation, sustainability, and strategic partnerships will be best positioned to capitalize on the market's growth potential.
Smart Polymers Industry Segmentation
-
1. Type
- 1.1. Physical Stimuli-responsive
- 1.2. Chemical Stimuli-responsive
- 1.3. Biological Stimuli-responsive
- 1.4. Self-healing Polymers
- 1.5. Other Types (Thermally Responsive, Etc.)
-
2. End-user Industry
- 2.1. Biomedical and Healthcare
- 2.2. Electrical and Electronics
- 2.3. Textile
- 2.4. Automotive
- 2.5. Other End-user Industries (Agriculture, Etc.)
Smart Polymers Industry Segmentation By Geography
-
1. Asia Pacific
- 1.1. China
- 1.2. India
- 1.3. Japan
- 1.4. South Korea
- 1.5. Rest of Asia Pacific
-
2. North America
- 2.1. United States
- 2.2. Canada
- 2.3. Mexico
-
3. Europe
- 3.1. Germany
- 3.2. United Kingdom
- 3.3. Italy
- 3.4. France
- 3.5. Rest of Europe
-
4. South America
- 4.1. Brazil
- 4.2. Argentina
- 4.3. Rest of South America
-
5. Middle East and Africa
- 5.1. Saudi Arabia
- 5.2. South Africa
- 5.3. Rest of Middle East and Africa
Smart Polymers Industry REPORT HIGHLIGHTS
| Aspects | Details |
|---|---|
| Study Period | 2019-2033 |
| Base Year | 2024 |
| Estimated Year | 2025 |
| Forecast Period | 2025-2033 |
| Historical Period | 2019-2024 |
| Growth Rate | CAGR of > 15.00% from 2019-2033 |
| Segmentation |
|
Table of Contents
- 1. Introduction
- 1.1. Research Scope
- 1.2. Market Segmentation
- 1.3. Research Methodology
- 1.4. Definitions and Assumptions
- 2. Executive Summary
- 2.1. Introduction
- 3. Market Dynamics
- 3.1. Introduction
- 3.2. Market Drivers
- 3.2.1. Increasing Application of Shape Memory Polymer in Textile Industry; Increasing Need for Efficient Drug Delivery System; Development of Smart Biopolymers
- 3.3. Market Restrains
- 3.3.1. High Cost of Technology and Development of Smart Polymers; Other Restraints
- 3.4. Market Trends
- 3.4.1. Biomedical and Healthcare to Dominate the Market
- 4. Market Factor Analysis
- 4.1. Porters Five Forces
- 4.2. Supply/Value Chain
- 4.3. PESTEL analysis
- 4.4. Market Entropy
- 4.5. Patent/Trademark Analysis
- 5. Global Smart Polymers Industry Analysis, Insights and Forecast, 2019-2031
- 5.1. Market Analysis, Insights and Forecast - by Type
- 5.1.1. Physical Stimuli-responsive
- 5.1.2. Chemical Stimuli-responsive
- 5.1.3. Biological Stimuli-responsive
- 5.1.4. Self-healing Polymers
- 5.1.5. Other Types (Thermally Responsive, Etc.)
- 5.2. Market Analysis, Insights and Forecast - by End-user Industry
- 5.2.1. Biomedical and Healthcare
- 5.2.2. Electrical and Electronics
- 5.2.3. Textile
- 5.2.4. Automotive
- 5.2.5. Other End-user Industries (Agriculture, Etc.)
- 5.3. Market Analysis, Insights and Forecast - by Region
- 5.3.1. Asia Pacific
- 5.3.2. North America
- 5.3.3. Europe
- 5.3.4. South America
- 5.3.5. Middle East and Africa
- 5.1. Market Analysis, Insights and Forecast - by Type
- 6. Asia Pacific Smart Polymers Industry Analysis, Insights and Forecast, 2019-2031
- 6.1. Market Analysis, Insights and Forecast - by Type
- 6.1.1. Physical Stimuli-responsive
- 6.1.2. Chemical Stimuli-responsive
- 6.1.3. Biological Stimuli-responsive
- 6.1.4. Self-healing Polymers
- 6.1.5. Other Types (Thermally Responsive, Etc.)
- 6.2. Market Analysis, Insights and Forecast - by End-user Industry
- 6.2.1. Biomedical and Healthcare
- 6.2.2. Electrical and Electronics
- 6.2.3. Textile
- 6.2.4. Automotive
- 6.2.5. Other End-user Industries (Agriculture, Etc.)
- 6.1. Market Analysis, Insights and Forecast - by Type
- 7. North America Smart Polymers Industry Analysis, Insights and Forecast, 2019-2031
- 7.1. Market Analysis, Insights and Forecast - by Type
- 7.1.1. Physical Stimuli-responsive
- 7.1.2. Chemical Stimuli-responsive
- 7.1.3. Biological Stimuli-responsive
- 7.1.4. Self-healing Polymers
- 7.1.5. Other Types (Thermally Responsive, Etc.)
- 7.2. Market Analysis, Insights and Forecast - by End-user Industry
- 7.2.1. Biomedical and Healthcare
- 7.2.2. Electrical and Electronics
- 7.2.3. Textile
- 7.2.4. Automotive
- 7.2.5. Other End-user Industries (Agriculture, Etc.)
- 7.1. Market Analysis, Insights and Forecast - by Type
- 8. Europe Smart Polymers Industry Analysis, Insights and Forecast, 2019-2031
- 8.1. Market Analysis, Insights and Forecast - by Type
- 8.1.1. Physical Stimuli-responsive
- 8.1.2. Chemical Stimuli-responsive
- 8.1.3. Biological Stimuli-responsive
- 8.1.4. Self-healing Polymers
- 8.1.5. Other Types (Thermally Responsive, Etc.)
- 8.2. Market Analysis, Insights and Forecast - by End-user Industry
- 8.2.1. Biomedical and Healthcare
- 8.2.2. Electrical and Electronics
- 8.2.3. Textile
- 8.2.4. Automotive
- 8.2.5. Other End-user Industries (Agriculture, Etc.)
- 8.1. Market Analysis, Insights and Forecast - by Type
- 9. South America Smart Polymers Industry Analysis, Insights and Forecast, 2019-2031
- 9.1. Market Analysis, Insights and Forecast - by Type
- 9.1.1. Physical Stimuli-responsive
- 9.1.2. Chemical Stimuli-responsive
- 9.1.3. Biological Stimuli-responsive
- 9.1.4. Self-healing Polymers
- 9.1.5. Other Types (Thermally Responsive, Etc.)
- 9.2. Market Analysis, Insights and Forecast - by End-user Industry
- 9.2.1. Biomedical and Healthcare
- 9.2.2. Electrical and Electronics
- 9.2.3. Textile
- 9.2.4. Automotive
- 9.2.5. Other End-user Industries (Agriculture, Etc.)
- 9.1. Market Analysis, Insights and Forecast - by Type
- 10. Middle East and Africa Smart Polymers Industry Analysis, Insights and Forecast, 2019-2031
- 10.1. Market Analysis, Insights and Forecast - by Type
- 10.1.1. Physical Stimuli-responsive
- 10.1.2. Chemical Stimuli-responsive
- 10.1.3. Biological Stimuli-responsive
- 10.1.4. Self-healing Polymers
- 10.1.5. Other Types (Thermally Responsive, Etc.)
- 10.2. Market Analysis, Insights and Forecast - by End-user Industry
- 10.2.1. Biomedical and Healthcare
- 10.2.2. Electrical and Electronics
- 10.2.3. Textile
- 10.2.4. Automotive
- 10.2.5. Other End-user Industries (Agriculture, Etc.)
- 10.1. Market Analysis, Insights and Forecast - by Type
- 11. Asia Pacific Smart Polymers Industry Analysis, Insights and Forecast, 2019-2031
- 11.1. Market Analysis, Insights and Forecast - By Country/Sub-region
- 11.1.1 China
- 11.1.2 India
- 11.1.3 Japan
- 11.1.4 South Korea
- 11.1.5 Rest of Asia Pacific
- 12. North America Smart Polymers Industry Analysis, Insights and Forecast, 2019-2031
- 12.1. Market Analysis, Insights and Forecast - By Country/Sub-region
- 12.1.1 United States
- 12.1.2 Canada
- 12.1.3 Mexico
- 13. Europe Smart Polymers Industry Analysis, Insights and Forecast, 2019-2031
- 13.1. Market Analysis, Insights and Forecast - By Country/Sub-region
- 13.1.1 Germany
- 13.1.2 United Kingdom
- 13.1.3 Italy
- 13.1.4 France
- 13.1.5 Rest of Europe
- 14. South America Smart Polymers Industry Analysis, Insights and Forecast, 2019-2031
- 14.1. Market Analysis, Insights and Forecast - By Country/Sub-region
- 14.1.1 Brazil
- 14.1.2 Argentina
- 14.1.3 Rest of South America
- 15. Middle East and Africa Smart Polymers Industry Analysis, Insights and Forecast, 2019-2031
- 15.1. Market Analysis, Insights and Forecast - By Country/Sub-region
- 15.1.1 Saudi Arabia
- 15.1.2 South Africa
- 15.1.3 Rest of Middle East and Africa
- 16. Competitive Analysis
- 16.1. Global Market Share Analysis 2024
- 16.2. Company Profiles
- 16.2.1 Nouryon
- 16.2.1.1. Overview
- 16.2.1.2. Products
- 16.2.1.3. SWOT Analysis
- 16.2.1.4. Recent Developments
- 16.2.1.5. Financials (Based on Availability)
- 16.2.2 Merck KGaA
- 16.2.2.1. Overview
- 16.2.2.2. Products
- 16.2.2.3. SWOT Analysis
- 16.2.2.4. Recent Developments
- 16.2.2.5. Financials (Based on Availability)
- 16.2.3 Autonomic Materials
- 16.2.3.1. Overview
- 16.2.3.2. Products
- 16.2.3.3. SWOT Analysis
- 16.2.3.4. Recent Developments
- 16.2.3.5. Financials (Based on Availability)
- 16.2.4 Evonik Industries AG
- 16.2.4.1. Overview
- 16.2.4.2. Products
- 16.2.4.3. SWOT Analysis
- 16.2.4.4. Recent Developments
- 16.2.4.5. Financials (Based on Availability)
- 16.2.5 Spintech LLC
- 16.2.5.1. Overview
- 16.2.5.2. Products
- 16.2.5.3. SWOT Analysis
- 16.2.5.4. Recent Developments
- 16.2.5.5. Financials (Based on Availability)
- 16.2.6 Huntsman International LLC
- 16.2.6.1. Overview
- 16.2.6.2. Products
- 16.2.6.3. SWOT Analysis
- 16.2.6.4. Recent Developments
- 16.2.6.5. Financials (Based on Availability)
- 16.2.7 DuPont
- 16.2.7.1. Overview
- 16.2.7.2. Products
- 16.2.7.3. SWOT Analysis
- 16.2.7.4. Recent Developments
- 16.2.7.5. Financials (Based on Availability)
- 16.2.8 The Lubrizol Corporation
- 16.2.8.1. Overview
- 16.2.8.2. Products
- 16.2.8.3. SWOT Analysis
- 16.2.8.4. Recent Developments
- 16.2.8.5. Financials (Based on Availability)
- 16.2.9 Covestro AG
- 16.2.9.1. Overview
- 16.2.9.2. Products
- 16.2.9.3. SWOT Analysis
- 16.2.9.4. Recent Developments
- 16.2.9.5. Financials (Based on Availability)
- 16.2.10 SMP Technologies Inc
- 16.2.10.1. Overview
- 16.2.10.2. Products
- 16.2.10.3. SWOT Analysis
- 16.2.10.4. Recent Developments
- 16.2.10.5. Financials (Based on Availability)
- 16.2.11 TNO
- 16.2.11.1. Overview
- 16.2.11.2. Products
- 16.2.11.3. SWOT Analysis
- 16.2.11.4. Recent Developments
- 16.2.11.5. Financials (Based on Availability)
- 16.2.1 Nouryon
List of Figures
- Figure 1: Global Smart Polymers Industry Revenue Breakdown (Million, %) by Region 2024 & 2032
- Figure 2: Global Smart Polymers Industry Volume Breakdown (K Tons, %) by Region 2024 & 2032
- Figure 3: Asia Pacific Smart Polymers Industry Revenue (Million), by Country 2024 & 2032
- Figure 4: Asia Pacific Smart Polymers Industry Volume (K Tons), by Country 2024 & 2032
- Figure 5: Asia Pacific Smart Polymers Industry Revenue Share (%), by Country 2024 & 2032
- Figure 6: Asia Pacific Smart Polymers Industry Volume Share (%), by Country 2024 & 2032
- Figure 7: North America Smart Polymers Industry Revenue (Million), by Country 2024 & 2032
- Figure 8: North America Smart Polymers Industry Volume (K Tons), by Country 2024 & 2032
- Figure 9: North America Smart Polymers Industry Revenue Share (%), by Country 2024 & 2032
- Figure 10: North America Smart Polymers Industry Volume Share (%), by Country 2024 & 2032
- Figure 11: Europe Smart Polymers Industry Revenue (Million), by Country 2024 & 2032
- Figure 12: Europe Smart Polymers Industry Volume (K Tons), by Country 2024 & 2032
- Figure 13: Europe Smart Polymers Industry Revenue Share (%), by Country 2024 & 2032
- Figure 14: Europe Smart Polymers Industry Volume Share (%), by Country 2024 & 2032
- Figure 15: South America Smart Polymers Industry Revenue (Million), by Country 2024 & 2032
- Figure 16: South America Smart Polymers Industry Volume (K Tons), by Country 2024 & 2032
- Figure 17: South America Smart Polymers Industry Revenue Share (%), by Country 2024 & 2032
- Figure 18: South America Smart Polymers Industry Volume Share (%), by Country 2024 & 2032
- Figure 19: Middle East and Africa Smart Polymers Industry Revenue (Million), by Country 2024 & 2032
- Figure 20: Middle East and Africa Smart Polymers Industry Volume (K Tons), by Country 2024 & 2032
- Figure 21: Middle East and Africa Smart Polymers Industry Revenue Share (%), by Country 2024 & 2032
- Figure 22: Middle East and Africa Smart Polymers Industry Volume Share (%), by Country 2024 & 2032
- Figure 23: Asia Pacific Smart Polymers Industry Revenue (Million), by Type 2024 & 2032
- Figure 24: Asia Pacific Smart Polymers Industry Volume (K Tons), by Type 2024 & 2032
- Figure 25: Asia Pacific Smart Polymers Industry Revenue Share (%), by Type 2024 & 2032
- Figure 26: Asia Pacific Smart Polymers Industry Volume Share (%), by Type 2024 & 2032
- Figure 27: Asia Pacific Smart Polymers Industry Revenue (Million), by End-user Industry 2024 & 2032
- Figure 28: Asia Pacific Smart Polymers Industry Volume (K Tons), by End-user Industry 2024 & 2032
- Figure 29: Asia Pacific Smart Polymers Industry Revenue Share (%), by End-user Industry 2024 & 2032
- Figure 30: Asia Pacific Smart Polymers Industry Volume Share (%), by End-user Industry 2024 & 2032
- Figure 31: Asia Pacific Smart Polymers Industry Revenue (Million), by Country 2024 & 2032
- Figure 32: Asia Pacific Smart Polymers Industry Volume (K Tons), by Country 2024 & 2032
- Figure 33: Asia Pacific Smart Polymers Industry Revenue Share (%), by Country 2024 & 2032
- Figure 34: Asia Pacific Smart Polymers Industry Volume Share (%), by Country 2024 & 2032
- Figure 35: North America Smart Polymers Industry Revenue (Million), by Type 2024 & 2032
- Figure 36: North America Smart Polymers Industry Volume (K Tons), by Type 2024 & 2032
- Figure 37: North America Smart Polymers Industry Revenue Share (%), by Type 2024 & 2032
- Figure 38: North America Smart Polymers Industry Volume Share (%), by Type 2024 & 2032
- Figure 39: North America Smart Polymers Industry Revenue (Million), by End-user Industry 2024 & 2032
- Figure 40: North America Smart Polymers Industry Volume (K Tons), by End-user Industry 2024 & 2032
- Figure 41: North America Smart Polymers Industry Revenue Share (%), by End-user Industry 2024 & 2032
- Figure 42: North America Smart Polymers Industry Volume Share (%), by End-user Industry 2024 & 2032
- Figure 43: North America Smart Polymers Industry Revenue (Million), by Country 2024 & 2032
- Figure 44: North America Smart Polymers Industry Volume (K Tons), by Country 2024 & 2032
- Figure 45: North America Smart Polymers Industry Revenue Share (%), by Country 2024 & 2032
- Figure 46: North America Smart Polymers Industry Volume Share (%), by Country 2024 & 2032
- Figure 47: Europe Smart Polymers Industry Revenue (Million), by Type 2024 & 2032
- Figure 48: Europe Smart Polymers Industry Volume (K Tons), by Type 2024 & 2032
- Figure 49: Europe Smart Polymers Industry Revenue Share (%), by Type 2024 & 2032
- Figure 50: Europe Smart Polymers Industry Volume Share (%), by Type 2024 & 2032
- Figure 51: Europe Smart Polymers Industry Revenue (Million), by End-user Industry 2024 & 2032
- Figure 52: Europe Smart Polymers Industry Volume (K Tons), by End-user Industry 2024 & 2032
- Figure 53: Europe Smart Polymers Industry Revenue Share (%), by End-user Industry 2024 & 2032
- Figure 54: Europe Smart Polymers Industry Volume Share (%), by End-user Industry 2024 & 2032
- Figure 55: Europe Smart Polymers Industry Revenue (Million), by Country 2024 & 2032
- Figure 56: Europe Smart Polymers Industry Volume (K Tons), by Country 2024 & 2032
- Figure 57: Europe Smart Polymers Industry Revenue Share (%), by Country 2024 & 2032
- Figure 58: Europe Smart Polymers Industry Volume Share (%), by Country 2024 & 2032
- Figure 59: South America Smart Polymers Industry Revenue (Million), by Type 2024 & 2032
- Figure 60: South America Smart Polymers Industry Volume (K Tons), by Type 2024 & 2032
- Figure 61: South America Smart Polymers Industry Revenue Share (%), by Type 2024 & 2032
- Figure 62: South America Smart Polymers Industry Volume Share (%), by Type 2024 & 2032
- Figure 63: South America Smart Polymers Industry Revenue (Million), by End-user Industry 2024 & 2032
- Figure 64: South America Smart Polymers Industry Volume (K Tons), by End-user Industry 2024 & 2032
- Figure 65: South America Smart Polymers Industry Revenue Share (%), by End-user Industry 2024 & 2032
- Figure 66: South America Smart Polymers Industry Volume Share (%), by End-user Industry 2024 & 2032
- Figure 67: South America Smart Polymers Industry Revenue (Million), by Country 2024 & 2032
- Figure 68: South America Smart Polymers Industry Volume (K Tons), by Country 2024 & 2032
- Figure 69: South America Smart Polymers Industry Revenue Share (%), by Country 2024 & 2032
- Figure 70: South America Smart Polymers Industry Volume Share (%), by Country 2024 & 2032
- Figure 71: Middle East and Africa Smart Polymers Industry Revenue (Million), by Type 2024 & 2032
- Figure 72: Middle East and Africa Smart Polymers Industry Volume (K Tons), by Type 2024 & 2032
- Figure 73: Middle East and Africa Smart Polymers Industry Revenue Share (%), by Type 2024 & 2032
- Figure 74: Middle East and Africa Smart Polymers Industry Volume Share (%), by Type 2024 & 2032
- Figure 75: Middle East and Africa Smart Polymers Industry Revenue (Million), by End-user Industry 2024 & 2032
- Figure 76: Middle East and Africa Smart Polymers Industry Volume (K Tons), by End-user Industry 2024 & 2032
- Figure 77: Middle East and Africa Smart Polymers Industry Revenue Share (%), by End-user Industry 2024 & 2032
- Figure 78: Middle East and Africa Smart Polymers Industry Volume Share (%), by End-user Industry 2024 & 2032
- Figure 79: Middle East and Africa Smart Polymers Industry Revenue (Million), by Country 2024 & 2032
- Figure 80: Middle East and Africa Smart Polymers Industry Volume (K Tons), by Country 2024 & 2032
- Figure 81: Middle East and Africa Smart Polymers Industry Revenue Share (%), by Country 2024 & 2032
- Figure 82: Middle East and Africa Smart Polymers Industry Volume Share (%), by Country 2024 & 2032
List of Tables
- Table 1: Global Smart Polymers Industry Revenue Million Forecast, by Region 2019 & 2032
- Table 2: Global Smart Polymers Industry Volume K Tons Forecast, by Region 2019 & 2032
- Table 3: Global Smart Polymers Industry Revenue Million Forecast, by Type 2019 & 2032
- Table 4: Global Smart Polymers Industry Volume K Tons Forecast, by Type 2019 & 2032
- Table 5: Global Smart Polymers Industry Revenue Million Forecast, by End-user Industry 2019 & 2032
- Table 6: Global Smart Polymers Industry Volume K Tons Forecast, by End-user Industry 2019 & 2032
- Table 7: Global Smart Polymers Industry Revenue Million Forecast, by Region 2019 & 2032
- Table 8: Global Smart Polymers Industry Volume K Tons Forecast, by Region 2019 & 2032
- Table 9: Global Smart Polymers Industry Revenue Million Forecast, by Country 2019 & 2032
- Table 10: Global Smart Polymers Industry Volume K Tons Forecast, by Country 2019 & 2032
- Table 11: China Smart Polymers Industry Revenue (Million) Forecast, by Application 2019 & 2032
- Table 12: China Smart Polymers Industry Volume (K Tons) Forecast, by Application 2019 & 2032
- Table 13: India Smart Polymers Industry Revenue (Million) Forecast, by Application 2019 & 2032
- Table 14: India Smart Polymers Industry Volume (K Tons) Forecast, by Application 2019 & 2032
- Table 15: Japan Smart Polymers Industry Revenue (Million) Forecast, by Application 2019 & 2032
- Table 16: Japan Smart Polymers Industry Volume (K Tons) Forecast, by Application 2019 & 2032
- Table 17: South Korea Smart Polymers Industry Revenue (Million) Forecast, by Application 2019 & 2032
- Table 18: South Korea Smart Polymers Industry Volume (K Tons) Forecast, by Application 2019 & 2032
- Table 19: Rest of Asia Pacific Smart Polymers Industry Revenue (Million) Forecast, by Application 2019 & 2032
- Table 20: Rest of Asia Pacific Smart Polymers Industry Volume (K Tons) Forecast, by Application 2019 & 2032
- Table 21: Global Smart Polymers Industry Revenue Million Forecast, by Country 2019 & 2032
- Table 22: Global Smart Polymers Industry Volume K Tons Forecast, by Country 2019 & 2032
- Table 23: United States Smart Polymers Industry Revenue (Million) Forecast, by Application 2019 & 2032
- Table 24: United States Smart Polymers Industry Volume (K Tons) Forecast, by Application 2019 & 2032
- Table 25: Canada Smart Polymers Industry Revenue (Million) Forecast, by Application 2019 & 2032
- Table 26: Canada Smart Polymers Industry Volume (K Tons) Forecast, by Application 2019 & 2032
- Table 27: Mexico Smart Polymers Industry Revenue (Million) Forecast, by Application 2019 & 2032
- Table 28: Mexico Smart Polymers Industry Volume (K Tons) Forecast, by Application 2019 & 2032
- Table 29: Global Smart Polymers Industry Revenue Million Forecast, by Country 2019 & 2032
- Table 30: Global Smart Polymers Industry Volume K Tons Forecast, by Country 2019 & 2032
- Table 31: Germany Smart Polymers Industry Revenue (Million) Forecast, by Application 2019 & 2032
- Table 32: Germany Smart Polymers Industry Volume (K Tons) Forecast, by Application 2019 & 2032
- Table 33: United Kingdom Smart Polymers Industry Revenue (Million) Forecast, by Application 2019 & 2032
- Table 34: United Kingdom Smart Polymers Industry Volume (K Tons) Forecast, by Application 2019 & 2032
- Table 35: Italy Smart Polymers Industry Revenue (Million) Forecast, by Application 2019 & 2032
- Table 36: Italy Smart Polymers Industry Volume (K Tons) Forecast, by Application 2019 & 2032
- Table 37: France Smart Polymers Industry Revenue (Million) Forecast, by Application 2019 & 2032
- Table 38: France Smart Polymers Industry Volume (K Tons) Forecast, by Application 2019 & 2032
- Table 39: Rest of Europe Smart Polymers Industry Revenue (Million) Forecast, by Application 2019 & 2032
- Table 40: Rest of Europe Smart Polymers Industry Volume (K Tons) Forecast, by Application 2019 & 2032
- Table 41: Global Smart Polymers Industry Revenue Million Forecast, by Country 2019 & 2032
- Table 42: Global Smart Polymers Industry Volume K Tons Forecast, by Country 2019 & 2032
- Table 43: Brazil Smart Polymers Industry Revenue (Million) Forecast, by Application 2019 & 2032
- Table 44: Brazil Smart Polymers Industry Volume (K Tons) Forecast, by Application 2019 & 2032
- Table 45: Argentina Smart Polymers Industry Revenue (Million) Forecast, by Application 2019 & 2032
- Table 46: Argentina Smart Polymers Industry Volume (K Tons) Forecast, by Application 2019 & 2032
- Table 47: Rest of South America Smart Polymers Industry Revenue (Million) Forecast, by Application 2019 & 2032
- Table 48: Rest of South America Smart Polymers Industry Volume (K Tons) Forecast, by Application 2019 & 2032
- Table 49: Global Smart Polymers Industry Revenue Million Forecast, by Country 2019 & 2032
- Table 50: Global Smart Polymers Industry Volume K Tons Forecast, by Country 2019 & 2032
- Table 51: Saudi Arabia Smart Polymers Industry Revenue (Million) Forecast, by Application 2019 & 2032
- Table 52: Saudi Arabia Smart Polymers Industry Volume (K Tons) Forecast, by Application 2019 & 2032
- Table 53: South Africa Smart Polymers Industry Revenue (Million) Forecast, by Application 2019 & 2032
- Table 54: South Africa Smart Polymers Industry Volume (K Tons) Forecast, by Application 2019 & 2032
- Table 55: Rest of Middle East and Africa Smart Polymers Industry Revenue (Million) Forecast, by Application 2019 & 2032
- Table 56: Rest of Middle East and Africa Smart Polymers Industry Volume (K Tons) Forecast, by Application 2019 & 2032
- Table 57: Global Smart Polymers Industry Revenue Million Forecast, by Type 2019 & 2032
- Table 58: Global Smart Polymers Industry Volume K Tons Forecast, by Type 2019 & 2032
- Table 59: Global Smart Polymers Industry Revenue Million Forecast, by End-user Industry 2019 & 2032
- Table 60: Global Smart Polymers Industry Volume K Tons Forecast, by End-user Industry 2019 & 2032
- Table 61: Global Smart Polymers Industry Revenue Million Forecast, by Country 2019 & 2032
- Table 62: Global Smart Polymers Industry Volume K Tons Forecast, by Country 2019 & 2032
- Table 63: China Smart Polymers Industry Revenue (Million) Forecast, by Application 2019 & 2032
- Table 64: China Smart Polymers Industry Volume (K Tons) Forecast, by Application 2019 & 2032
- Table 65: India Smart Polymers Industry Revenue (Million) Forecast, by Application 2019 & 2032
- Table 66: India Smart Polymers Industry Volume (K Tons) Forecast, by Application 2019 & 2032
- Table 67: Japan Smart Polymers Industry Revenue (Million) Forecast, by Application 2019 & 2032
- Table 68: Japan Smart Polymers Industry Volume (K Tons) Forecast, by Application 2019 & 2032
- Table 69: South Korea Smart Polymers Industry Revenue (Million) Forecast, by Application 2019 & 2032
- Table 70: South Korea Smart Polymers Industry Volume (K Tons) Forecast, by Application 2019 & 2032
- Table 71: Rest of Asia Pacific Smart Polymers Industry Revenue (Million) Forecast, by Application 2019 & 2032
- Table 72: Rest of Asia Pacific Smart Polymers Industry Volume (K Tons) Forecast, by Application 2019 & 2032
- Table 73: Global Smart Polymers Industry Revenue Million Forecast, by Type 2019 & 2032
- Table 74: Global Smart Polymers Industry Volume K Tons Forecast, by Type 2019 & 2032
- Table 75: Global Smart Polymers Industry Revenue Million Forecast, by End-user Industry 2019 & 2032
- Table 76: Global Smart Polymers Industry Volume K Tons Forecast, by End-user Industry 2019 & 2032
- Table 77: Global Smart Polymers Industry Revenue Million Forecast, by Country 2019 & 2032
- Table 78: Global Smart Polymers Industry Volume K Tons Forecast, by Country 2019 & 2032
- Table 79: United States Smart Polymers Industry Revenue (Million) Forecast, by Application 2019 & 2032
- Table 80: United States Smart Polymers Industry Volume (K Tons) Forecast, by Application 2019 & 2032
- Table 81: Canada Smart Polymers Industry Revenue (Million) Forecast, by Application 2019 & 2032
- Table 82: Canada Smart Polymers Industry Volume (K Tons) Forecast, by Application 2019 & 2032
- Table 83: Mexico Smart Polymers Industry Revenue (Million) Forecast, by Application 2019 & 2032
- Table 84: Mexico Smart Polymers Industry Volume (K Tons) Forecast, by Application 2019 & 2032
- Table 85: Global Smart Polymers Industry Revenue Million Forecast, by Type 2019 & 2032
- Table 86: Global Smart Polymers Industry Volume K Tons Forecast, by Type 2019 & 2032
- Table 87: Global Smart Polymers Industry Revenue Million Forecast, by End-user Industry 2019 & 2032
- Table 88: Global Smart Polymers Industry Volume K Tons Forecast, by End-user Industry 2019 & 2032
- Table 89: Global Smart Polymers Industry Revenue Million Forecast, by Country 2019 & 2032
- Table 90: Global Smart Polymers Industry Volume K Tons Forecast, by Country 2019 & 2032
- Table 91: Germany Smart Polymers Industry Revenue (Million) Forecast, by Application 2019 & 2032
- Table 92: Germany Smart Polymers Industry Volume (K Tons) Forecast, by Application 2019 & 2032
- Table 93: United Kingdom Smart Polymers Industry Revenue (Million) Forecast, by Application 2019 & 2032
- Table 94: United Kingdom Smart Polymers Industry Volume (K Tons) Forecast, by Application 2019 & 2032
- Table 95: Italy Smart Polymers Industry Revenue (Million) Forecast, by Application 2019 & 2032
- Table 96: Italy Smart Polymers Industry Volume (K Tons) Forecast, by Application 2019 & 2032
- Table 97: France Smart Polymers Industry Revenue (Million) Forecast, by Application 2019 & 2032
- Table 98: France Smart Polymers Industry Volume (K Tons) Forecast, by Application 2019 & 2032
- Table 99: Rest of Europe Smart Polymers Industry Revenue (Million) Forecast, by Application 2019 & 2032
- Table 100: Rest of Europe Smart Polymers Industry Volume (K Tons) Forecast, by Application 2019 & 2032
- Table 101: Global Smart Polymers Industry Revenue Million Forecast, by Type 2019 & 2032
- Table 102: Global Smart Polymers Industry Volume K Tons Forecast, by Type 2019 & 2032
- Table 103: Global Smart Polymers Industry Revenue Million Forecast, by End-user Industry 2019 & 2032
- Table 104: Global Smart Polymers Industry Volume K Tons Forecast, by End-user Industry 2019 & 2032
- Table 105: Global Smart Polymers Industry Revenue Million Forecast, by Country 2019 & 2032
- Table 106: Global Smart Polymers Industry Volume K Tons Forecast, by Country 2019 & 2032
- Table 107: Brazil Smart Polymers Industry Revenue (Million) Forecast, by Application 2019 & 2032
- Table 108: Brazil Smart Polymers Industry Volume (K Tons) Forecast, by Application 2019 & 2032
- Table 109: Argentina Smart Polymers Industry Revenue (Million) Forecast, by Application 2019 & 2032
- Table 110: Argentina Smart Polymers Industry Volume (K Tons) Forecast, by Application 2019 & 2032
- Table 111: Rest of South America Smart Polymers Industry Revenue (Million) Forecast, by Application 2019 & 2032
- Table 112: Rest of South America Smart Polymers Industry Volume (K Tons) Forecast, by Application 2019 & 2032
- Table 113: Global Smart Polymers Industry Revenue Million Forecast, by Type 2019 & 2032
- Table 114: Global Smart Polymers Industry Volume K Tons Forecast, by Type 2019 & 2032
- Table 115: Global Smart Polymers Industry Revenue Million Forecast, by End-user Industry 2019 & 2032
- Table 116: Global Smart Polymers Industry Volume K Tons Forecast, by End-user Industry 2019 & 2032
- Table 117: Global Smart Polymers Industry Revenue Million Forecast, by Country 2019 & 2032
- Table 118: Global Smart Polymers Industry Volume K Tons Forecast, by Country 2019 & 2032
- Table 119: Saudi Arabia Smart Polymers Industry Revenue (Million) Forecast, by Application 2019 & 2032
- Table 120: Saudi Arabia Smart Polymers Industry Volume (K Tons) Forecast, by Application 2019 & 2032
- Table 121: South Africa Smart Polymers Industry Revenue (Million) Forecast, by Application 2019 & 2032
- Table 122: South Africa Smart Polymers Industry Volume (K Tons) Forecast, by Application 2019 & 2032
- Table 123: Rest of Middle East and Africa Smart Polymers Industry Revenue (Million) Forecast, by Application 2019 & 2032
- Table 124: Rest of Middle East and Africa Smart Polymers Industry Volume (K Tons) Forecast, by Application 2019 & 2032
Frequently Asked Questions
1. What is the projected Compound Annual Growth Rate (CAGR) of the Smart Polymers Industry?
The projected CAGR is approximately > 15.00%.
2. Which companies are prominent players in the Smart Polymers Industry?
Key companies in the market include Nouryon, Merck KGaA, Autonomic Materials, Evonik Industries AG, Spintech LLC, Huntsman International LLC, DuPont, The Lubrizol Corporation, Covestro AG, SMP Technologies Inc, TNO.
3. What are the main segments of the Smart Polymers Industry?
The market segments include Type, End-user Industry.
4. Can you provide details about the market size?
The market size is estimated to be USD XX Million as of 2022.
5. What are some drivers contributing to market growth?
Increasing Application of Shape Memory Polymer in Textile Industry; Increasing Need for Efficient Drug Delivery System; Development of Smart Biopolymers.
6. What are the notable trends driving market growth?
Biomedical and Healthcare to Dominate the Market.
7. Are there any restraints impacting market growth?
High Cost of Technology and Development of Smart Polymers; Other Restraints.
8. Can you provide examples of recent developments in the market?
In August 2021, Evonik aquired the German biotech company JeNaCell. The acquisition adds biotechnologically produced cellulose to Evonik's portfolio of biomaterials.
9. What pricing options are available for accessing the report?
Pricing options include single-user, multi-user, and enterprise licenses priced at USD 4750, USD 5250, and USD 8750 respectively.
10. Is the market size provided in terms of value or volume?
The market size is provided in terms of value, measured in Million and volume, measured in K Tons.
11. Are there any specific market keywords associated with the report?
Yes, the market keyword associated with the report is "Smart Polymers Industry," which aids in identifying and referencing the specific market segment covered.
12. How do I determine which pricing option suits my needs best?
The pricing options vary based on user requirements and access needs. Individual users may opt for single-user licenses, while businesses requiring broader access may choose multi-user or enterprise licenses for cost-effective access to the report.
13. Are there any additional resources or data provided in the Smart Polymers Industry report?
While the report offers comprehensive insights, it's advisable to review the specific contents or supplementary materials provided to ascertain if additional resources or data are available.
14. How can I stay updated on further developments or reports in the Smart Polymers Industry?
To stay informed about further developments, trends, and reports in the Smart Polymers Industry, consider subscribing to industry newsletters, following relevant companies and organizations, or regularly checking reputable industry news sources and publications.
Methodology
Step 1 - Identification of Relevant Samples Size from Population Database


Step 2 - Approaches for Defining Global Market Size (Value, Volume* & Price*)

Note*: In applicable scenarios
Step 3 - Data Sources
Primary Research
- Web Analytics
- Survey Reports
- Research Institute
- Latest Research Reports
- Opinion Leaders
Secondary Research
- Annual Reports
- White Paper
- Latest Press Release
- Industry Association
- Paid Database
- Investor Presentations

Step 4 - Data Triangulation
Involves using different sources of information in order to increase the validity of a study
These sources are likely to be stakeholders in a program - participants, other researchers, program staff, other community members, and so on.
Then we put all data in single framework & apply various statistical tools to find out the dynamic on the market.
During the analysis stage, feedback from the stakeholder groups would be compared to determine areas of agreement as well as areas of divergence


