
Key Insights
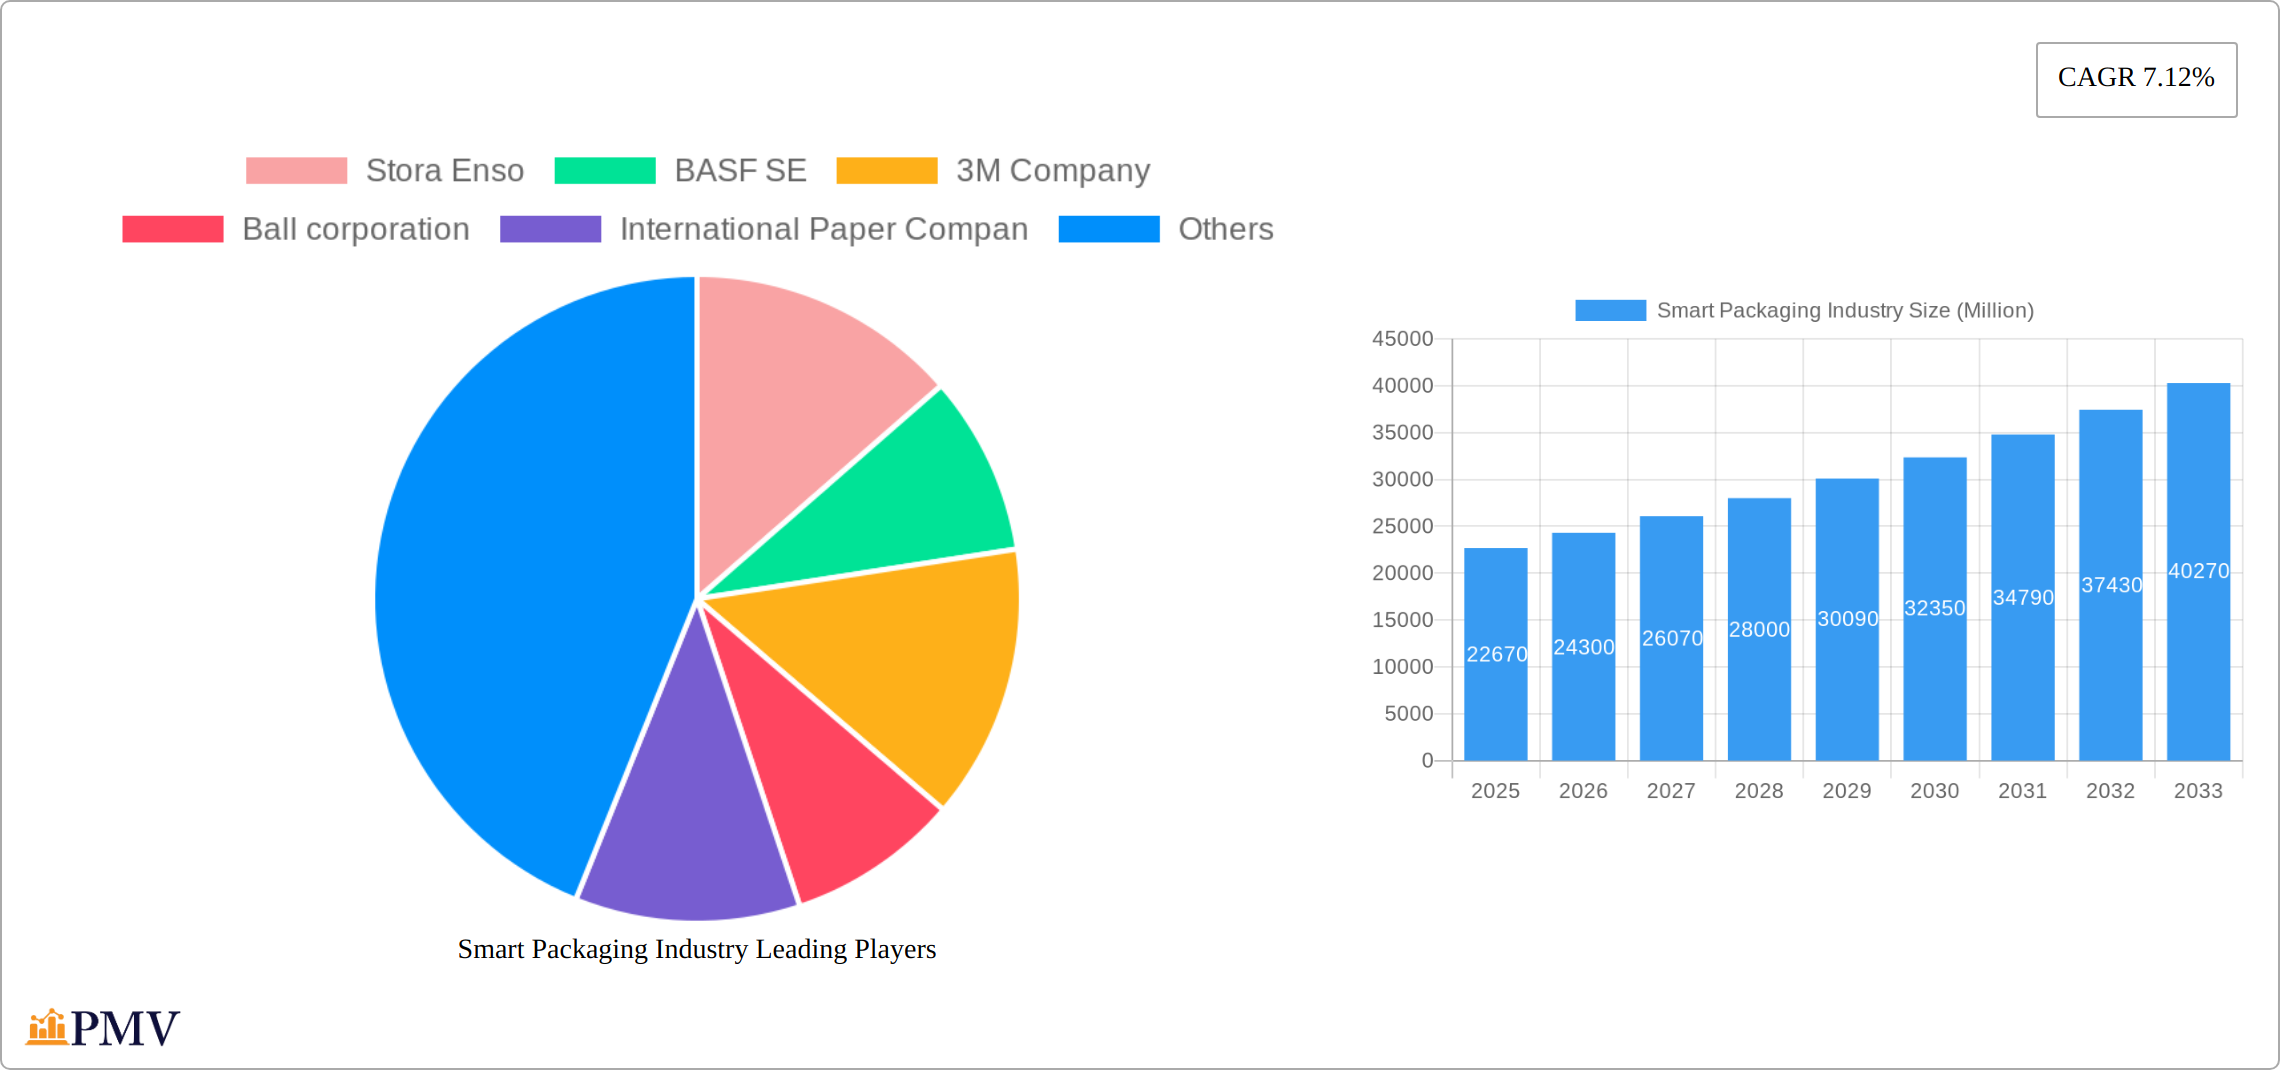
The smart packaging market, valued at $22.67 billion in 2025, is projected to experience robust growth, driven by increasing demand for enhanced product safety, improved supply chain visibility, and the rising adoption of e-commerce. A Compound Annual Growth Rate (CAGR) of 7.12% from 2025 to 2033 indicates a significant expansion in market size over the forecast period. Key drivers include the growing need for tamper-evident packaging to combat counterfeiting, the rising consumer preference for convenient and informative packaging, and technological advancements in RFID, sensor, and connectivity technologies enabling real-time tracking and monitoring of goods. The food and beverage sector is currently the largest end-user vertical, followed by healthcare and personal care. Active packaging, which incorporates functionalities such as oxygen scavenging or moisture control, represents a significant segment within the technology landscape. However, high initial investment costs associated with smart packaging technologies and potential consumer resistance to higher pricing could pose challenges to market growth. Geographical expansion is anticipated, with North America and Europe maintaining significant market shares due to established infrastructure and higher consumer awareness. However, rapidly developing economies in Asia-Pacific are expected to witness substantial growth in the coming years, driven by rising disposable incomes and increasing adoption of innovative packaging solutions.
The competitive landscape is characterized by a mix of established packaging companies and technology providers. Major players include Stora Enso, BASF SE, 3M Company, Ball Corporation, International Paper Company, Amcor PLC, Avery Dennison Corporation, Huhtamaki OYJ, Zebra Technologies Corporation, and Sealed Air Corporation. These companies are focusing on strategic partnerships, mergers and acquisitions, and product innovation to maintain a competitive edge. The market is also witnessing the entry of new players, further intensifying competition. Future growth will depend on ongoing technological advancements, successful integration of smart packaging into existing supply chains, and the development of sustainable and eco-friendly packaging solutions to meet growing environmental concerns. The focus on traceability and consumer engagement will be critical in shaping the future trajectory of the smart packaging market.
Smart Packaging Industry Market Report: 2019-2033
This comprehensive report provides an in-depth analysis of the global smart packaging market, offering invaluable insights for businesses, investors, and stakeholders seeking to understand and capitalize on this rapidly evolving industry. With a study period spanning 2019-2033, a base year of 2025, and a forecast period of 2025-2033, this report delivers a detailed overview of market dynamics, key players, and future trends, encompassing a market valued at over XX Million.
Smart Packaging Industry Market Structure & Competitive Dynamics
The global smart packaging market exhibits a moderately consolidated structure, with several large multinational corporations holding significant market share. The market is characterized by intense competition, driven by continuous innovation and a focus on developing sustainable and technologically advanced packaging solutions. Key players such as Stora Enso, BASF SE, 3M Company, Ball Corporation, International Paper Company, Amcor PLC, Avery Dennison Corporation, Huhtamaki OYJ, Zebra Technologies Corporation, and Sealed Air Corporation are actively engaged in strategic initiatives such as mergers and acquisitions (M&A) to expand their market presence and product portfolios.
- Market Concentration: The top five players account for approximately XX% of the global market share (2024).
- Innovation Ecosystems: Significant investments in R&D are driving innovation in areas like active and intelligent packaging technologies.
- Regulatory Frameworks: Government regulations promoting sustainability and food safety are shaping market trends.
- Product Substitutes: The threat from substitute materials remains relatively low due to the unique functionalities of smart packaging.
- End-User Trends: The increasing demand for convenience, traceability, and product safety is boosting market growth.
- M&A Activities: Over the past five years, the total value of M&A deals in the smart packaging sector has exceeded XX Million, reflecting strategic consolidation and expansion efforts. Examples include [Insert specific examples of M&A deals with deal values if available, otherwise use "XX Million" as a placeholder for unknown values].
Smart Packaging Industry Industry Trends & Insights
The global smart packaging market is experiencing robust growth, driven by several key factors. Market projections indicate a Compound Annual Growth Rate (CAGR) of XX% during the forecast period (2025-2033), significantly outpacing traditional packaging. This surge is fueled by a confluence of factors: the increasing consumer demand for convenience, detailed product information, enhanced traceability, and sustainability initiatives. Technological advancements, particularly in RFID, sensors, near-field communication (NFC), and advanced printing technologies (e.g., digital printing, thermochromic inks), are propelling market expansion. The rise of e-commerce and the imperative for efficient, transparent supply chain management are further contributing to this growth. Smart packaging solutions are gaining significant traction across diverse end-user verticals, with strong adoption in the food and beverage, healthcare, pharmaceutical, and personal care industries. The competitive landscape is dynamic, characterized by continuous product innovation, strategic partnerships, mergers and acquisitions, and evolving pricing strategies.
Dominant Markets & Segments in Smart Packaging Industry
North America currently holds a leading position in the global smart packaging market, driven by high consumer disposable incomes, robust technological infrastructure, a skilled workforce, and stringent regulatory frameworks emphasizing food safety and traceability. Within the technology segments, intelligent packaging commands a larger market share than active packaging due to its versatility and extensive integration capabilities with other technologies. The food and beverage segment remains the largest end-user vertical, primarily due to the escalating demand for enhanced food safety, extended shelf life, and reduced food waste. This is followed closely by the healthcare and pharmaceutical sectors where counterfeiting prevention and patient safety are paramount.
Key Drivers for North American Dominance:
- Strong economic growth and high consumer spending power.
- Advanced technological infrastructure and a readily available skilled workforce specializing in packaging technologies.
- Stringent food safety and quality regulations driving adoption of advanced solutions.
- Early adoption of new technologies and a willingness to invest in innovative packaging solutions.
Dominant Segments:
- By Technology: Intelligent packaging leads due to the increasing demand for real-time product information, supply chain visibility, and consumer engagement features.
- By End-user Vertical: Food and beverage, followed by healthcare and pharmaceuticals, dominate due to stringent regulatory requirements and high consumer demand for safety and traceability.
Smart Packaging Industry Product Innovations
Recent product innovations in smart packaging showcase the seamless integration of advanced technologies, such as Internet of Things (IoT) sensors, RFID and NFC tags, augmented reality (AR) features, and blockchain technology. These innovations enable real-time tracking, tamper evidence, and enhanced consumer engagement, significantly improving supply chain efficiency and product authenticity. Time-temperature indicators (TTIs) ensure product quality and shelf-life, while smart labels provide detailed product information and instructions via QR codes and NFC tags. Furthermore, advancements in materials science are leading to the development of sustainable and biodegradable smart packaging solutions, addressing growing environmental concerns. Competition thrives on continuous feature development and enhanced functionalities tailored to the specific requirements of various industries.
Report Segmentation & Scope
This report segments the smart packaging market by technology (active and intelligent packaging, including sub-segments like time-temperature indicators, RFID, and NFC) and end-user vertical (food and beverage, healthcare, pharmaceuticals, personal care, and other emerging sectors). Each segment undergoes detailed analysis, providing insights into market size, growth projections, and competitive dynamics. Market size estimations account for the value of smart packaging solutions across diverse applications. Growth projections are based on a robust forecasting methodology considering technological advancements, shifting consumer preferences, evolving regulatory landscapes, and macroeconomic factors. Competitive analysis profiles key players, examines their strategies, and assesses their market positioning within each segment. Both active and intelligent packaging segments are projected to witness substantial growth throughout the forecast period, with intelligent packaging demonstrating a slightly higher CAGR due to its superior functionalities.
Key Drivers of Smart Packaging Industry Growth
Several factors drive the growth of the smart packaging industry. Technological advancements such as the development of sophisticated sensors, improved RFID technology, and advancements in printing technology allow for more functional and informative packaging. Increasing consumer demand for convenience, product information, and sustainability promotes the adoption of smart packaging solutions. Stringent government regulations related to food safety and traceability incentivize the adoption of smart packaging systems in the food and beverage sector. The e-commerce boom necessitates efficient supply chain management, further boosting the demand for smart packaging.
Challenges in the Smart Packaging Industry Sector
The smart packaging industry faces several significant challenges, including the high initial investment costs associated with adopting advanced technologies and the need for specialized infrastructure. Supply chain complexities and potential disruptions, particularly regarding raw material sourcing and manufacturing, can impact the production and timely delivery of smart packaging solutions. Data security and consumer privacy concerns related to data collection and transmission through smart packaging necessitate rigorous attention. Effective management of these concerns is vital to building consumer trust and fostering widespread adoption. Finally, intense competition among established players and new entrants, along with the need for skilled workforce, adds to the complexity of the market landscape. The cumulative impact of these challenges is estimated to moderate the CAGR by approximately XX% compared to a scenario without these obstacles.
Leading Players in the Smart Packaging Industry Market
- Stora Enso
- BASF SE
- 3M Company
- Ball Corporation
- International Paper Company
- Amcor PLC
- Avery Dennison Corporation
- Huhtamaki OYJ
- Zebra Technologies Corporation
- Sealed Air Corporation
Key Developments in Smart Packaging Industry Sector
January 2023: Avery Dennison announced a major investment exceeding USD 100 Million to expand its RFID manufacturing capacity in Mexico, aiming to become the world's largest RFID provider and improve supply chain transparency. This significantly impacts market dynamics by enhancing the availability and affordability of RFID technology.
March 2023: Amcor partnered with NfiniteNanotechnology Inc. to research nanocoating technology for recyclable and compostable packaging. This development contributes to the growing focus on sustainable and eco-friendly smart packaging solutions, influencing consumer choices and market demand.
Strategic Smart Packaging Industry Market Outlook
The future of the smart packaging industry is promising, with significant growth opportunities anticipated across various segments. Continued innovation in sensor technologies, advanced materials, and digital printing will drive further market expansion. The increasing emphasis on sustainability and circular economy principles will shape the demand for eco-friendly smart packaging solutions. Strategic partnerships and collaborations among companies across the value chain will be crucial for driving innovation and accelerating market adoption. Focus on data analytics and improving supply chain efficiency through smart packaging will further enhance market growth. The market is poised for considerable expansion, driven by increasing consumer demand and technological advancements.
Smart Packaging Industry Segmentation
-
1. Technology
- 1.1. Active Packaging
- 1.2. Intelligent Packaging
-
2. End-user Vertical
- 2.1. Food
- 2.2. Beverage
- 2.3. Healthcare
- 2.4. Personal Care
- 2.5. Other End-user Verticals
Smart Packaging Industry Segmentation By Geography
-
1. North America
- 1.1. United States
- 1.2. Canada
-
2. Europe
- 2.1. Germany
- 2.2. United Kingdom
- 2.3. France
- 2.4. Rest of Europe
-
3. Asia Pacific
- 3.1. China
- 3.2. Japan
- 3.3. India
- 3.4. Rest of Asia Pacific
- 4. Latin America
- 5. Middle East and Africa

Smart Packaging Industry REPORT HIGHLIGHTS
| Aspects | Details |
|---|---|
| Study Period | 2019-2033 |
| Base Year | 2024 |
| Estimated Year | 2025 |
| Forecast Period | 2025-2033 |
| Historical Period | 2019-2024 |
| Growth Rate | CAGR of 7.12% from 2019-2033 |
| Segmentation |
|
Table of Contents
- 1. Introduction
- 1.1. Research Scope
- 1.2. Market Segmentation
- 1.3. Research Methodology
- 1.4. Definitions and Assumptions
- 2. Executive Summary
- 2.1. Introduction
- 3. Market Dynamics
- 3.1. Introduction
- 3.2. Market Drivers
- 3.2.1. Advancement in Technology in Food Packaging for Quality Inspection; Rising Awareness Regarding Food Safety; Development in the Printing Industry Due to Various Applications of Smart Packaging
- 3.3. Market Restrains
- 3.3.1. High Costs Due to Initial Requirement
- 3.4. Market Trends
- 3.4.1. Active Packaging to Hold Major Share in the Market
- 4. Market Factor Analysis
- 4.1. Porters Five Forces
- 4.2. Supply/Value Chain
- 4.3. PESTEL analysis
- 4.4. Market Entropy
- 4.5. Patent/Trademark Analysis
- 5. Global Smart Packaging Industry Analysis, Insights and Forecast, 2019-2031
- 5.1. Market Analysis, Insights and Forecast - by Technology
- 5.1.1. Active Packaging
- 5.1.2. Intelligent Packaging
- 5.2. Market Analysis, Insights and Forecast - by End-user Vertical
- 5.2.1. Food
- 5.2.2. Beverage
- 5.2.3. Healthcare
- 5.2.4. Personal Care
- 5.2.5. Other End-user Verticals
- 5.3. Market Analysis, Insights and Forecast - by Region
- 5.3.1. North America
- 5.3.2. Europe
- 5.3.3. Asia Pacific
- 5.3.4. Latin America
- 5.3.5. Middle East and Africa
- 5.1. Market Analysis, Insights and Forecast - by Technology
- 6. North America Smart Packaging Industry Analysis, Insights and Forecast, 2019-2031
- 6.1. Market Analysis, Insights and Forecast - by Technology
- 6.1.1. Active Packaging
- 6.1.2. Intelligent Packaging
- 6.2. Market Analysis, Insights and Forecast - by End-user Vertical
- 6.2.1. Food
- 6.2.2. Beverage
- 6.2.3. Healthcare
- 6.2.4. Personal Care
- 6.2.5. Other End-user Verticals
- 6.1. Market Analysis, Insights and Forecast - by Technology
- 7. Europe Smart Packaging Industry Analysis, Insights and Forecast, 2019-2031
- 7.1. Market Analysis, Insights and Forecast - by Technology
- 7.1.1. Active Packaging
- 7.1.2. Intelligent Packaging
- 7.2. Market Analysis, Insights and Forecast - by End-user Vertical
- 7.2.1. Food
- 7.2.2. Beverage
- 7.2.3. Healthcare
- 7.2.4. Personal Care
- 7.2.5. Other End-user Verticals
- 7.1. Market Analysis, Insights and Forecast - by Technology
- 8. Asia Pacific Smart Packaging Industry Analysis, Insights and Forecast, 2019-2031
- 8.1. Market Analysis, Insights and Forecast - by Technology
- 8.1.1. Active Packaging
- 8.1.2. Intelligent Packaging
- 8.2. Market Analysis, Insights and Forecast - by End-user Vertical
- 8.2.1. Food
- 8.2.2. Beverage
- 8.2.3. Healthcare
- 8.2.4. Personal Care
- 8.2.5. Other End-user Verticals
- 8.1. Market Analysis, Insights and Forecast - by Technology
- 9. Latin America Smart Packaging Industry Analysis, Insights and Forecast, 2019-2031
- 9.1. Market Analysis, Insights and Forecast - by Technology
- 9.1.1. Active Packaging
- 9.1.2. Intelligent Packaging
- 9.2. Market Analysis, Insights and Forecast - by End-user Vertical
- 9.2.1. Food
- 9.2.2. Beverage
- 9.2.3. Healthcare
- 9.2.4. Personal Care
- 9.2.5. Other End-user Verticals
- 9.1. Market Analysis, Insights and Forecast - by Technology
- 10. Middle East and Africa Smart Packaging Industry Analysis, Insights and Forecast, 2019-2031
- 10.1. Market Analysis, Insights and Forecast - by Technology
- 10.1.1. Active Packaging
- 10.1.2. Intelligent Packaging
- 10.2. Market Analysis, Insights and Forecast - by End-user Vertical
- 10.2.1. Food
- 10.2.2. Beverage
- 10.2.3. Healthcare
- 10.2.4. Personal Care
- 10.2.5. Other End-user Verticals
- 10.1. Market Analysis, Insights and Forecast - by Technology
- 11. North America Smart Packaging Industry Analysis, Insights and Forecast, 2019-2031
- 11.1. Market Analysis, Insights and Forecast - By Country/Sub-region
- 11.1.1 United States
- 11.1.2 Canada
- 11.1.3 Mexico
- 12. Europe Smart Packaging Industry Analysis, Insights and Forecast, 2019-2031
- 12.1. Market Analysis, Insights and Forecast - By Country/Sub-region
- 12.1.1 Germany
- 12.1.2 United Kingdom
- 12.1.3 France
- 12.1.4 Spain
- 12.1.5 Italy
- 12.1.6 Spain
- 12.1.7 Belgium
- 12.1.8 Netherland
- 12.1.9 Nordics
- 12.1.10 Rest of Europe
- 13. Asia Pacific Smart Packaging Industry Analysis, Insights and Forecast, 2019-2031
- 13.1. Market Analysis, Insights and Forecast - By Country/Sub-region
- 13.1.1 China
- 13.1.2 Japan
- 13.1.3 India
- 13.1.4 South Korea
- 13.1.5 Southeast Asia
- 13.1.6 Australia
- 13.1.7 Indonesia
- 13.1.8 Phillipes
- 13.1.9 Singapore
- 13.1.10 Thailandc
- 13.1.11 Rest of Asia Pacific
- 14. South America Smart Packaging Industry Analysis, Insights and Forecast, 2019-2031
- 14.1. Market Analysis, Insights and Forecast - By Country/Sub-region
- 14.1.1 Brazil
- 14.1.2 Argentina
- 14.1.3 Peru
- 14.1.4 Chile
- 14.1.5 Colombia
- 14.1.6 Ecuador
- 14.1.7 Venezuela
- 14.1.8 Rest of South America
- 15. North America Smart Packaging Industry Analysis, Insights and Forecast, 2019-2031
- 15.1. Market Analysis, Insights and Forecast - By Country/Sub-region
- 15.1.1 United States
- 15.1.2 Canada
- 15.1.3 Mexico
- 16. MEA Smart Packaging Industry Analysis, Insights and Forecast, 2019-2031
- 16.1. Market Analysis, Insights and Forecast - By Country/Sub-region
- 16.1.1 United Arab Emirates
- 16.1.2 Saudi Arabia
- 16.1.3 South Africa
- 16.1.4 Rest of Middle East and Africa
- 17. Competitive Analysis
- 17.1. Global Market Share Analysis 2024
- 17.2. Company Profiles
- 17.2.1 Stora Enso
- 17.2.1.1. Overview
- 17.2.1.2. Products
- 17.2.1.3. SWOT Analysis
- 17.2.1.4. Recent Developments
- 17.2.1.5. Financials (Based on Availability)
- 17.2.2 BASF SE
- 17.2.2.1. Overview
- 17.2.2.2. Products
- 17.2.2.3. SWOT Analysis
- 17.2.2.4. Recent Developments
- 17.2.2.5. Financials (Based on Availability)
- 17.2.3 3M Company
- 17.2.3.1. Overview
- 17.2.3.2. Products
- 17.2.3.3. SWOT Analysis
- 17.2.3.4. Recent Developments
- 17.2.3.5. Financials (Based on Availability)
- 17.2.4 Ball corporation
- 17.2.4.1. Overview
- 17.2.4.2. Products
- 17.2.4.3. SWOT Analysis
- 17.2.4.4. Recent Developments
- 17.2.4.5. Financials (Based on Availability)
- 17.2.5 International Paper Compan
- 17.2.5.1. Overview
- 17.2.5.2. Products
- 17.2.5.3. SWOT Analysis
- 17.2.5.4. Recent Developments
- 17.2.5.5. Financials (Based on Availability)
- 17.2.6 Amcor PLC
- 17.2.6.1. Overview
- 17.2.6.2. Products
- 17.2.6.3. SWOT Analysis
- 17.2.6.4. Recent Developments
- 17.2.6.5. Financials (Based on Availability)
- 17.2.7 Avery Dennison Corporation
- 17.2.7.1. Overview
- 17.2.7.2. Products
- 17.2.7.3. SWOT Analysis
- 17.2.7.4. Recent Developments
- 17.2.7.5. Financials (Based on Availability)
- 17.2.8 Huhtamaki OYJ
- 17.2.8.1. Overview
- 17.2.8.2. Products
- 17.2.8.3. SWOT Analysis
- 17.2.8.4. Recent Developments
- 17.2.8.5. Financials (Based on Availability)
- 17.2.9 Zebra Technologies Corporation
- 17.2.9.1. Overview
- 17.2.9.2. Products
- 17.2.9.3. SWOT Analysis
- 17.2.9.4. Recent Developments
- 17.2.9.5. Financials (Based on Availability)
- 17.2.10 Sealed Air Corporation
- 17.2.10.1. Overview
- 17.2.10.2. Products
- 17.2.10.3. SWOT Analysis
- 17.2.10.4. Recent Developments
- 17.2.10.5. Financials (Based on Availability)
- 17.2.1 Stora Enso
List of Figures
- Figure 1: Global Smart Packaging Industry Revenue Breakdown (Million, %) by Region 2024 & 2032
- Figure 2: North America Smart Packaging Industry Revenue (Million), by Country 2024 & 2032
- Figure 3: North America Smart Packaging Industry Revenue Share (%), by Country 2024 & 2032
- Figure 4: Europe Smart Packaging Industry Revenue (Million), by Country 2024 & 2032
- Figure 5: Europe Smart Packaging Industry Revenue Share (%), by Country 2024 & 2032
- Figure 6: Asia Pacific Smart Packaging Industry Revenue (Million), by Country 2024 & 2032
- Figure 7: Asia Pacific Smart Packaging Industry Revenue Share (%), by Country 2024 & 2032
- Figure 8: South America Smart Packaging Industry Revenue (Million), by Country 2024 & 2032
- Figure 9: South America Smart Packaging Industry Revenue Share (%), by Country 2024 & 2032
- Figure 10: North America Smart Packaging Industry Revenue (Million), by Country 2024 & 2032
- Figure 11: North America Smart Packaging Industry Revenue Share (%), by Country 2024 & 2032
- Figure 12: MEA Smart Packaging Industry Revenue (Million), by Country 2024 & 2032
- Figure 13: MEA Smart Packaging Industry Revenue Share (%), by Country 2024 & 2032
- Figure 14: North America Smart Packaging Industry Revenue (Million), by Technology 2024 & 2032
- Figure 15: North America Smart Packaging Industry Revenue Share (%), by Technology 2024 & 2032
- Figure 16: North America Smart Packaging Industry Revenue (Million), by End-user Vertical 2024 & 2032
- Figure 17: North America Smart Packaging Industry Revenue Share (%), by End-user Vertical 2024 & 2032
- Figure 18: North America Smart Packaging Industry Revenue (Million), by Country 2024 & 2032
- Figure 19: North America Smart Packaging Industry Revenue Share (%), by Country 2024 & 2032
- Figure 20: Europe Smart Packaging Industry Revenue (Million), by Technology 2024 & 2032
- Figure 21: Europe Smart Packaging Industry Revenue Share (%), by Technology 2024 & 2032
- Figure 22: Europe Smart Packaging Industry Revenue (Million), by End-user Vertical 2024 & 2032
- Figure 23: Europe Smart Packaging Industry Revenue Share (%), by End-user Vertical 2024 & 2032
- Figure 24: Europe Smart Packaging Industry Revenue (Million), by Country 2024 & 2032
- Figure 25: Europe Smart Packaging Industry Revenue Share (%), by Country 2024 & 2032
- Figure 26: Asia Pacific Smart Packaging Industry Revenue (Million), by Technology 2024 & 2032
- Figure 27: Asia Pacific Smart Packaging Industry Revenue Share (%), by Technology 2024 & 2032
- Figure 28: Asia Pacific Smart Packaging Industry Revenue (Million), by End-user Vertical 2024 & 2032
- Figure 29: Asia Pacific Smart Packaging Industry Revenue Share (%), by End-user Vertical 2024 & 2032
- Figure 30: Asia Pacific Smart Packaging Industry Revenue (Million), by Country 2024 & 2032
- Figure 31: Asia Pacific Smart Packaging Industry Revenue Share (%), by Country 2024 & 2032
- Figure 32: Latin America Smart Packaging Industry Revenue (Million), by Technology 2024 & 2032
- Figure 33: Latin America Smart Packaging Industry Revenue Share (%), by Technology 2024 & 2032
- Figure 34: Latin America Smart Packaging Industry Revenue (Million), by End-user Vertical 2024 & 2032
- Figure 35: Latin America Smart Packaging Industry Revenue Share (%), by End-user Vertical 2024 & 2032
- Figure 36: Latin America Smart Packaging Industry Revenue (Million), by Country 2024 & 2032
- Figure 37: Latin America Smart Packaging Industry Revenue Share (%), by Country 2024 & 2032
- Figure 38: Middle East and Africa Smart Packaging Industry Revenue (Million), by Technology 2024 & 2032
- Figure 39: Middle East and Africa Smart Packaging Industry Revenue Share (%), by Technology 2024 & 2032
- Figure 40: Middle East and Africa Smart Packaging Industry Revenue (Million), by End-user Vertical 2024 & 2032
- Figure 41: Middle East and Africa Smart Packaging Industry Revenue Share (%), by End-user Vertical 2024 & 2032
- Figure 42: Middle East and Africa Smart Packaging Industry Revenue (Million), by Country 2024 & 2032
- Figure 43: Middle East and Africa Smart Packaging Industry Revenue Share (%), by Country 2024 & 2032
List of Tables
- Table 1: Global Smart Packaging Industry Revenue Million Forecast, by Region 2019 & 2032
- Table 2: Global Smart Packaging Industry Revenue Million Forecast, by Technology 2019 & 2032
- Table 3: Global Smart Packaging Industry Revenue Million Forecast, by End-user Vertical 2019 & 2032
- Table 4: Global Smart Packaging Industry Revenue Million Forecast, by Region 2019 & 2032
- Table 5: Global Smart Packaging Industry Revenue Million Forecast, by Country 2019 & 2032
- Table 6: United States Smart Packaging Industry Revenue (Million) Forecast, by Application 2019 & 2032
- Table 7: Canada Smart Packaging Industry Revenue (Million) Forecast, by Application 2019 & 2032
- Table 8: Mexico Smart Packaging Industry Revenue (Million) Forecast, by Application 2019 & 2032
- Table 9: Global Smart Packaging Industry Revenue Million Forecast, by Country 2019 & 2032
- Table 10: Germany Smart Packaging Industry Revenue (Million) Forecast, by Application 2019 & 2032
- Table 11: United Kingdom Smart Packaging Industry Revenue (Million) Forecast, by Application 2019 & 2032
- Table 12: France Smart Packaging Industry Revenue (Million) Forecast, by Application 2019 & 2032
- Table 13: Spain Smart Packaging Industry Revenue (Million) Forecast, by Application 2019 & 2032
- Table 14: Italy Smart Packaging Industry Revenue (Million) Forecast, by Application 2019 & 2032
- Table 15: Spain Smart Packaging Industry Revenue (Million) Forecast, by Application 2019 & 2032
- Table 16: Belgium Smart Packaging Industry Revenue (Million) Forecast, by Application 2019 & 2032
- Table 17: Netherland Smart Packaging Industry Revenue (Million) Forecast, by Application 2019 & 2032
- Table 18: Nordics Smart Packaging Industry Revenue (Million) Forecast, by Application 2019 & 2032
- Table 19: Rest of Europe Smart Packaging Industry Revenue (Million) Forecast, by Application 2019 & 2032
- Table 20: Global Smart Packaging Industry Revenue Million Forecast, by Country 2019 & 2032
- Table 21: China Smart Packaging Industry Revenue (Million) Forecast, by Application 2019 & 2032
- Table 22: Japan Smart Packaging Industry Revenue (Million) Forecast, by Application 2019 & 2032
- Table 23: India Smart Packaging Industry Revenue (Million) Forecast, by Application 2019 & 2032
- Table 24: South Korea Smart Packaging Industry Revenue (Million) Forecast, by Application 2019 & 2032
- Table 25: Southeast Asia Smart Packaging Industry Revenue (Million) Forecast, by Application 2019 & 2032
- Table 26: Australia Smart Packaging Industry Revenue (Million) Forecast, by Application 2019 & 2032
- Table 27: Indonesia Smart Packaging Industry Revenue (Million) Forecast, by Application 2019 & 2032
- Table 28: Phillipes Smart Packaging Industry Revenue (Million) Forecast, by Application 2019 & 2032
- Table 29: Singapore Smart Packaging Industry Revenue (Million) Forecast, by Application 2019 & 2032
- Table 30: Thailandc Smart Packaging Industry Revenue (Million) Forecast, by Application 2019 & 2032
- Table 31: Rest of Asia Pacific Smart Packaging Industry Revenue (Million) Forecast, by Application 2019 & 2032
- Table 32: Global Smart Packaging Industry Revenue Million Forecast, by Country 2019 & 2032
- Table 33: Brazil Smart Packaging Industry Revenue (Million) Forecast, by Application 2019 & 2032
- Table 34: Argentina Smart Packaging Industry Revenue (Million) Forecast, by Application 2019 & 2032
- Table 35: Peru Smart Packaging Industry Revenue (Million) Forecast, by Application 2019 & 2032
- Table 36: Chile Smart Packaging Industry Revenue (Million) Forecast, by Application 2019 & 2032
- Table 37: Colombia Smart Packaging Industry Revenue (Million) Forecast, by Application 2019 & 2032
- Table 38: Ecuador Smart Packaging Industry Revenue (Million) Forecast, by Application 2019 & 2032
- Table 39: Venezuela Smart Packaging Industry Revenue (Million) Forecast, by Application 2019 & 2032
- Table 40: Rest of South America Smart Packaging Industry Revenue (Million) Forecast, by Application 2019 & 2032
- Table 41: Global Smart Packaging Industry Revenue Million Forecast, by Country 2019 & 2032
- Table 42: United States Smart Packaging Industry Revenue (Million) Forecast, by Application 2019 & 2032
- Table 43: Canada Smart Packaging Industry Revenue (Million) Forecast, by Application 2019 & 2032
- Table 44: Mexico Smart Packaging Industry Revenue (Million) Forecast, by Application 2019 & 2032
- Table 45: Global Smart Packaging Industry Revenue Million Forecast, by Country 2019 & 2032
- Table 46: United Arab Emirates Smart Packaging Industry Revenue (Million) Forecast, by Application 2019 & 2032
- Table 47: Saudi Arabia Smart Packaging Industry Revenue (Million) Forecast, by Application 2019 & 2032
- Table 48: South Africa Smart Packaging Industry Revenue (Million) Forecast, by Application 2019 & 2032
- Table 49: Rest of Middle East and Africa Smart Packaging Industry Revenue (Million) Forecast, by Application 2019 & 2032
- Table 50: Global Smart Packaging Industry Revenue Million Forecast, by Technology 2019 & 2032
- Table 51: Global Smart Packaging Industry Revenue Million Forecast, by End-user Vertical 2019 & 2032
- Table 52: Global Smart Packaging Industry Revenue Million Forecast, by Country 2019 & 2032
- Table 53: United States Smart Packaging Industry Revenue (Million) Forecast, by Application 2019 & 2032
- Table 54: Canada Smart Packaging Industry Revenue (Million) Forecast, by Application 2019 & 2032
- Table 55: Global Smart Packaging Industry Revenue Million Forecast, by Technology 2019 & 2032
- Table 56: Global Smart Packaging Industry Revenue Million Forecast, by End-user Vertical 2019 & 2032
- Table 57: Global Smart Packaging Industry Revenue Million Forecast, by Country 2019 & 2032
- Table 58: Germany Smart Packaging Industry Revenue (Million) Forecast, by Application 2019 & 2032
- Table 59: United Kingdom Smart Packaging Industry Revenue (Million) Forecast, by Application 2019 & 2032
- Table 60: France Smart Packaging Industry Revenue (Million) Forecast, by Application 2019 & 2032
- Table 61: Rest of Europe Smart Packaging Industry Revenue (Million) Forecast, by Application 2019 & 2032
- Table 62: Global Smart Packaging Industry Revenue Million Forecast, by Technology 2019 & 2032
- Table 63: Global Smart Packaging Industry Revenue Million Forecast, by End-user Vertical 2019 & 2032
- Table 64: Global Smart Packaging Industry Revenue Million Forecast, by Country 2019 & 2032
- Table 65: China Smart Packaging Industry Revenue (Million) Forecast, by Application 2019 & 2032
- Table 66: Japan Smart Packaging Industry Revenue (Million) Forecast, by Application 2019 & 2032
- Table 67: India Smart Packaging Industry Revenue (Million) Forecast, by Application 2019 & 2032
- Table 68: Rest of Asia Pacific Smart Packaging Industry Revenue (Million) Forecast, by Application 2019 & 2032
- Table 69: Global Smart Packaging Industry Revenue Million Forecast, by Technology 2019 & 2032
- Table 70: Global Smart Packaging Industry Revenue Million Forecast, by End-user Vertical 2019 & 2032
- Table 71: Global Smart Packaging Industry Revenue Million Forecast, by Country 2019 & 2032
- Table 72: Global Smart Packaging Industry Revenue Million Forecast, by Technology 2019 & 2032
- Table 73: Global Smart Packaging Industry Revenue Million Forecast, by End-user Vertical 2019 & 2032
- Table 74: Global Smart Packaging Industry Revenue Million Forecast, by Country 2019 & 2032
Frequently Asked Questions
1. What is the projected Compound Annual Growth Rate (CAGR) of the Smart Packaging Industry?
The projected CAGR is approximately 7.12%.
2. Which companies are prominent players in the Smart Packaging Industry?
Key companies in the market include Stora Enso, BASF SE, 3M Company, Ball corporation, International Paper Compan, Amcor PLC, Avery Dennison Corporation, Huhtamaki OYJ, Zebra Technologies Corporation, Sealed Air Corporation.
3. What are the main segments of the Smart Packaging Industry?
The market segments include Technology, End-user Vertical.
4. Can you provide details about the market size?
The market size is estimated to be USD 22.67 Million as of 2022.
5. What are some drivers contributing to market growth?
Advancement in Technology in Food Packaging for Quality Inspection; Rising Awareness Regarding Food Safety; Development in the Printing Industry Due to Various Applications of Smart Packaging.
6. What are the notable trends driving market growth?
Active Packaging to Hold Major Share in the Market.
7. Are there any restraints impacting market growth?
High Costs Due to Initial Requirement.
8. Can you provide examples of recent developments in the market?
March 2023: Amcor, a company that creates and manufactures environment-friendly packaging solutions, announced a joint research project agreement with NfiniteNanotechnology Inc. to validate the application of Nfinite's nanocoating technology to improve packaging that can be recycled and composted.
9. What pricing options are available for accessing the report?
Pricing options include single-user, multi-user, and enterprise licenses priced at USD 4750, USD 5250, and USD 8750 respectively.
10. Is the market size provided in terms of value or volume?
The market size is provided in terms of value, measured in Million.
11. Are there any specific market keywords associated with the report?
Yes, the market keyword associated with the report is "Smart Packaging Industry," which aids in identifying and referencing the specific market segment covered.
12. How do I determine which pricing option suits my needs best?
The pricing options vary based on user requirements and access needs. Individual users may opt for single-user licenses, while businesses requiring broader access may choose multi-user or enterprise licenses for cost-effective access to the report.
13. Are there any additional resources or data provided in the Smart Packaging Industry report?
While the report offers comprehensive insights, it's advisable to review the specific contents or supplementary materials provided to ascertain if additional resources or data are available.
14. How can I stay updated on further developments or reports in the Smart Packaging Industry?
To stay informed about further developments, trends, and reports in the Smart Packaging Industry, consider subscribing to industry newsletters, following relevant companies and organizations, or regularly checking reputable industry news sources and publications.
Methodology
Step 1 - Identification of Relevant Samples Size from Population Database


Step 2 - Approaches for Defining Global Market Size (Value, Volume* & Price*)

Note*: In applicable scenarios
Step 3 - Data Sources
Primary Research
- Web Analytics
- Survey Reports
- Research Institute
- Latest Research Reports
- Opinion Leaders
Secondary Research
- Annual Reports
- White Paper
- Latest Press Release
- Industry Association
- Paid Database
- Investor Presentations

Step 4 - Data Triangulation
Involves using different sources of information in order to increase the validity of a study
These sources are likely to be stakeholders in a program - participants, other researchers, program staff, other community members, and so on.
Then we put all data in single framework & apply various statistical tools to find out the dynamic on the market.
During the analysis stage, feedback from the stakeholder groups would be compared to determine areas of agreement as well as areas of divergence


