

Key Insights
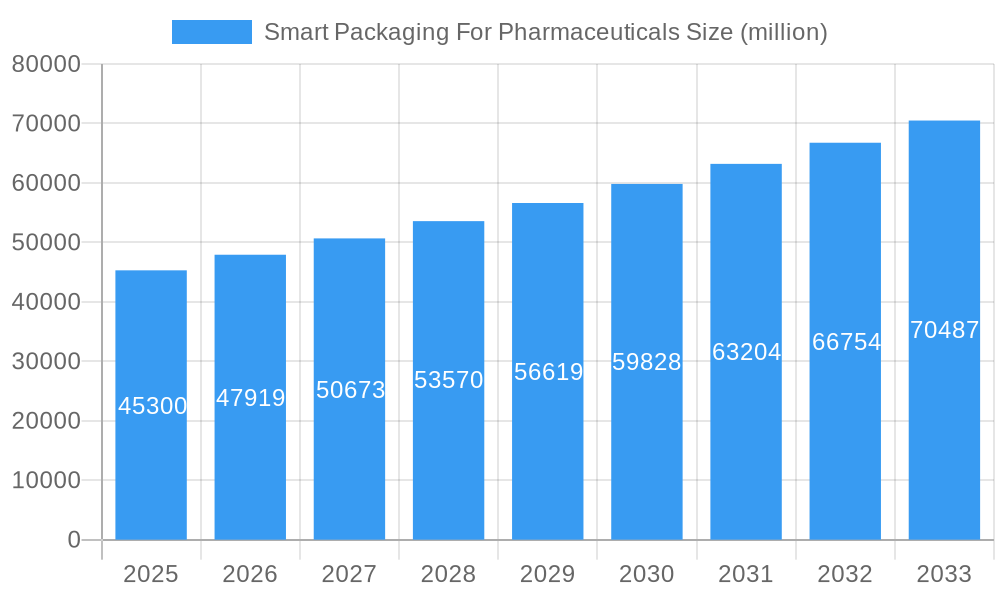
The Smart Packaging for Pharmaceuticals market is poised for significant growth, projected to reach a substantial $45300 million by 2025, with an impressive Compound Annual Growth Rate (CAGR) of 5.9% through 2033. This expansion is primarily fueled by the increasing demand for enhanced drug safety, counterfeit prevention, and improved patient adherence to medication regimens. The integration of advanced technologies like sensors, indicators, and data carriers within pharmaceutical packaging is revolutionizing supply chain management, providing real-time monitoring of temperature, humidity, and location. This not only ensures product integrity but also offers greater transparency and traceability throughout the pharmaceutical lifecycle, directly addressing critical industry concerns. Furthermore, the growing regulatory landscape emphasizing patient safety and drug authenticity is acting as a powerful catalyst for the adoption of smart packaging solutions.
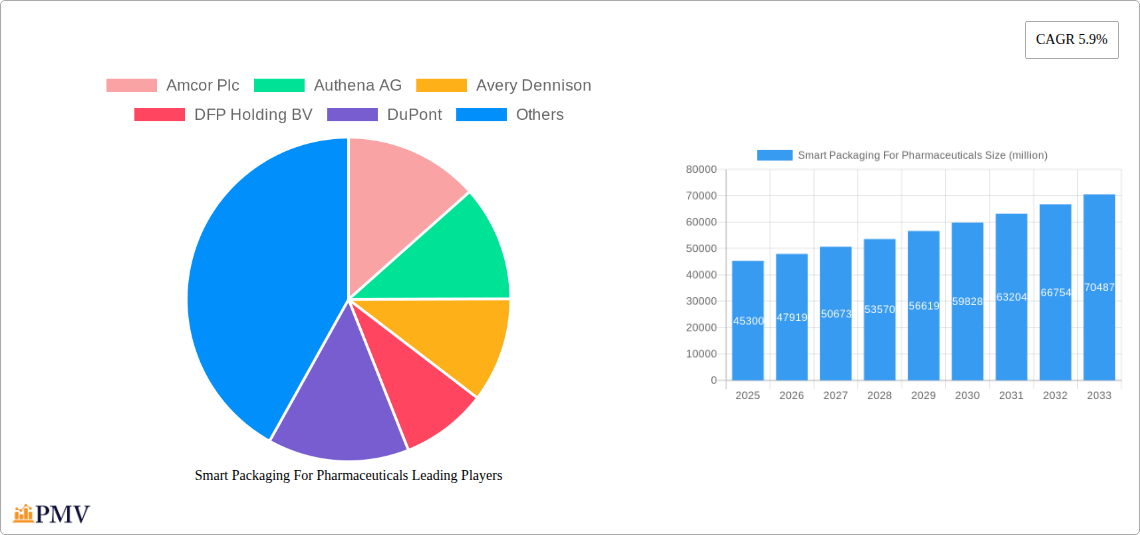
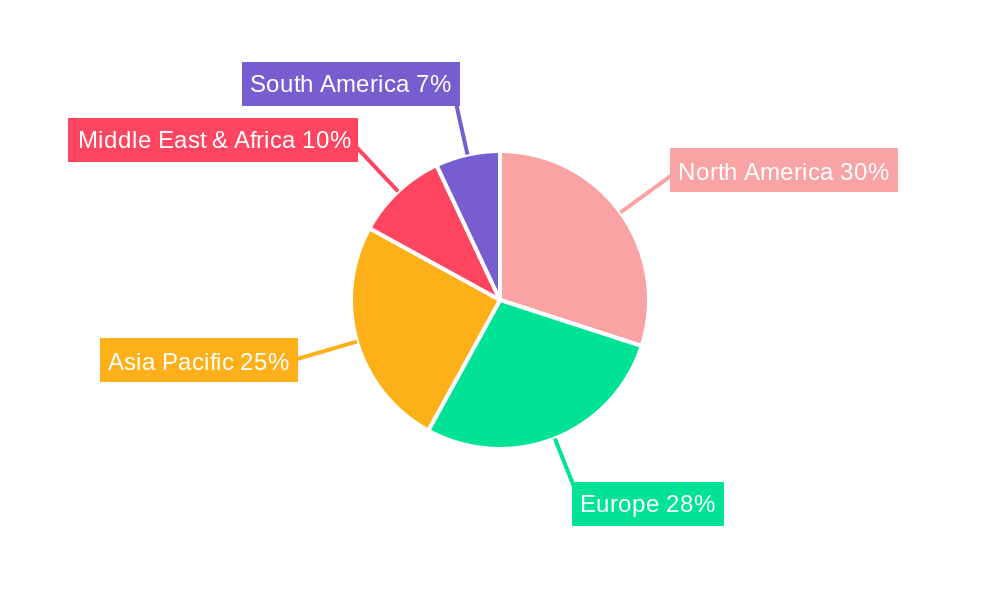
Smart Packaging For Pharmaceuticals Market Size (In Billion)
The market is segmented across various applications, with hospitals and clinics representing the largest share due to their direct involvement in drug administration and patient care. The "Others" segment, encompassing pharmacies, distributors, and home-care settings, is also experiencing robust growth. In terms of technology, Sensors Technology is leading the charge, followed by Indicators Technology and Data Carriers Technology, each contributing to the comprehensive functionality of smart pharmaceutical packaging. Key industry players like Amcor Plc, Authena AG, Avery Dennison, and DuPont are actively investing in research and development to innovate and offer sophisticated smart packaging solutions, further driving market expansion. Geographically, North America and Europe are currently dominant markets, driven by advanced healthcare infrastructure and stringent regulatory frameworks. However, the Asia Pacific region, particularly China and India, is expected to witness the fastest growth owing to a burgeoning pharmaceutical industry and increasing adoption of advanced technologies.
Smart Packaging For Pharmaceuticals Company Market Share
This comprehensive report delves into the dynamic smart packaging for pharmaceuticals market, providing in-depth analysis and actionable insights for industry stakeholders. Covering the historical period from 2019 to 2024 and projecting growth through 2033, with a base year of 2025, this study examines the evolving landscape driven by technological advancements, stringent regulatory demands, and the imperative for enhanced patient safety and supply chain integrity. The market encompasses innovative solutions across sensors technology, indicators technology, and data carriers technology, catering to diverse applications in hospitals, clinics, and other healthcare settings.
Smart Packaging For Pharmaceuticals Market Structure & Competitive Dynamics
The smart packaging for pharmaceuticals market exhibits a moderately concentrated structure, with a blend of established global players and emerging innovators vying for market share. Key companies such as Amcor Plc, Authena AG, Avery Dennison, DuPont, BASF SE, and West Pharmaceutical Services are actively investing in research and development, fostering robust innovation ecosystems. Regulatory frameworks, including those from the FDA and EMA, play a crucial role in shaping market entry and product development, emphasizing serialization, track-and-trace capabilities, and temperature monitoring. Product substitutes, such as traditional packaging with enhanced security features, pose a competitive challenge, yet the unique advantages of smart solutions—real-time data, tamper-evidence, and authentication—are increasingly favored. End-user trends point towards a growing demand for enhanced drug traceability, counterfeiting prevention, and improved cold chain management. Merger and acquisition (M&A) activities are prevalent as larger entities seek to expand their technological portfolios and market reach; for example, recent M&A deals in the broader pharmaceutical packaging sector have exceeded one hundred million dollars, indicating significant investment appetite. The market share distribution is dynamic, with leading players holding substantial portions due to their technological prowess and established distribution networks.
Smart Packaging For Pharmaceuticals Industry Trends & Insights
The smart packaging for pharmaceuticals industry is experiencing robust growth, projected to witness a Compound Annual Growth Rate (CAGR) of approximately fifteen percent over the forecast period. This expansion is primarily fueled by several interconnected trends. A significant market growth driver is the escalating global burden of counterfeit drugs, estimated to cost the pharmaceutical industry over five hundred million dollars annually, necessitating advanced anti-counterfeiting measures like serialized codes and authentication features. Technological disruptions, including the integration of IoT sensors for real-time temperature and humidity monitoring, RFID tags for enhanced traceability, and NFC technology for patient engagement, are transforming conventional packaging into intelligent systems. Consumer preferences are shifting towards safer, more transparent pharmaceutical supply chains, with patients and healthcare providers demanding greater assurance of product integrity and authenticity. Competitive dynamics are intensifying as companies invest heavily in R&D to develop differentiated smart packaging solutions. Market penetration is steadily increasing, particularly in developed regions, as healthcare systems recognize the long-term economic and patient safety benefits of smart packaging. The proactive adoption of technologies like blockchain for secure data management is also emerging as a key trend, enhancing supply chain visibility and reducing the risk of diversion and theft, which can result in losses of two hundred million dollars annually. Furthermore, the increasing focus on personalized medicine requires specialized packaging solutions that can maintain the integrity and efficacy of sensitive biologics and gene therapies, contributing to market expansion. The global smart packaging market is estimated to be valued at over two billion dollars, with the pharmaceutical segment representing a significant and rapidly growing portion of this valuation.
Dominant Markets & Segments in Smart Packaging For Pharmaceuticals
The smart packaging for pharmaceuticals market demonstrates significant dominance in North America and Europe, driven by stringent regulatory mandates for drug traceability and a high concentration of pharmaceutical manufacturing and research. Within these regions, the Hospital application segment is a leading contributor, accounting for an estimated fifty percent of market revenue. This dominance is propelled by the critical need for secure drug dispensing, inventory management, and the prevention of medication errors in high-volume healthcare environments. Economic policies supporting healthcare innovation and robust infrastructure for advanced logistics further bolster this segment's growth.
- Key Drivers for Hospital Segment Dominance:
- Mandatory serialization and track-and-trace regulations (e.g., DSCSA in the US).
- Increased focus on patient safety and reduction of adverse drug events, costing hospitals millions annually.
- Demand for real-time temperature monitoring for sensitive pharmaceuticals and vaccines.
- Integration with hospital information systems (HIS) for enhanced inventory control.
In terms of technology, Sensors Technology leads the market, capturing an estimated forty percent of market share. This is attributed to the indispensable role of sensors in monitoring critical environmental factors such as temperature, humidity, and shock, crucial for maintaining the efficacy of pharmaceuticals throughout their lifecycle. The development of advanced, miniaturized, and cost-effective sensors has been a significant catalyst.
- Key Drivers for Sensors Technology Dominance:
- Growing cold chain logistics requirements for biologics and vaccines.
- Advancements in battery-free and energy-harvesting sensor technologies.
- Increasing adoption of IoT-enabled smart sensors for proactive risk management.
- Regulatory pressure to ensure product integrity and prevent spoilage, which can lead to losses of one hundred million dollars per year.
The Clinic segment, while smaller than the hospital segment, is exhibiting rapid growth, driven by the expanding network of outpatient facilities and specialized clinics. The Others application segment, encompassing pharmacies and direct-to-patient delivery services, is also gaining traction as pharmaceutical companies explore innovative distribution models.
Smart Packaging For Pharmaceuticals Product Innovations
Recent product innovations in smart packaging for pharmaceuticals focus on enhancing tamper-evidence, providing verifiable authentication, and enabling continuous environmental monitoring. Companies are developing integrated sensor solutions that can detect temperature excursions or physical tampering and communicate this information wirelessly. Advancements in NFC and QR code technology embedded directly into packaging facilitate easy scanning for traceability and consumer information access. These innovations offer a competitive advantage by improving drug safety, reducing counterfeiting risks, and enhancing supply chain transparency, which is critical in a market where the economic impact of counterfeit drugs is in the hundreds of millions of dollars.
Report Segmentation & Scope
This report segments the smart packaging for pharmaceuticals market based on key Application and Type categories. The Application segments include Hospital, Clinic, and Others, each analyzed for their unique market dynamics, growth projections, and competitive landscapes. For instance, the Hospital segment is projected to grow at a CAGR of approximately sixteen percent, driven by the need for advanced drug management systems. The Type segments encompass Sensors Technology, Indicators Technology, and Data Carriers Technology. Sensors Technology is expected to dominate, with a projected market size of over five hundred million dollars by 2033, due to its critical role in maintaining product integrity.
Key Drivers of Smart Packaging For Pharmaceuticals Growth
The smart packaging for pharmaceuticals growth is significantly driven by several key factors. Technological advancements in areas like IoT, AI, and advanced materials are enabling more sophisticated and cost-effective smart packaging solutions. Regulatory mandates for serialization, track-and-trace, and cold chain integrity are compelling pharmaceutical companies to adopt these technologies. Increasing incidences of pharmaceutical counterfeiting and diversion, costing the industry billions annually, are creating a strong demand for authentication and security features. Furthermore, a growing emphasis on patient safety and adherence is driving the adoption of smart packaging that can provide real-time information and engagement.
Challenges in the Smart Packaging For Pharmaceuticals Sector
Despite its promising growth, the smart packaging for pharmaceuticals sector faces several challenges. High implementation costs for advanced smart packaging solutions can be a barrier, especially for smaller pharmaceutical companies and in price-sensitive markets. Regulatory complexities and varying standards across different regions can hinder widespread adoption. Integration issues with existing legacy IT systems and supply chain infrastructure present operational hurdles. Additionally, data security and privacy concerns related to the vast amounts of data generated by smart packaging require robust safeguarding measures.
Leading Players in the Smart Packaging For Pharmaceuticals Market
- Amcor Plc
- Authena AG
- Avery Dennison
- DFP Holding BV
- DuPont
- BASF SE
- Korber Medipak Systems
- Ball Corporation
- Graphic Packaging
- Sealed Air Corporation
- CCL Industries
- LOG Pharma Packaging
- Origin Pharma Packaging
- ProAmpac Intermediate
- West Pharmaceutical Services
Key Developments in Smart Packaging For Pharmaceuticals Sector
- 2023/07: Amcor Plc launched a new line of temperature-sensitive smart labels for pharmaceutical cold chain monitoring, significantly enhancing product integrity.
- 2023/05: Authena AG secured significant funding to expand its blockchain-based pharmaceutical authentication platform, addressing counterfeiting concerns.
- 2023/01: Avery Dennison introduced advanced RFID-enabled labels with enhanced durability for pharmaceutical supply chain tracking.
- 2022/11: DuPont announced a partnership to develop bio-based smart packaging materials for a more sustainable pharmaceutical supply chain.
- 2022/08: West Pharmaceutical Services acquired a company specializing in connected drug delivery devices, integrating smart capabilities into packaging.
Strategic Smart Packaging For Pharmaceuticals Market Outlook
The strategic outlook for the smart packaging for pharmaceuticals market is exceptionally positive, driven by continued innovation and increasing adoption. The market is poised for accelerated growth, fueled by the ongoing demand for enhanced supply chain security, counterfeit prevention, and improved patient outcomes. Key growth accelerators include the development of more affordable and integrated smart packaging solutions, the expanding application of IoT and AI for predictive analytics within the supply chain, and the growing trend of personalized medicine requiring specialized, intelligent packaging. Strategic opportunities lie in forging partnerships between packaging manufacturers, pharmaceutical companies, and technology providers to co-create solutions that address specific industry challenges and unlock new market potential, estimated to reach over five billion dollars by 2033.
Smart Packaging For Pharmaceuticals Segmentation
-
1. Application
- 1.1. Hospital
- 1.2. Clinic
- 1.3. Others
-
2. Type
- 2.1. Sensors Technology
- 2.2. Indicators Technology
- 2.3. Data Carriers Technology
Smart Packaging For Pharmaceuticals Segmentation By Geography
-
1. North America
- 1.1. United States
- 1.2. Canada
- 1.3. Mexico
-
2. South America
- 2.1. Brazil
- 2.2. Argentina
- 2.3. Rest of South America
-
3. Europe
- 3.1. United Kingdom
- 3.2. Germany
- 3.3. France
- 3.4. Italy
- 3.5. Spain
- 3.6. Russia
- 3.7. Benelux
- 3.8. Nordics
- 3.9. Rest of Europe
-
4. Middle East & Africa
- 4.1. Turkey
- 4.2. Israel
- 4.3. GCC
- 4.4. North Africa
- 4.5. South Africa
- 4.6. Rest of Middle East & Africa
-
5. Asia Pacific
- 5.1. China
- 5.2. India
- 5.3. Japan
- 5.4. South Korea
- 5.5. ASEAN
- 5.6. Oceania
- 5.7. Rest of Asia Pacific
Smart Packaging For Pharmaceuticals Regional Market Share
Geographic Coverage of Smart Packaging For Pharmaceuticals
Smart Packaging For Pharmaceuticals REPORT HIGHLIGHTS
| Aspects | Details |
|---|---|
| Study Period | 2020-2034 |
| Base Year | 2025 |
| Estimated Year | 2026 |
| Forecast Period | 2026-2034 |
| Historical Period | 2020-2025 |
| Growth Rate | CAGR of 5.9% from 2020-2034 |
| Segmentation |
|
Table of Contents
- 1. Introduction
- 1.1. Research Scope
- 1.2. Market Segmentation
- 1.3. Research Methodology
- 1.4. Definitions and Assumptions
- 2. Executive Summary
- 2.1. Introduction
- 3. Market Dynamics
- 3.1. Introduction
- 3.2. Market Drivers
- 3.3. Market Restrains
- 3.4. Market Trends
- 4. Market Factor Analysis
- 4.1. Porters Five Forces
- 4.2. Supply/Value Chain
- 4.3. PESTEL analysis
- 4.4. Market Entropy
- 4.5. Patent/Trademark Analysis
- 5. Global Smart Packaging For Pharmaceuticals Analysis, Insights and Forecast, 2020-2032
- 5.1. Market Analysis, Insights and Forecast - by Application
- 5.1.1. Hospital
- 5.1.2. Clinic
- 5.1.3. Others
- 5.2. Market Analysis, Insights and Forecast - by Type
- 5.2.1. Sensors Technology
- 5.2.2. Indicators Technology
- 5.2.3. Data Carriers Technology
- 5.3. Market Analysis, Insights and Forecast - by Region
- 5.3.1. North America
- 5.3.2. South America
- 5.3.3. Europe
- 5.3.4. Middle East & Africa
- 5.3.5. Asia Pacific
- 5.1. Market Analysis, Insights and Forecast - by Application
- 6. North America Smart Packaging For Pharmaceuticals Analysis, Insights and Forecast, 2020-2032
- 6.1. Market Analysis, Insights and Forecast - by Application
- 6.1.1. Hospital
- 6.1.2. Clinic
- 6.1.3. Others
- 6.2. Market Analysis, Insights and Forecast - by Type
- 6.2.1. Sensors Technology
- 6.2.2. Indicators Technology
- 6.2.3. Data Carriers Technology
- 6.1. Market Analysis, Insights and Forecast - by Application
- 7. South America Smart Packaging For Pharmaceuticals Analysis, Insights and Forecast, 2020-2032
- 7.1. Market Analysis, Insights and Forecast - by Application
- 7.1.1. Hospital
- 7.1.2. Clinic
- 7.1.3. Others
- 7.2. Market Analysis, Insights and Forecast - by Type
- 7.2.1. Sensors Technology
- 7.2.2. Indicators Technology
- 7.2.3. Data Carriers Technology
- 7.1. Market Analysis, Insights and Forecast - by Application
- 8. Europe Smart Packaging For Pharmaceuticals Analysis, Insights and Forecast, 2020-2032
- 8.1. Market Analysis, Insights and Forecast - by Application
- 8.1.1. Hospital
- 8.1.2. Clinic
- 8.1.3. Others
- 8.2. Market Analysis, Insights and Forecast - by Type
- 8.2.1. Sensors Technology
- 8.2.2. Indicators Technology
- 8.2.3. Data Carriers Technology
- 8.1. Market Analysis, Insights and Forecast - by Application
- 9. Middle East & Africa Smart Packaging For Pharmaceuticals Analysis, Insights and Forecast, 2020-2032
- 9.1. Market Analysis, Insights and Forecast - by Application
- 9.1.1. Hospital
- 9.1.2. Clinic
- 9.1.3. Others
- 9.2. Market Analysis, Insights and Forecast - by Type
- 9.2.1. Sensors Technology
- 9.2.2. Indicators Technology
- 9.2.3. Data Carriers Technology
- 9.1. Market Analysis, Insights and Forecast - by Application
- 10. Asia Pacific Smart Packaging For Pharmaceuticals Analysis, Insights and Forecast, 2020-2032
- 10.1. Market Analysis, Insights and Forecast - by Application
- 10.1.1. Hospital
- 10.1.2. Clinic
- 10.1.3. Others
- 10.2. Market Analysis, Insights and Forecast - by Type
- 10.2.1. Sensors Technology
- 10.2.2. Indicators Technology
- 10.2.3. Data Carriers Technology
- 10.1. Market Analysis, Insights and Forecast - by Application
- 11. Competitive Analysis
- 11.1. Global Market Share Analysis 2025
- 11.2. Company Profiles
- 11.2.1 Amcor Plc
- 11.2.1.1. Overview
- 11.2.1.2. Products
- 11.2.1.3. SWOT Analysis
- 11.2.1.4. Recent Developments
- 11.2.1.5. Financials (Based on Availability)
- 11.2.2 Authena AG
- 11.2.2.1. Overview
- 11.2.2.2. Products
- 11.2.2.3. SWOT Analysis
- 11.2.2.4. Recent Developments
- 11.2.2.5. Financials (Based on Availability)
- 11.2.3 Avery Dennison
- 11.2.3.1. Overview
- 11.2.3.2. Products
- 11.2.3.3. SWOT Analysis
- 11.2.3.4. Recent Developments
- 11.2.3.5. Financials (Based on Availability)
- 11.2.4 DFP Holding BV
- 11.2.4.1. Overview
- 11.2.4.2. Products
- 11.2.4.3. SWOT Analysis
- 11.2.4.4. Recent Developments
- 11.2.4.5. Financials (Based on Availability)
- 11.2.5 DuPont
- 11.2.5.1. Overview
- 11.2.5.2. Products
- 11.2.5.3. SWOT Analysis
- 11.2.5.4. Recent Developments
- 11.2.5.5. Financials (Based on Availability)
- 11.2.6 BASF SE
- 11.2.6.1. Overview
- 11.2.6.2. Products
- 11.2.6.3. SWOT Analysis
- 11.2.6.4. Recent Developments
- 11.2.6.5. Financials (Based on Availability)
- 11.2.7 Korber Medipak Systems
- 11.2.7.1. Overview
- 11.2.7.2. Products
- 11.2.7.3. SWOT Analysis
- 11.2.7.4. Recent Developments
- 11.2.7.5. Financials (Based on Availability)
- 11.2.8 Ball Corporation
- 11.2.8.1. Overview
- 11.2.8.2. Products
- 11.2.8.3. SWOT Analysis
- 11.2.8.4. Recent Developments
- 11.2.8.5. Financials (Based on Availability)
- 11.2.9 Graphic Packaging
- 11.2.9.1. Overview
- 11.2.9.2. Products
- 11.2.9.3. SWOT Analysis
- 11.2.9.4. Recent Developments
- 11.2.9.5. Financials (Based on Availability)
- 11.2.10 Sealed Air Corporation
- 11.2.10.1. Overview
- 11.2.10.2. Products
- 11.2.10.3. SWOT Analysis
- 11.2.10.4. Recent Developments
- 11.2.10.5. Financials (Based on Availability)
- 11.2.11 CCL Industries
- 11.2.11.1. Overview
- 11.2.11.2. Products
- 11.2.11.3. SWOT Analysis
- 11.2.11.4. Recent Developments
- 11.2.11.5. Financials (Based on Availability)
- 11.2.12 LOG Pharma Packaging
- 11.2.12.1. Overview
- 11.2.12.2. Products
- 11.2.12.3. SWOT Analysis
- 11.2.12.4. Recent Developments
- 11.2.12.5. Financials (Based on Availability)
- 11.2.13 Origin Pharma Packaging
- 11.2.13.1. Overview
- 11.2.13.2. Products
- 11.2.13.3. SWOT Analysis
- 11.2.13.4. Recent Developments
- 11.2.13.5. Financials (Based on Availability)
- 11.2.14 ProAmpac Intermediate
- 11.2.14.1. Overview
- 11.2.14.2. Products
- 11.2.14.3. SWOT Analysis
- 11.2.14.4. Recent Developments
- 11.2.14.5. Financials (Based on Availability)
- 11.2.15 West Pharmaceutical Services
- 11.2.15.1. Overview
- 11.2.15.2. Products
- 11.2.15.3. SWOT Analysis
- 11.2.15.4. Recent Developments
- 11.2.15.5. Financials (Based on Availability)
- 11.2.1 Amcor Plc
List of Figures
- Figure 1: Global Smart Packaging For Pharmaceuticals Revenue Breakdown (million, %) by Region 2025 & 2033
- Figure 2: North America Smart Packaging For Pharmaceuticals Revenue (million), by Application 2025 & 2033
- Figure 3: North America Smart Packaging For Pharmaceuticals Revenue Share (%), by Application 2025 & 2033
- Figure 4: North America Smart Packaging For Pharmaceuticals Revenue (million), by Type 2025 & 2033
- Figure 5: North America Smart Packaging For Pharmaceuticals Revenue Share (%), by Type 2025 & 2033
- Figure 6: North America Smart Packaging For Pharmaceuticals Revenue (million), by Country 2025 & 2033
- Figure 7: North America Smart Packaging For Pharmaceuticals Revenue Share (%), by Country 2025 & 2033
- Figure 8: South America Smart Packaging For Pharmaceuticals Revenue (million), by Application 2025 & 2033
- Figure 9: South America Smart Packaging For Pharmaceuticals Revenue Share (%), by Application 2025 & 2033
- Figure 10: South America Smart Packaging For Pharmaceuticals Revenue (million), by Type 2025 & 2033
- Figure 11: South America Smart Packaging For Pharmaceuticals Revenue Share (%), by Type 2025 & 2033
- Figure 12: South America Smart Packaging For Pharmaceuticals Revenue (million), by Country 2025 & 2033
- Figure 13: South America Smart Packaging For Pharmaceuticals Revenue Share (%), by Country 2025 & 2033
- Figure 14: Europe Smart Packaging For Pharmaceuticals Revenue (million), by Application 2025 & 2033
- Figure 15: Europe Smart Packaging For Pharmaceuticals Revenue Share (%), by Application 2025 & 2033
- Figure 16: Europe Smart Packaging For Pharmaceuticals Revenue (million), by Type 2025 & 2033
- Figure 17: Europe Smart Packaging For Pharmaceuticals Revenue Share (%), by Type 2025 & 2033
- Figure 18: Europe Smart Packaging For Pharmaceuticals Revenue (million), by Country 2025 & 2033
- Figure 19: Europe Smart Packaging For Pharmaceuticals Revenue Share (%), by Country 2025 & 2033
- Figure 20: Middle East & Africa Smart Packaging For Pharmaceuticals Revenue (million), by Application 2025 & 2033
- Figure 21: Middle East & Africa Smart Packaging For Pharmaceuticals Revenue Share (%), by Application 2025 & 2033
- Figure 22: Middle East & Africa Smart Packaging For Pharmaceuticals Revenue (million), by Type 2025 & 2033
- Figure 23: Middle East & Africa Smart Packaging For Pharmaceuticals Revenue Share (%), by Type 2025 & 2033
- Figure 24: Middle East & Africa Smart Packaging For Pharmaceuticals Revenue (million), by Country 2025 & 2033
- Figure 25: Middle East & Africa Smart Packaging For Pharmaceuticals Revenue Share (%), by Country 2025 & 2033
- Figure 26: Asia Pacific Smart Packaging For Pharmaceuticals Revenue (million), by Application 2025 & 2033
- Figure 27: Asia Pacific Smart Packaging For Pharmaceuticals Revenue Share (%), by Application 2025 & 2033
- Figure 28: Asia Pacific Smart Packaging For Pharmaceuticals Revenue (million), by Type 2025 & 2033
- Figure 29: Asia Pacific Smart Packaging For Pharmaceuticals Revenue Share (%), by Type 2025 & 2033
- Figure 30: Asia Pacific Smart Packaging For Pharmaceuticals Revenue (million), by Country 2025 & 2033
- Figure 31: Asia Pacific Smart Packaging For Pharmaceuticals Revenue Share (%), by Country 2025 & 2033
List of Tables
- Table 1: Global Smart Packaging For Pharmaceuticals Revenue million Forecast, by Application 2020 & 2033
- Table 2: Global Smart Packaging For Pharmaceuticals Revenue million Forecast, by Type 2020 & 2033
- Table 3: Global Smart Packaging For Pharmaceuticals Revenue million Forecast, by Region 2020 & 2033
- Table 4: Global Smart Packaging For Pharmaceuticals Revenue million Forecast, by Application 2020 & 2033
- Table 5: Global Smart Packaging For Pharmaceuticals Revenue million Forecast, by Type 2020 & 2033
- Table 6: Global Smart Packaging For Pharmaceuticals Revenue million Forecast, by Country 2020 & 2033
- Table 7: United States Smart Packaging For Pharmaceuticals Revenue (million) Forecast, by Application 2020 & 2033
- Table 8: Canada Smart Packaging For Pharmaceuticals Revenue (million) Forecast, by Application 2020 & 2033
- Table 9: Mexico Smart Packaging For Pharmaceuticals Revenue (million) Forecast, by Application 2020 & 2033
- Table 10: Global Smart Packaging For Pharmaceuticals Revenue million Forecast, by Application 2020 & 2033
- Table 11: Global Smart Packaging For Pharmaceuticals Revenue million Forecast, by Type 2020 & 2033
- Table 12: Global Smart Packaging For Pharmaceuticals Revenue million Forecast, by Country 2020 & 2033
- Table 13: Brazil Smart Packaging For Pharmaceuticals Revenue (million) Forecast, by Application 2020 & 2033
- Table 14: Argentina Smart Packaging For Pharmaceuticals Revenue (million) Forecast, by Application 2020 & 2033
- Table 15: Rest of South America Smart Packaging For Pharmaceuticals Revenue (million) Forecast, by Application 2020 & 2033
- Table 16: Global Smart Packaging For Pharmaceuticals Revenue million Forecast, by Application 2020 & 2033
- Table 17: Global Smart Packaging For Pharmaceuticals Revenue million Forecast, by Type 2020 & 2033
- Table 18: Global Smart Packaging For Pharmaceuticals Revenue million Forecast, by Country 2020 & 2033
- Table 19: United Kingdom Smart Packaging For Pharmaceuticals Revenue (million) Forecast, by Application 2020 & 2033
- Table 20: Germany Smart Packaging For Pharmaceuticals Revenue (million) Forecast, by Application 2020 & 2033
- Table 21: France Smart Packaging For Pharmaceuticals Revenue (million) Forecast, by Application 2020 & 2033
- Table 22: Italy Smart Packaging For Pharmaceuticals Revenue (million) Forecast, by Application 2020 & 2033
- Table 23: Spain Smart Packaging For Pharmaceuticals Revenue (million) Forecast, by Application 2020 & 2033
- Table 24: Russia Smart Packaging For Pharmaceuticals Revenue (million) Forecast, by Application 2020 & 2033
- Table 25: Benelux Smart Packaging For Pharmaceuticals Revenue (million) Forecast, by Application 2020 & 2033
- Table 26: Nordics Smart Packaging For Pharmaceuticals Revenue (million) Forecast, by Application 2020 & 2033
- Table 27: Rest of Europe Smart Packaging For Pharmaceuticals Revenue (million) Forecast, by Application 2020 & 2033
- Table 28: Global Smart Packaging For Pharmaceuticals Revenue million Forecast, by Application 2020 & 2033
- Table 29: Global Smart Packaging For Pharmaceuticals Revenue million Forecast, by Type 2020 & 2033
- Table 30: Global Smart Packaging For Pharmaceuticals Revenue million Forecast, by Country 2020 & 2033
- Table 31: Turkey Smart Packaging For Pharmaceuticals Revenue (million) Forecast, by Application 2020 & 2033
- Table 32: Israel Smart Packaging For Pharmaceuticals Revenue (million) Forecast, by Application 2020 & 2033
- Table 33: GCC Smart Packaging For Pharmaceuticals Revenue (million) Forecast, by Application 2020 & 2033
- Table 34: North Africa Smart Packaging For Pharmaceuticals Revenue (million) Forecast, by Application 2020 & 2033
- Table 35: South Africa Smart Packaging For Pharmaceuticals Revenue (million) Forecast, by Application 2020 & 2033
- Table 36: Rest of Middle East & Africa Smart Packaging For Pharmaceuticals Revenue (million) Forecast, by Application 2020 & 2033
- Table 37: Global Smart Packaging For Pharmaceuticals Revenue million Forecast, by Application 2020 & 2033
- Table 38: Global Smart Packaging For Pharmaceuticals Revenue million Forecast, by Type 2020 & 2033
- Table 39: Global Smart Packaging For Pharmaceuticals Revenue million Forecast, by Country 2020 & 2033
- Table 40: China Smart Packaging For Pharmaceuticals Revenue (million) Forecast, by Application 2020 & 2033
- Table 41: India Smart Packaging For Pharmaceuticals Revenue (million) Forecast, by Application 2020 & 2033
- Table 42: Japan Smart Packaging For Pharmaceuticals Revenue (million) Forecast, by Application 2020 & 2033
- Table 43: South Korea Smart Packaging For Pharmaceuticals Revenue (million) Forecast, by Application 2020 & 2033
- Table 44: ASEAN Smart Packaging For Pharmaceuticals Revenue (million) Forecast, by Application 2020 & 2033
- Table 45: Oceania Smart Packaging For Pharmaceuticals Revenue (million) Forecast, by Application 2020 & 2033
- Table 46: Rest of Asia Pacific Smart Packaging For Pharmaceuticals Revenue (million) Forecast, by Application 2020 & 2033
Frequently Asked Questions
1. What is the projected Compound Annual Growth Rate (CAGR) of the Smart Packaging For Pharmaceuticals?
The projected CAGR is approximately 5.9%.
2. Which companies are prominent players in the Smart Packaging For Pharmaceuticals?
Key companies in the market include Amcor Plc, Authena AG, Avery Dennison, DFP Holding BV, DuPont, BASF SE, Korber Medipak Systems, Ball Corporation, Graphic Packaging, Sealed Air Corporation, CCL Industries, LOG Pharma Packaging, Origin Pharma Packaging, ProAmpac Intermediate, West Pharmaceutical Services.
3. What are the main segments of the Smart Packaging For Pharmaceuticals?
The market segments include Application, Type.
4. Can you provide details about the market size?
The market size is estimated to be USD 45300 million as of 2022.
5. What are some drivers contributing to market growth?
N/A
6. What are the notable trends driving market growth?
N/A
7. Are there any restraints impacting market growth?
N/A
8. Can you provide examples of recent developments in the market?
N/A
9. What pricing options are available for accessing the report?
Pricing options include single-user, multi-user, and enterprise licenses priced at USD 2900.00, USD 4350.00, and USD 5800.00 respectively.
10. Is the market size provided in terms of value or volume?
The market size is provided in terms of value, measured in million.
11. Are there any specific market keywords associated with the report?
Yes, the market keyword associated with the report is "Smart Packaging For Pharmaceuticals," which aids in identifying and referencing the specific market segment covered.
12. How do I determine which pricing option suits my needs best?
The pricing options vary based on user requirements and access needs. Individual users may opt for single-user licenses, while businesses requiring broader access may choose multi-user or enterprise licenses for cost-effective access to the report.
13. Are there any additional resources or data provided in the Smart Packaging For Pharmaceuticals report?
While the report offers comprehensive insights, it's advisable to review the specific contents or supplementary materials provided to ascertain if additional resources or data are available.
14. How can I stay updated on further developments or reports in the Smart Packaging For Pharmaceuticals?
To stay informed about further developments, trends, and reports in the Smart Packaging For Pharmaceuticals, consider subscribing to industry newsletters, following relevant companies and organizations, or regularly checking reputable industry news sources and publications.
Methodology
Step 1 - Identification of Relevant Samples Size from Population Database


Step 2 - Approaches for Defining Global Market Size (Value, Volume* & Price*)

Note*: In applicable scenarios
Step 3 - Data Sources
Primary Research
- Web Analytics
- Survey Reports
- Research Institute
- Latest Research Reports
- Opinion Leaders
Secondary Research
- Annual Reports
- White Paper
- Latest Press Release
- Industry Association
- Paid Database
- Investor Presentations

Step 4 - Data Triangulation
Involves using different sources of information in order to increase the validity of a study
These sources are likely to be stakeholders in a program - participants, other researchers, program staff, other community members, and so on.
Then we put all data in single framework & apply various statistical tools to find out the dynamic on the market.
During the analysis stage, feedback from the stakeholder groups would be compared to determine areas of agreement as well as areas of divergence