
Key Insights
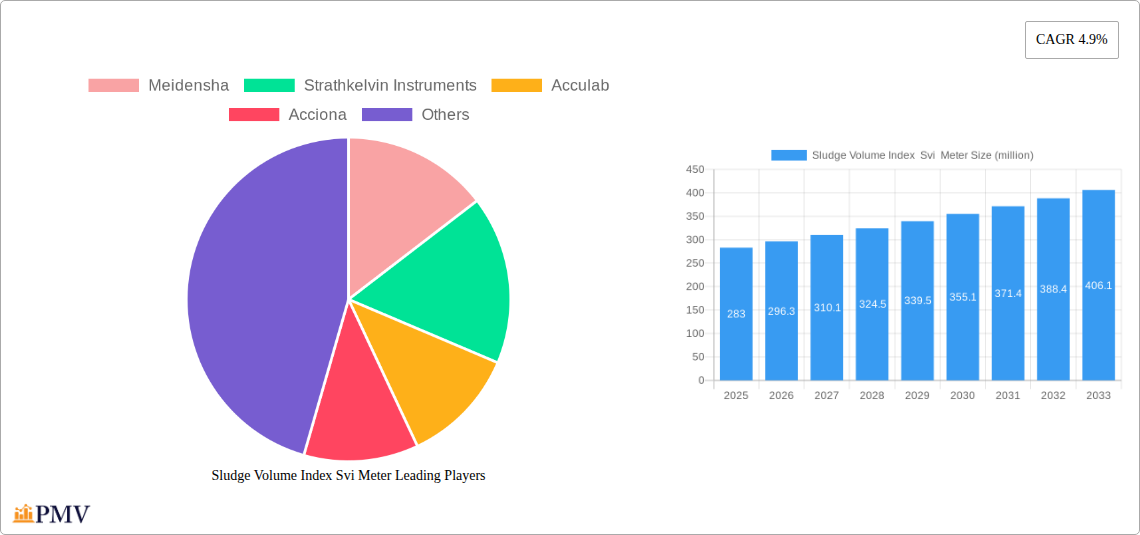
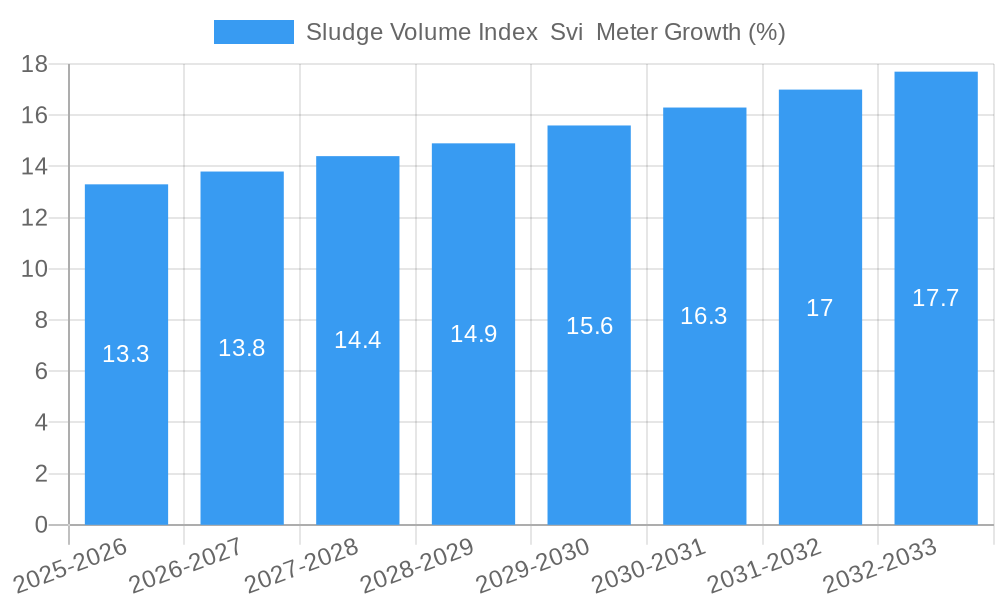
The Sludge Volume Index (SVI) meter market, currently valued at $283 million (2025), is projected to experience robust growth, driven by increasing demand for efficient wastewater treatment and stringent environmental regulations globally. A compound annual growth rate (CAGR) of 4.9% from 2025 to 2033 indicates a steady expansion, fueled by the adoption of advanced technologies for improved sludge management in municipal and industrial wastewater treatment plants. Key drivers include the rising global population leading to increased wastewater generation, the need for precise sludge control to optimize treatment processes, and the growing awareness of the environmental impact of inefficient sludge handling. Furthermore, technological advancements in SVI meter design, such as improved sensor accuracy and automated data analysis capabilities, are contributing to market expansion. While specific regional data is unavailable, we can infer that developed regions such as North America and Europe, with established wastewater infrastructure and environmental regulations, will likely represent a significant portion of the market. Emerging economies in Asia and other regions are also expected to see growth as infrastructure development accelerates.
Despite these positive trends, several challenges could impact the market's trajectory. High initial investment costs associated with SVI meters may pose a barrier to entry for smaller treatment plants, particularly in developing countries. Additionally, the need for skilled personnel to operate and maintain these instruments could create limitations. However, ongoing innovation in the sector, including the development of more cost-effective and user-friendly devices, is mitigating these concerns. Competition amongst established players like Meidensha, Strathkelvin Instruments, Acculab, and Acciona, is likely driving innovation and influencing pricing, making the technology more accessible. The future of the SVI meter market appears promising, with continued growth fueled by technological improvements and an increasing focus on sustainable wastewater management.
Sludge Volume Index (SVI) Meter Market Report: 2019-2033
This comprehensive report provides an in-depth analysis of the global Sludge Volume Index (SVI) Meter market, offering valuable insights for stakeholders across the wastewater treatment and environmental monitoring industries. The report covers the period from 2019 to 2033, with a focus on the forecast period of 2025-2033, using 2025 as the base year. This detailed analysis leverages extensive primary and secondary research to provide a 360° view of the market, including market size estimations (in millions), growth drivers, challenges, and competitive landscape. The report is essential for businesses, investors, and researchers seeking a thorough understanding of this crucial sector within the environmental technology market.
Sludge Volume Index SVI Meter Market Structure & Competitive Dynamics
The global Sludge Volume Index (SVI) Meter market exhibits a moderately concentrated structure, with a few key players holding significant market share. The market is characterized by ongoing innovation, driven by the need for more accurate, efficient, and automated SVI measurement solutions. Regulatory frameworks concerning wastewater treatment standards significantly impact market growth, creating demand for compliant technologies. While there are limited direct substitutes for SVI meters, alternative methods for sludge characterization exist, creating indirect competitive pressures. End-user trends favor automated and integrated systems, pushing manufacturers to incorporate advanced features into their products. Mergers and acquisitions (M&A) activity has been relatively low in recent years, with deal values estimated at approximately $xx million annually.
- Market Concentration: The top 5 players account for approximately xx% of the global market share in 2025.
- Innovation Ecosystem: Ongoing research into improved sensor technology and data analytics is driving innovation.
- Regulatory Landscape: Stringent environmental regulations in developed regions are boosting market growth.
- Product Substitutes: Alternative sludge characterization methods exist, but lack the direct measurement capability of SVI meters.
- M&A Activity: The total value of M&A deals in the SVI meter market from 2019-2024 is estimated at $xx million.
Sludge Volume Index SVI Meter Industry Trends & Insights
The global Sludge Volume Index (SVI) Meter market is projected to experience significant growth throughout the forecast period (2025-2033), with a Compound Annual Growth Rate (CAGR) of xx%. This growth is driven by several factors, including increasing urbanization and industrialization, leading to higher wastewater volumes and stricter environmental regulations. Technological advancements in sensor technology and data analytics are enhancing the accuracy and efficiency of SVI meters. Consumer preferences are shifting towards automated and user-friendly systems, driving the demand for advanced features and integrated solutions. The competitive landscape is dynamic, with companies focusing on innovation and strategic partnerships to expand their market presence. Market penetration remains relatively low in developing regions, presenting substantial opportunities for future growth.
Dominant Markets & Segments in Sludge Volume Index Svi Meter
The North American region currently holds the largest market share in the global Sludge Volume Index (SVI) Meter market. This dominance is primarily attributed to stringent environmental regulations, high levels of industrialization, and robust wastewater treatment infrastructure.
- Key Drivers in North America:
- Stringent environmental regulations and compliance requirements.
- Extensive wastewater treatment infrastructure.
- High adoption of advanced technologies.
- Well-established industrial base generating high volumes of sludge.
The European market is also experiencing significant growth, driven by similar factors, while the Asia-Pacific region is expected to witness the highest growth rate in the coming years, driven by rapid industrialization and urbanization.
Sludge Volume Index Svi Meter Product Innovations
Recent product innovations focus on improving the accuracy, reliability, and ease of use of SVI meters. Miniaturization, wireless connectivity, and advanced data analytics capabilities are becoming increasingly common. These innovations are enhancing the efficiency of wastewater treatment processes and providing valuable data for optimizing plant operations. Manufacturers are also focusing on developing integrated solutions that combine SVI measurement with other parameters, providing a more comprehensive view of sludge characteristics. The integration of cloud-based data management systems is another key trend.
Report Segmentation & Scope
The Sludge Volume Index (SVI) Meter market is segmented by type (portable, online), technology (optical, electrochemical), end-user (municipal wastewater treatment plants, industrial wastewater treatment plants, research institutions), and region (North America, Europe, Asia-Pacific, Middle East & Africa, South America). Each segment's growth projections, market size, and competitive dynamics are analyzed in detail, providing valuable insights into the various market segments and their growth potential. For instance, the online SVI meter segment is expected to experience faster growth due to the increasing demand for real-time monitoring and automation.
Key Drivers of Sludge Volume Index Svi Meter Growth
The growth of the Sludge Volume Index (SVI) Meter market is primarily driven by stringent environmental regulations demanding efficient wastewater treatment and accurate sludge monitoring. Technological advancements, particularly in sensor technology, data analytics, and automation, have significantly enhanced the capabilities of SVI meters. The increasing focus on sustainable wastewater management and resource recovery is also contributing to market growth. Finally, the rising industrialization and urbanization in developing economies are creating significant demand for advanced wastewater treatment solutions.
Challenges in the Sludge Volume Index Svi Meter Sector
The SVI meter sector faces several challenges including the high initial investment cost for advanced systems, which can be a barrier for smaller wastewater treatment plants. Competition from alternative sludge characterization methods and the need for skilled personnel to operate and maintain the equipment also pose challenges. Supply chain disruptions and fluctuations in raw material prices can impact the cost and availability of SVI meters. Finally, the lack of standardized protocols for SVI measurement can create inconsistencies across different systems. The combined impact of these factors is estimated to impede market growth by approximately xx% in 2025.
Leading Players in the Sludge Volume Index Svi Meter Market
- Meidensha
- Strathkelvin Instruments
- Acculab
- Acciona
Key Developments in Sludge Volume Index Svi Meter Sector
- 2022-Q4: Strathkelvin Instruments launched a new line of advanced SVI meters with improved accuracy and data analysis capabilities.
- 2023-Q1: Acculab announced a strategic partnership with a leading wastewater treatment technology provider.
- 2024-Q2: Meidensha released an updated version of its flagship SVI meter incorporating AI-powered predictive analytics.
Strategic Sludge Volume Index Svi Meter Market Outlook
The future of the Sludge Volume Index (SVI) Meter market looks promising, driven by sustained growth in wastewater treatment infrastructure globally, increased adoption of advanced automation technologies, and the growing need for real-time monitoring. Strategic opportunities exist for companies focusing on innovative product development, strategic partnerships, and expansion into developing markets. The incorporation of artificial intelligence and machine learning capabilities will play a vital role in enhancing the capabilities of SVI meters and improving the efficiency of wastewater treatment processes. The market is poised for continued growth and innovation, creating significant opportunities for existing and new players.
Sludge Volume Index Svi Meter Segmentation
-
1. Application
- 1.1. Environmental Treatment
- 1.2. Mining Industry
- 1.3. Construction
- 1.4. Others
-
2. Type
- 2.1. Fully Automatic
- 2.2. Semi-Automatic
Sludge Volume Index Svi Meter Segmentation By Geography
-
1. North America
- 1.1. United States
- 1.2. Canada
- 1.3. Mexico
-
2. South America
- 2.1. Brazil
- 2.2. Argentina
- 2.3. Rest of South America
-
3. Europe
- 3.1. United Kingdom
- 3.2. Germany
- 3.3. France
- 3.4. Italy
- 3.5. Spain
- 3.6. Russia
- 3.7. Benelux
- 3.8. Nordics
- 3.9. Rest of Europe
-
4. Middle East & Africa
- 4.1. Turkey
- 4.2. Israel
- 4.3. GCC
- 4.4. North Africa
- 4.5. South Africa
- 4.6. Rest of Middle East & Africa
-
5. Asia Pacific
- 5.1. China
- 5.2. India
- 5.3. Japan
- 5.4. South Korea
- 5.5. ASEAN
- 5.6. Oceania
- 5.7. Rest of Asia Pacific

Sludge Volume Index Svi Meter REPORT HIGHLIGHTS
| Aspects | Details |
|---|---|
| Study Period | 2019-2033 |
| Base Year | 2024 |
| Estimated Year | 2025 |
| Forecast Period | 2025-2033 |
| Historical Period | 2019-2024 |
| Growth Rate | CAGR of 4.9% from 2019-2033 |
| Segmentation |
|
Table of Contents
- 1. Introduction
- 1.1. Research Scope
- 1.2. Market Segmentation
- 1.3. Research Methodology
- 1.4. Definitions and Assumptions
- 2. Executive Summary
- 2.1. Introduction
- 3. Market Dynamics
- 3.1. Introduction
- 3.2. Market Drivers
- 3.3. Market Restrains
- 3.4. Market Trends
- 4. Market Factor Analysis
- 4.1. Porters Five Forces
- 4.2. Supply/Value Chain
- 4.3. PESTEL analysis
- 4.4. Market Entropy
- 4.5. Patent/Trademark Analysis
- 5. Global Sludge Volume Index Svi Meter Analysis, Insights and Forecast, 2019-2031
- 5.1. Market Analysis, Insights and Forecast - by Application
- 5.1.1. Environmental Treatment
- 5.1.2. Mining Industry
- 5.1.3. Construction
- 5.1.4. Others
- 5.2. Market Analysis, Insights and Forecast - by Type
- 5.2.1. Fully Automatic
- 5.2.2. Semi-Automatic
- 5.3. Market Analysis, Insights and Forecast - by Region
- 5.3.1. North America
- 5.3.2. South America
- 5.3.3. Europe
- 5.3.4. Middle East & Africa
- 5.3.5. Asia Pacific
- 5.1. Market Analysis, Insights and Forecast - by Application
- 6. North America Sludge Volume Index Svi Meter Analysis, Insights and Forecast, 2019-2031
- 6.1. Market Analysis, Insights and Forecast - by Application
- 6.1.1. Environmental Treatment
- 6.1.2. Mining Industry
- 6.1.3. Construction
- 6.1.4. Others
- 6.2. Market Analysis, Insights and Forecast - by Type
- 6.2.1. Fully Automatic
- 6.2.2. Semi-Automatic
- 6.1. Market Analysis, Insights and Forecast - by Application
- 7. South America Sludge Volume Index Svi Meter Analysis, Insights and Forecast, 2019-2031
- 7.1. Market Analysis, Insights and Forecast - by Application
- 7.1.1. Environmental Treatment
- 7.1.2. Mining Industry
- 7.1.3. Construction
- 7.1.4. Others
- 7.2. Market Analysis, Insights and Forecast - by Type
- 7.2.1. Fully Automatic
- 7.2.2. Semi-Automatic
- 7.1. Market Analysis, Insights and Forecast - by Application
- 8. Europe Sludge Volume Index Svi Meter Analysis, Insights and Forecast, 2019-2031
- 8.1. Market Analysis, Insights and Forecast - by Application
- 8.1.1. Environmental Treatment
- 8.1.2. Mining Industry
- 8.1.3. Construction
- 8.1.4. Others
- 8.2. Market Analysis, Insights and Forecast - by Type
- 8.2.1. Fully Automatic
- 8.2.2. Semi-Automatic
- 8.1. Market Analysis, Insights and Forecast - by Application
- 9. Middle East & Africa Sludge Volume Index Svi Meter Analysis, Insights and Forecast, 2019-2031
- 9.1. Market Analysis, Insights and Forecast - by Application
- 9.1.1. Environmental Treatment
- 9.1.2. Mining Industry
- 9.1.3. Construction
- 9.1.4. Others
- 9.2. Market Analysis, Insights and Forecast - by Type
- 9.2.1. Fully Automatic
- 9.2.2. Semi-Automatic
- 9.1. Market Analysis, Insights and Forecast - by Application
- 10. Asia Pacific Sludge Volume Index Svi Meter Analysis, Insights and Forecast, 2019-2031
- 10.1. Market Analysis, Insights and Forecast - by Application
- 10.1.1. Environmental Treatment
- 10.1.2. Mining Industry
- 10.1.3. Construction
- 10.1.4. Others
- 10.2. Market Analysis, Insights and Forecast - by Type
- 10.2.1. Fully Automatic
- 10.2.2. Semi-Automatic
- 10.1. Market Analysis, Insights and Forecast - by Application
- 11. Competitive Analysis
- 11.1. Global Market Share Analysis 2024
- 11.2. Company Profiles
- 11.2.1 Meidensha
- 11.2.1.1. Overview
- 11.2.1.2. Products
- 11.2.1.3. SWOT Analysis
- 11.2.1.4. Recent Developments
- 11.2.1.5. Financials (Based on Availability)
- 11.2.2 Strathkelvin Instruments
- 11.2.2.1. Overview
- 11.2.2.2. Products
- 11.2.2.3. SWOT Analysis
- 11.2.2.4. Recent Developments
- 11.2.2.5. Financials (Based on Availability)
- 11.2.3 Acculab
- 11.2.3.1. Overview
- 11.2.3.2. Products
- 11.2.3.3. SWOT Analysis
- 11.2.3.4. Recent Developments
- 11.2.3.5. Financials (Based on Availability)
- 11.2.4 Acciona
- 11.2.4.1. Overview
- 11.2.4.2. Products
- 11.2.4.3. SWOT Analysis
- 11.2.4.4. Recent Developments
- 11.2.4.5. Financials (Based on Availability)
- 11.2.1 Meidensha
List of Figures
- Figure 1: Global Sludge Volume Index Svi Meter Revenue Breakdown (million, %) by Region 2024 & 2032
- Figure 2: Global Sludge Volume Index Svi Meter Volume Breakdown (K, %) by Region 2024 & 2032
- Figure 3: North America Sludge Volume Index Svi Meter Revenue (million), by Application 2024 & 2032
- Figure 4: North America Sludge Volume Index Svi Meter Volume (K), by Application 2024 & 2032
- Figure 5: North America Sludge Volume Index Svi Meter Revenue Share (%), by Application 2024 & 2032
- Figure 6: North America Sludge Volume Index Svi Meter Volume Share (%), by Application 2024 & 2032
- Figure 7: North America Sludge Volume Index Svi Meter Revenue (million), by Type 2024 & 2032
- Figure 8: North America Sludge Volume Index Svi Meter Volume (K), by Type 2024 & 2032
- Figure 9: North America Sludge Volume Index Svi Meter Revenue Share (%), by Type 2024 & 2032
- Figure 10: North America Sludge Volume Index Svi Meter Volume Share (%), by Type 2024 & 2032
- Figure 11: North America Sludge Volume Index Svi Meter Revenue (million), by Country 2024 & 2032
- Figure 12: North America Sludge Volume Index Svi Meter Volume (K), by Country 2024 & 2032
- Figure 13: North America Sludge Volume Index Svi Meter Revenue Share (%), by Country 2024 & 2032
- Figure 14: North America Sludge Volume Index Svi Meter Volume Share (%), by Country 2024 & 2032
- Figure 15: South America Sludge Volume Index Svi Meter Revenue (million), by Application 2024 & 2032
- Figure 16: South America Sludge Volume Index Svi Meter Volume (K), by Application 2024 & 2032
- Figure 17: South America Sludge Volume Index Svi Meter Revenue Share (%), by Application 2024 & 2032
- Figure 18: South America Sludge Volume Index Svi Meter Volume Share (%), by Application 2024 & 2032
- Figure 19: South America Sludge Volume Index Svi Meter Revenue (million), by Type 2024 & 2032
- Figure 20: South America Sludge Volume Index Svi Meter Volume (K), by Type 2024 & 2032
- Figure 21: South America Sludge Volume Index Svi Meter Revenue Share (%), by Type 2024 & 2032
- Figure 22: South America Sludge Volume Index Svi Meter Volume Share (%), by Type 2024 & 2032
- Figure 23: South America Sludge Volume Index Svi Meter Revenue (million), by Country 2024 & 2032
- Figure 24: South America Sludge Volume Index Svi Meter Volume (K), by Country 2024 & 2032
- Figure 25: South America Sludge Volume Index Svi Meter Revenue Share (%), by Country 2024 & 2032
- Figure 26: South America Sludge Volume Index Svi Meter Volume Share (%), by Country 2024 & 2032
- Figure 27: Europe Sludge Volume Index Svi Meter Revenue (million), by Application 2024 & 2032
- Figure 28: Europe Sludge Volume Index Svi Meter Volume (K), by Application 2024 & 2032
- Figure 29: Europe Sludge Volume Index Svi Meter Revenue Share (%), by Application 2024 & 2032
- Figure 30: Europe Sludge Volume Index Svi Meter Volume Share (%), by Application 2024 & 2032
- Figure 31: Europe Sludge Volume Index Svi Meter Revenue (million), by Type 2024 & 2032
- Figure 32: Europe Sludge Volume Index Svi Meter Volume (K), by Type 2024 & 2032
- Figure 33: Europe Sludge Volume Index Svi Meter Revenue Share (%), by Type 2024 & 2032
- Figure 34: Europe Sludge Volume Index Svi Meter Volume Share (%), by Type 2024 & 2032
- Figure 35: Europe Sludge Volume Index Svi Meter Revenue (million), by Country 2024 & 2032
- Figure 36: Europe Sludge Volume Index Svi Meter Volume (K), by Country 2024 & 2032
- Figure 37: Europe Sludge Volume Index Svi Meter Revenue Share (%), by Country 2024 & 2032
- Figure 38: Europe Sludge Volume Index Svi Meter Volume Share (%), by Country 2024 & 2032
- Figure 39: Middle East & Africa Sludge Volume Index Svi Meter Revenue (million), by Application 2024 & 2032
- Figure 40: Middle East & Africa Sludge Volume Index Svi Meter Volume (K), by Application 2024 & 2032
- Figure 41: Middle East & Africa Sludge Volume Index Svi Meter Revenue Share (%), by Application 2024 & 2032
- Figure 42: Middle East & Africa Sludge Volume Index Svi Meter Volume Share (%), by Application 2024 & 2032
- Figure 43: Middle East & Africa Sludge Volume Index Svi Meter Revenue (million), by Type 2024 & 2032
- Figure 44: Middle East & Africa Sludge Volume Index Svi Meter Volume (K), by Type 2024 & 2032
- Figure 45: Middle East & Africa Sludge Volume Index Svi Meter Revenue Share (%), by Type 2024 & 2032
- Figure 46: Middle East & Africa Sludge Volume Index Svi Meter Volume Share (%), by Type 2024 & 2032
- Figure 47: Middle East & Africa Sludge Volume Index Svi Meter Revenue (million), by Country 2024 & 2032
- Figure 48: Middle East & Africa Sludge Volume Index Svi Meter Volume (K), by Country 2024 & 2032
- Figure 49: Middle East & Africa Sludge Volume Index Svi Meter Revenue Share (%), by Country 2024 & 2032
- Figure 50: Middle East & Africa Sludge Volume Index Svi Meter Volume Share (%), by Country 2024 & 2032
- Figure 51: Asia Pacific Sludge Volume Index Svi Meter Revenue (million), by Application 2024 & 2032
- Figure 52: Asia Pacific Sludge Volume Index Svi Meter Volume (K), by Application 2024 & 2032
- Figure 53: Asia Pacific Sludge Volume Index Svi Meter Revenue Share (%), by Application 2024 & 2032
- Figure 54: Asia Pacific Sludge Volume Index Svi Meter Volume Share (%), by Application 2024 & 2032
- Figure 55: Asia Pacific Sludge Volume Index Svi Meter Revenue (million), by Type 2024 & 2032
- Figure 56: Asia Pacific Sludge Volume Index Svi Meter Volume (K), by Type 2024 & 2032
- Figure 57: Asia Pacific Sludge Volume Index Svi Meter Revenue Share (%), by Type 2024 & 2032
- Figure 58: Asia Pacific Sludge Volume Index Svi Meter Volume Share (%), by Type 2024 & 2032
- Figure 59: Asia Pacific Sludge Volume Index Svi Meter Revenue (million), by Country 2024 & 2032
- Figure 60: Asia Pacific Sludge Volume Index Svi Meter Volume (K), by Country 2024 & 2032
- Figure 61: Asia Pacific Sludge Volume Index Svi Meter Revenue Share (%), by Country 2024 & 2032
- Figure 62: Asia Pacific Sludge Volume Index Svi Meter Volume Share (%), by Country 2024 & 2032
List of Tables
- Table 1: Global Sludge Volume Index Svi Meter Revenue million Forecast, by Region 2019 & 2032
- Table 2: Global Sludge Volume Index Svi Meter Volume K Forecast, by Region 2019 & 2032
- Table 3: Global Sludge Volume Index Svi Meter Revenue million Forecast, by Application 2019 & 2032
- Table 4: Global Sludge Volume Index Svi Meter Volume K Forecast, by Application 2019 & 2032
- Table 5: Global Sludge Volume Index Svi Meter Revenue million Forecast, by Type 2019 & 2032
- Table 6: Global Sludge Volume Index Svi Meter Volume K Forecast, by Type 2019 & 2032
- Table 7: Global Sludge Volume Index Svi Meter Revenue million Forecast, by Region 2019 & 2032
- Table 8: Global Sludge Volume Index Svi Meter Volume K Forecast, by Region 2019 & 2032
- Table 9: Global Sludge Volume Index Svi Meter Revenue million Forecast, by Application 2019 & 2032
- Table 10: Global Sludge Volume Index Svi Meter Volume K Forecast, by Application 2019 & 2032
- Table 11: Global Sludge Volume Index Svi Meter Revenue million Forecast, by Type 2019 & 2032
- Table 12: Global Sludge Volume Index Svi Meter Volume K Forecast, by Type 2019 & 2032
- Table 13: Global Sludge Volume Index Svi Meter Revenue million Forecast, by Country 2019 & 2032
- Table 14: Global Sludge Volume Index Svi Meter Volume K Forecast, by Country 2019 & 2032
- Table 15: United States Sludge Volume Index Svi Meter Revenue (million) Forecast, by Application 2019 & 2032
- Table 16: United States Sludge Volume Index Svi Meter Volume (K) Forecast, by Application 2019 & 2032
- Table 17: Canada Sludge Volume Index Svi Meter Revenue (million) Forecast, by Application 2019 & 2032
- Table 18: Canada Sludge Volume Index Svi Meter Volume (K) Forecast, by Application 2019 & 2032
- Table 19: Mexico Sludge Volume Index Svi Meter Revenue (million) Forecast, by Application 2019 & 2032
- Table 20: Mexico Sludge Volume Index Svi Meter Volume (K) Forecast, by Application 2019 & 2032
- Table 21: Global Sludge Volume Index Svi Meter Revenue million Forecast, by Application 2019 & 2032
- Table 22: Global Sludge Volume Index Svi Meter Volume K Forecast, by Application 2019 & 2032
- Table 23: Global Sludge Volume Index Svi Meter Revenue million Forecast, by Type 2019 & 2032
- Table 24: Global Sludge Volume Index Svi Meter Volume K Forecast, by Type 2019 & 2032
- Table 25: Global Sludge Volume Index Svi Meter Revenue million Forecast, by Country 2019 & 2032
- Table 26: Global Sludge Volume Index Svi Meter Volume K Forecast, by Country 2019 & 2032
- Table 27: Brazil Sludge Volume Index Svi Meter Revenue (million) Forecast, by Application 2019 & 2032
- Table 28: Brazil Sludge Volume Index Svi Meter Volume (K) Forecast, by Application 2019 & 2032
- Table 29: Argentina Sludge Volume Index Svi Meter Revenue (million) Forecast, by Application 2019 & 2032
- Table 30: Argentina Sludge Volume Index Svi Meter Volume (K) Forecast, by Application 2019 & 2032
- Table 31: Rest of South America Sludge Volume Index Svi Meter Revenue (million) Forecast, by Application 2019 & 2032
- Table 32: Rest of South America Sludge Volume Index Svi Meter Volume (K) Forecast, by Application 2019 & 2032
- Table 33: Global Sludge Volume Index Svi Meter Revenue million Forecast, by Application 2019 & 2032
- Table 34: Global Sludge Volume Index Svi Meter Volume K Forecast, by Application 2019 & 2032
- Table 35: Global Sludge Volume Index Svi Meter Revenue million Forecast, by Type 2019 & 2032
- Table 36: Global Sludge Volume Index Svi Meter Volume K Forecast, by Type 2019 & 2032
- Table 37: Global Sludge Volume Index Svi Meter Revenue million Forecast, by Country 2019 & 2032
- Table 38: Global Sludge Volume Index Svi Meter Volume K Forecast, by Country 2019 & 2032
- Table 39: United Kingdom Sludge Volume Index Svi Meter Revenue (million) Forecast, by Application 2019 & 2032
- Table 40: United Kingdom Sludge Volume Index Svi Meter Volume (K) Forecast, by Application 2019 & 2032
- Table 41: Germany Sludge Volume Index Svi Meter Revenue (million) Forecast, by Application 2019 & 2032
- Table 42: Germany Sludge Volume Index Svi Meter Volume (K) Forecast, by Application 2019 & 2032
- Table 43: France Sludge Volume Index Svi Meter Revenue (million) Forecast, by Application 2019 & 2032
- Table 44: France Sludge Volume Index Svi Meter Volume (K) Forecast, by Application 2019 & 2032
- Table 45: Italy Sludge Volume Index Svi Meter Revenue (million) Forecast, by Application 2019 & 2032
- Table 46: Italy Sludge Volume Index Svi Meter Volume (K) Forecast, by Application 2019 & 2032
- Table 47: Spain Sludge Volume Index Svi Meter Revenue (million) Forecast, by Application 2019 & 2032
- Table 48: Spain Sludge Volume Index Svi Meter Volume (K) Forecast, by Application 2019 & 2032
- Table 49: Russia Sludge Volume Index Svi Meter Revenue (million) Forecast, by Application 2019 & 2032
- Table 50: Russia Sludge Volume Index Svi Meter Volume (K) Forecast, by Application 2019 & 2032
- Table 51: Benelux Sludge Volume Index Svi Meter Revenue (million) Forecast, by Application 2019 & 2032
- Table 52: Benelux Sludge Volume Index Svi Meter Volume (K) Forecast, by Application 2019 & 2032
- Table 53: Nordics Sludge Volume Index Svi Meter Revenue (million) Forecast, by Application 2019 & 2032
- Table 54: Nordics Sludge Volume Index Svi Meter Volume (K) Forecast, by Application 2019 & 2032
- Table 55: Rest of Europe Sludge Volume Index Svi Meter Revenue (million) Forecast, by Application 2019 & 2032
- Table 56: Rest of Europe Sludge Volume Index Svi Meter Volume (K) Forecast, by Application 2019 & 2032
- Table 57: Global Sludge Volume Index Svi Meter Revenue million Forecast, by Application 2019 & 2032
- Table 58: Global Sludge Volume Index Svi Meter Volume K Forecast, by Application 2019 & 2032
- Table 59: Global Sludge Volume Index Svi Meter Revenue million Forecast, by Type 2019 & 2032
- Table 60: Global Sludge Volume Index Svi Meter Volume K Forecast, by Type 2019 & 2032
- Table 61: Global Sludge Volume Index Svi Meter Revenue million Forecast, by Country 2019 & 2032
- Table 62: Global Sludge Volume Index Svi Meter Volume K Forecast, by Country 2019 & 2032
- Table 63: Turkey Sludge Volume Index Svi Meter Revenue (million) Forecast, by Application 2019 & 2032
- Table 64: Turkey Sludge Volume Index Svi Meter Volume (K) Forecast, by Application 2019 & 2032
- Table 65: Israel Sludge Volume Index Svi Meter Revenue (million) Forecast, by Application 2019 & 2032
- Table 66: Israel Sludge Volume Index Svi Meter Volume (K) Forecast, by Application 2019 & 2032
- Table 67: GCC Sludge Volume Index Svi Meter Revenue (million) Forecast, by Application 2019 & 2032
- Table 68: GCC Sludge Volume Index Svi Meter Volume (K) Forecast, by Application 2019 & 2032
- Table 69: North Africa Sludge Volume Index Svi Meter Revenue (million) Forecast, by Application 2019 & 2032
- Table 70: North Africa Sludge Volume Index Svi Meter Volume (K) Forecast, by Application 2019 & 2032
- Table 71: South Africa Sludge Volume Index Svi Meter Revenue (million) Forecast, by Application 2019 & 2032
- Table 72: South Africa Sludge Volume Index Svi Meter Volume (K) Forecast, by Application 2019 & 2032
- Table 73: Rest of Middle East & Africa Sludge Volume Index Svi Meter Revenue (million) Forecast, by Application 2019 & 2032
- Table 74: Rest of Middle East & Africa Sludge Volume Index Svi Meter Volume (K) Forecast, by Application 2019 & 2032
- Table 75: Global Sludge Volume Index Svi Meter Revenue million Forecast, by Application 2019 & 2032
- Table 76: Global Sludge Volume Index Svi Meter Volume K Forecast, by Application 2019 & 2032
- Table 77: Global Sludge Volume Index Svi Meter Revenue million Forecast, by Type 2019 & 2032
- Table 78: Global Sludge Volume Index Svi Meter Volume K Forecast, by Type 2019 & 2032
- Table 79: Global Sludge Volume Index Svi Meter Revenue million Forecast, by Country 2019 & 2032
- Table 80: Global Sludge Volume Index Svi Meter Volume K Forecast, by Country 2019 & 2032
- Table 81: China Sludge Volume Index Svi Meter Revenue (million) Forecast, by Application 2019 & 2032
- Table 82: China Sludge Volume Index Svi Meter Volume (K) Forecast, by Application 2019 & 2032
- Table 83: India Sludge Volume Index Svi Meter Revenue (million) Forecast, by Application 2019 & 2032
- Table 84: India Sludge Volume Index Svi Meter Volume (K) Forecast, by Application 2019 & 2032
- Table 85: Japan Sludge Volume Index Svi Meter Revenue (million) Forecast, by Application 2019 & 2032
- Table 86: Japan Sludge Volume Index Svi Meter Volume (K) Forecast, by Application 2019 & 2032
- Table 87: South Korea Sludge Volume Index Svi Meter Revenue (million) Forecast, by Application 2019 & 2032
- Table 88: South Korea Sludge Volume Index Svi Meter Volume (K) Forecast, by Application 2019 & 2032
- Table 89: ASEAN Sludge Volume Index Svi Meter Revenue (million) Forecast, by Application 2019 & 2032
- Table 90: ASEAN Sludge Volume Index Svi Meter Volume (K) Forecast, by Application 2019 & 2032
- Table 91: Oceania Sludge Volume Index Svi Meter Revenue (million) Forecast, by Application 2019 & 2032
- Table 92: Oceania Sludge Volume Index Svi Meter Volume (K) Forecast, by Application 2019 & 2032
- Table 93: Rest of Asia Pacific Sludge Volume Index Svi Meter Revenue (million) Forecast, by Application 2019 & 2032
- Table 94: Rest of Asia Pacific Sludge Volume Index Svi Meter Volume (K) Forecast, by Application 2019 & 2032
Frequently Asked Questions
1. What is the projected Compound Annual Growth Rate (CAGR) of the Sludge Volume Index Svi Meter?
The projected CAGR is approximately 4.9%.
2. Which companies are prominent players in the Sludge Volume Index Svi Meter?
Key companies in the market include Meidensha, Strathkelvin Instruments, Acculab, Acciona.
3. What are the main segments of the Sludge Volume Index Svi Meter?
The market segments include Application, Type.
4. Can you provide details about the market size?
The market size is estimated to be USD 283 million as of 2022.
5. What are some drivers contributing to market growth?
N/A
6. What are the notable trends driving market growth?
N/A
7. Are there any restraints impacting market growth?
N/A
8. Can you provide examples of recent developments in the market?
N/A
9. What pricing options are available for accessing the report?
Pricing options include single-user, multi-user, and enterprise licenses priced at USD 3950.00, USD 5925.00, and USD 7900.00 respectively.
10. Is the market size provided in terms of value or volume?
The market size is provided in terms of value, measured in million and volume, measured in K.
11. Are there any specific market keywords associated with the report?
Yes, the market keyword associated with the report is "Sludge Volume Index Svi Meter," which aids in identifying and referencing the specific market segment covered.
12. How do I determine which pricing option suits my needs best?
The pricing options vary based on user requirements and access needs. Individual users may opt for single-user licenses, while businesses requiring broader access may choose multi-user or enterprise licenses for cost-effective access to the report.
13. Are there any additional resources or data provided in the Sludge Volume Index Svi Meter report?
While the report offers comprehensive insights, it's advisable to review the specific contents or supplementary materials provided to ascertain if additional resources or data are available.
14. How can I stay updated on further developments or reports in the Sludge Volume Index Svi Meter?
To stay informed about further developments, trends, and reports in the Sludge Volume Index Svi Meter, consider subscribing to industry newsletters, following relevant companies and organizations, or regularly checking reputable industry news sources and publications.
Methodology
Step 1 - Identification of Relevant Samples Size from Population Database


Step 2 - Approaches for Defining Global Market Size (Value, Volume* & Price*)

Note*: In applicable scenarios
Step 3 - Data Sources
Primary Research
- Web Analytics
- Survey Reports
- Research Institute
- Latest Research Reports
- Opinion Leaders
Secondary Research
- Annual Reports
- White Paper
- Latest Press Release
- Industry Association
- Paid Database
- Investor Presentations

Step 4 - Data Triangulation
Involves using different sources of information in order to increase the validity of a study
These sources are likely to be stakeholders in a program - participants, other researchers, program staff, other community members, and so on.
Then we put all data in single framework & apply various statistical tools to find out the dynamic on the market.
During the analysis stage, feedback from the stakeholder groups would be compared to determine areas of agreement as well as areas of divergence


