

Key Insights
The global single-wall paper cup market is projected to experience substantial growth, anticipated to reach $11.52 billion by 2025, expanding at a Compound Annual Growth Rate (CAGR) of 4.42%. This expansion is driven by increasing demand for convenient, disposable beverage packaging in the expanding food service sector and the rise of on-the-go consumption. The proliferation of coffee culture, fast-food establishments, and takeaway services directly fuels paper cup usage. Furthermore, a growing consumer preference for sustainable and eco-friendly alternatives to plastic is a key factor. The inherent recyclability and biodegradability of paper cups make them an attractive choice, aligning with corporate sustainability goals and regulatory efforts to curb plastic waste.
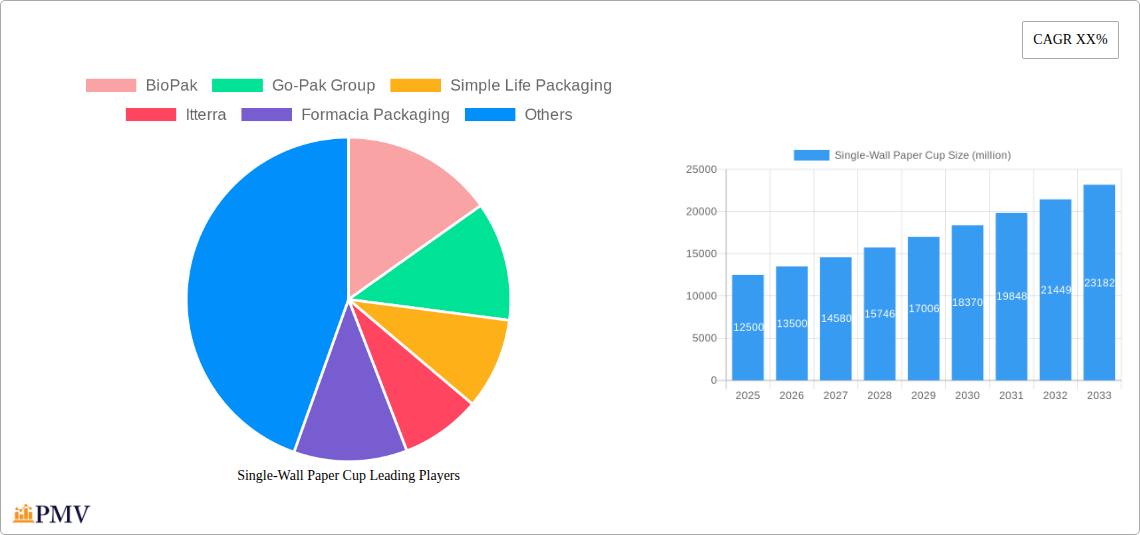
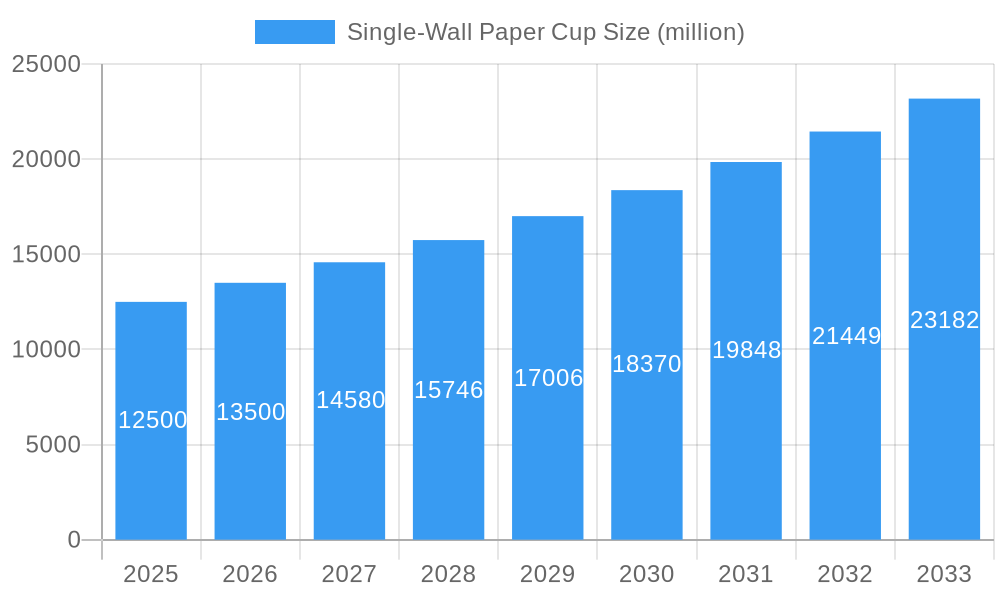
Single-Wall Paper Cup Market Size (In Billion)
Market challenges include fluctuating raw material prices, particularly for paper pulp, which can affect manufacturer profitability and pricing. Intense competition among established players necessitates ongoing innovation in design, functionality, and sustainability to retain market share. The "Online Sales" segment is demonstrating rapid growth, reflecting increased e-commerce adoption. Among product types, "Kraft" paper cups are gaining popularity due to their natural appearance and eco-friendly perception. Geographically, Asia Pacific, led by China and India, is expected to dominate due to its large population, rapid urbanization, growing middle class, and increasing awareness of sustainable packaging. North America and Europe, with mature food service markets and stringent environmental regulations, will remain significant contributors.
Single-Wall Paper Cup Company Market Share
Single-Wall Paper Cup Market Structure & Competitive Dynamics
The single-wall paper cup market exhibits a moderately consolidated structure, with a significant presence of both established multinational corporations and regional players. Market concentration is influenced by factors such as production capacity, economies of scale, and brand recognition. The innovation ecosystem is characterized by ongoing advancements in material science, sustainable coatings, and printing technologies aimed at enhancing product performance and environmental appeal. Regulatory frameworks, particularly concerning food contact materials and single-use plastic alternatives, play a pivotal role in shaping market entry and product development strategies. Product substitutes, including reusable cups and alternative packaging materials, present a continuous competitive challenge, driving manufacturers to differentiate through cost-effectiveness, design, and eco-friendly attributes. End-user trends are increasingly leaning towards sustainable and convenient packaging solutions, fueled by growing environmental awareness and the booming food service and e-commerce sectors. Mergers and Acquisitions (M&A) activities are observed as companies seek to expand their geographical reach, enhance their product portfolios, and achieve vertical integration. For instance, strategic acquisitions in recent years have consolidated market share, with estimated M&A deal values reaching multi-million dollar figures. The competitive landscape is intensely shaped by pricing strategies, supply chain efficiency, and the ability to cater to diverse customization needs.
Single-Wall Paper Cup Industry Trends & Insights
The single-wall paper cup industry is experiencing robust growth, projected to expand at a compound annual growth rate (CAGR) of approximately 6.5% during the forecast period of 2025–2033. This upward trajectory is primarily driven by escalating global demand for convenient and sustainable beverage packaging solutions. A key market driver is the burgeoning food service sector, encompassing cafes, restaurants, fast-food outlets, and catering services, which rely heavily on disposable cups for daily operations. The rapid expansion of the online food delivery market, with an estimated market penetration of over 70% in urban areas by 2025, further amplifies the need for single-wall paper cups for both hot and cold beverage delivery.
Technological disruptions are continuously reshaping the industry. Innovations in paperboard manufacturing, including the adoption of advanced coating technologies and the development of compostable and biodegradable materials, are addressing environmental concerns and regulatory pressures. The integration of digital printing technologies allows for enhanced customization and branding opportunities, enabling manufacturers to offer personalized designs for specific clients and events.
Consumer preferences are increasingly shifting towards eco-friendly alternatives to plastic. This is fueled by heightened environmental consciousness and a growing demand for products with a lower ecological footprint. Consumers are actively seeking out paper cups made from recycled or sustainably sourced materials. The demand for Kraft single-wall paper cups, known for their natural aesthetic and perceived eco-friendliness, is witnessing a significant surge. Similarly, advancements in Paper Board quality, offering better insulation and durability, are also contributing to market growth.
Competitive dynamics within the single-wall paper cup market are characterized by price sensitivity, product differentiation, and strategic partnerships. Manufacturers are focusing on optimizing their supply chains to ensure timely delivery and cost-effectiveness, while simultaneously investing in research and development to introduce innovative and sustainable products. The market penetration of advanced, eco-friendly single-wall paper cups is projected to exceed 55% by 2030.
Dominant Markets & Segments in Single-Wall Paper Cup
The North America region currently holds a dominant position in the global single-wall paper cup market, accounting for an estimated 30% of the total market share in the base year 2025. This dominance is propelled by a confluence of robust economic policies, advanced infrastructure, and a highly developed food service industry. The United States, in particular, represents a significant market, driven by a high per capita consumption of beverages and a strong consumer inclination towards convenience. Government initiatives promoting the use of sustainable packaging alternatives to single-use plastics further bolster the demand for single-wall paper cups.
Within North America, Offline Sales represent the largest application segment, contributing approximately 75% to the regional market revenue in 2025. This dominance stems from the extensive network of brick-and-mortar establishments such as coffee shops, fast-food chains, and restaurants, which are primary end-users of single-wall paper cups. The daily influx of customers in these establishments creates a consistent and substantial demand.
However, the Online Sales segment is exhibiting a remarkable growth rate, projected to witness a CAGR of over 8% during the forecast period. This accelerated growth is directly attributed to the explosive expansion of food delivery services and the increasing adoption of e-commerce for beverage purchases. As more consumers opt for convenience, the demand for securely packaged and well-insulated paper cups for delivery is escalating, making this a crucial segment for future market expansion.
In terms of product types, Paper Board holds the largest market share within the single-wall paper cup segment, estimated at 65% in 2025. High-quality paperboard offers excellent printability, structural integrity, and insulation properties, making it suitable for a wide range of hot and cold beverages. The ability to be coated with food-grade materials further enhances its appeal for direct food contact applications.
The Kraft paper cup segment is experiencing significant traction due to its natural aesthetic and its perception as a more sustainable option. While currently holding a smaller market share of around 35%, its growth rate is projected to be higher than that of generic paperboard due to increasing consumer demand for eco-friendly products and the growing trend of minimalist and artisanal branding. The economic policies favoring biodegradable and compostable materials are further supporting the rise of Kraft paper cups. The infrastructure supporting recycling and composting facilities in developed nations is a key driver for the increased adoption of these types of cups.
Single-Wall Paper Cup Product Innovations
Product innovations in the single-wall paper cup sector are primarily focused on enhancing sustainability, functionality, and user experience. Advancements in biodegradable and compostable coatings are a key trend, offering environmentally responsible alternatives to traditional plastic linings. New paperboard compositions are being developed to improve insulation properties for both hot and cold beverages, reducing the need for secondary sleeves. Additionally, enhanced printing technologies allow for vibrant, high-resolution custom branding, catering to the growing demand for personalized packaging. These innovations provide competitive advantages by meeting evolving consumer preferences and stricter environmental regulations.
Report Segmentation & Scope
This report meticulously segments the single-wall paper cup market across key applications and product types. The Application segmentation includes Online Sales and Offline Sales. The Online Sales segment encompasses cups utilized in food delivery platforms and e-commerce beverage sales, projected to reach a market size of over $2.5 billion by 2033 with a CAGR of approximately 8.2%. The Offline Sales segment covers cups for dine-in and takeaway services at physical establishments, estimated at over $6 billion by 2033 with a CAGR of around 5.8%.
The Types segmentation focuses on Kraft and Paper Board cups. The Kraft segment, characterized by its natural appearance and eco-friendly perception, is projected to grow at a CAGR of approximately 7.5%, reaching a market size of over $3.2 billion by 2033. The Paper Board segment, offering versatility and established performance, is expected to reach over $5.3 billion by 2033 with a CAGR of around 6.0%. The scope of this report covers market size, growth trends, key drivers, challenges, and competitive landscape for each of these segments.
Key Drivers of Single-Wall Paper Cup Growth
The single-wall paper cup market is propelled by several significant growth drivers. Rising environmental consciousness among consumers and stricter regulations against single-use plastics are compelling a shift towards sustainable packaging alternatives. The expansion of the food service industry, particularly the booming online food delivery sector, directly translates to increased demand for disposable cups. Technological advancements in paperboard manufacturing and coating technologies are leading to improved product performance and eco-friendly options. Furthermore, economic growth in emerging markets, coupled with increasing disposable incomes, is contributing to higher consumption of convenience beverages, thereby driving cup sales. The widespread adoption of branding and customization by businesses also fuels demand for visually appealing and unique paper cup designs.
Challenges in the Single-Wall Paper Cup Sector
Despite robust growth, the single-wall paper cup sector faces several challenges. Fluctuations in raw material prices, particularly for paper pulp, can impact production costs and profitability. Increasing regulatory scrutiny regarding the environmental impact of disposable packaging, even paper-based, necessitates continuous innovation in biodegradability and recyclability. Competition from reusable alternatives and consumer apathy towards responsible disposal can hinder market penetration. Supply chain disruptions, such as those experienced globally in recent years, can affect material availability and delivery timelines. Moreover, the cost-effectiveness of sustainable alternatives compared to conventional options remains a critical factor for widespread adoption, with potential price sensitivity among some consumer segments, estimated to impact market share by up to 10% if sustainable options are not cost-competitive.
Leading Players in the Single-Wall Paper Cup Market
- BioPak
- Go-Pak Group
- Simple Life Packaging
- Itterra
- Formacia Packaging
- Papperskopp
- Paper Cup Company
- Sowinpak
- TopCup
- LOKYO Foodpack
Key Developments in Single-Wall Paper Cup Sector
- 2023 Q4: BioPak launches a new range of fully compostable single-wall paper cups featuring an innovative plant-based lining, significantly reducing environmental footprint.
- 2024 Q1: Go-Pak Group announces strategic investment of $XX million to expand production capacity for sustainable paper cups, aiming to meet the growing demand in the UK and European markets.
- 2024 Q2: Simple Life Packaging introduces advanced, leak-proof paper cup designs with enhanced insulation for hot beverages, targeting the premium coffee market.
- 2024 Q3: Itterra invests in new digital printing technology, enabling on-demand customization of single-wall paper cups with intricate branding and logos.
- 2024 Q4: Formacia Packaging acquires a smaller regional competitor to strengthen its market presence and broaden its product portfolio of eco-friendly paper cups.
Strategic Single-Wall Paper Cup Market Outlook
The strategic outlook for the single-wall paper cup market is exceptionally positive, driven by a strong confluence of consumer demand for convenience and sustainability. Growth accelerators include the ongoing expansion of the online food delivery ecosystem and increasing global awareness of environmental issues, pushing for the adoption of eco-friendly alternatives. Manufacturers that prioritize innovation in biodegradable materials, invest in efficient production processes, and focus on robust supply chain management will be well-positioned to capture significant market share. Strategic partnerships with food service providers and e-commerce platforms will be crucial for deeper market penetration. The increasing regulatory push towards sustainable packaging further solidifies the long-term growth prospects for the single-wall paper cup market.
Single-Wall Paper Cup Segmentation
-
1. Application
- 1.1. Online Sales
- 1.2. Offline Sales
-
2. Types
- 2.1. Kraft
- 2.2. Paper Board
Single-Wall Paper Cup Segmentation By Geography
-
1. North America
- 1.1. United States
- 1.2. Canada
- 1.3. Mexico
-
2. South America
- 2.1. Brazil
- 2.2. Argentina
- 2.3. Rest of South America
-
3. Europe
- 3.1. United Kingdom
- 3.2. Germany
- 3.3. France
- 3.4. Italy
- 3.5. Spain
- 3.6. Russia
- 3.7. Benelux
- 3.8. Nordics
- 3.9. Rest of Europe
-
4. Middle East & Africa
- 4.1. Turkey
- 4.2. Israel
- 4.3. GCC
- 4.4. North Africa
- 4.5. South Africa
- 4.6. Rest of Middle East & Africa
-
5. Asia Pacific
- 5.1. China
- 5.2. India
- 5.3. Japan
- 5.4. South Korea
- 5.5. ASEAN
- 5.6. Oceania
- 5.7. Rest of Asia Pacific
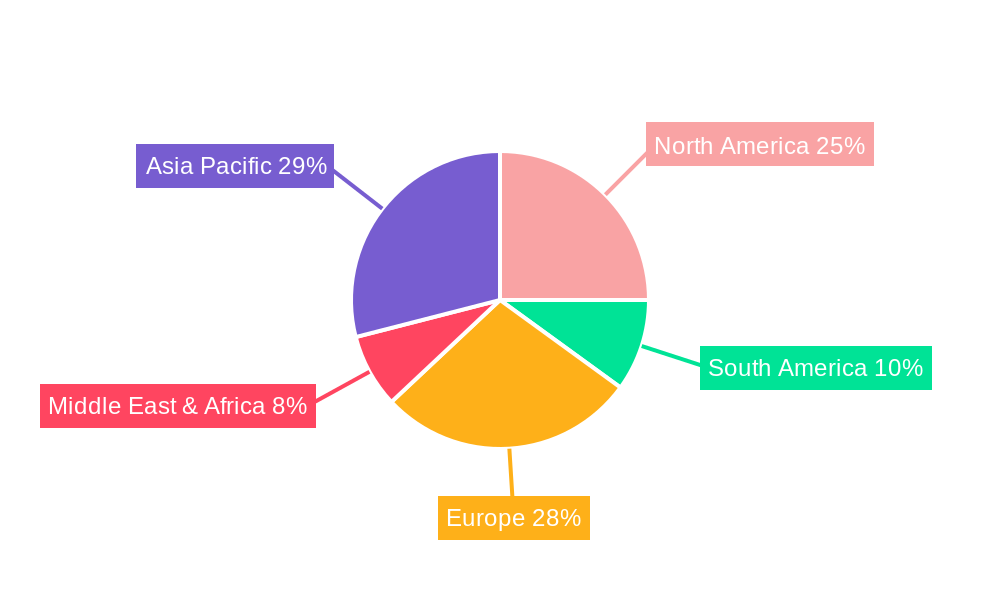
Single-Wall Paper Cup Regional Market Share
Geographic Coverage of Single-Wall Paper Cup
Single-Wall Paper Cup REPORT HIGHLIGHTS
| Aspects | Details |
|---|---|
| Study Period | 2020-2034 |
| Base Year | 2025 |
| Estimated Year | 2026 |
| Forecast Period | 2026-2034 |
| Historical Period | 2020-2025 |
| Growth Rate | CAGR of 4.42% from 2020-2034 |
| Segmentation |
|
Table of Contents
- 1. Introduction
- 1.1. Research Scope
- 1.2. Market Segmentation
- 1.3. Research Methodology
- 1.4. Definitions and Assumptions
- 2. Executive Summary
- 2.1. Introduction
- 3. Market Dynamics
- 3.1. Introduction
- 3.2. Market Drivers
- 3.3. Market Restrains
- 3.4. Market Trends
- 4. Market Factor Analysis
- 4.1. Porters Five Forces
- 4.2. Supply/Value Chain
- 4.3. PESTEL analysis
- 4.4. Market Entropy
- 4.5. Patent/Trademark Analysis
- 5. Global Single-Wall Paper Cup Analysis, Insights and Forecast, 2020-2032
- 5.1. Market Analysis, Insights and Forecast - by Application
- 5.1.1. Online Sales
- 5.1.2. Offline Sales
- 5.2. Market Analysis, Insights and Forecast - by Types
- 5.2.1. Kraft
- 5.2.2. Paper Board
- 5.3. Market Analysis, Insights and Forecast - by Region
- 5.3.1. North America
- 5.3.2. South America
- 5.3.3. Europe
- 5.3.4. Middle East & Africa
- 5.3.5. Asia Pacific
- 5.1. Market Analysis, Insights and Forecast - by Application
- 6. North America Single-Wall Paper Cup Analysis, Insights and Forecast, 2020-2032
- 6.1. Market Analysis, Insights and Forecast - by Application
- 6.1.1. Online Sales
- 6.1.2. Offline Sales
- 6.2. Market Analysis, Insights and Forecast - by Types
- 6.2.1. Kraft
- 6.2.2. Paper Board
- 6.1. Market Analysis, Insights and Forecast - by Application
- 7. South America Single-Wall Paper Cup Analysis, Insights and Forecast, 2020-2032
- 7.1. Market Analysis, Insights and Forecast - by Application
- 7.1.1. Online Sales
- 7.1.2. Offline Sales
- 7.2. Market Analysis, Insights and Forecast - by Types
- 7.2.1. Kraft
- 7.2.2. Paper Board
- 7.1. Market Analysis, Insights and Forecast - by Application
- 8. Europe Single-Wall Paper Cup Analysis, Insights and Forecast, 2020-2032
- 8.1. Market Analysis, Insights and Forecast - by Application
- 8.1.1. Online Sales
- 8.1.2. Offline Sales
- 8.2. Market Analysis, Insights and Forecast - by Types
- 8.2.1. Kraft
- 8.2.2. Paper Board
- 8.1. Market Analysis, Insights and Forecast - by Application
- 9. Middle East & Africa Single-Wall Paper Cup Analysis, Insights and Forecast, 2020-2032
- 9.1. Market Analysis, Insights and Forecast - by Application
- 9.1.1. Online Sales
- 9.1.2. Offline Sales
- 9.2. Market Analysis, Insights and Forecast - by Types
- 9.2.1. Kraft
- 9.2.2. Paper Board
- 9.1. Market Analysis, Insights and Forecast - by Application
- 10. Asia Pacific Single-Wall Paper Cup Analysis, Insights and Forecast, 2020-2032
- 10.1. Market Analysis, Insights and Forecast - by Application
- 10.1.1. Online Sales
- 10.1.2. Offline Sales
- 10.2. Market Analysis, Insights and Forecast - by Types
- 10.2.1. Kraft
- 10.2.2. Paper Board
- 10.1. Market Analysis, Insights and Forecast - by Application
- 11. Competitive Analysis
- 11.1. Global Market Share Analysis 2025
- 11.2. Company Profiles
- 11.2.1 BioPak
- 11.2.1.1. Overview
- 11.2.1.2. Products
- 11.2.1.3. SWOT Analysis
- 11.2.1.4. Recent Developments
- 11.2.1.5. Financials (Based on Availability)
- 11.2.2 Go-Pak Group
- 11.2.2.1. Overview
- 11.2.2.2. Products
- 11.2.2.3. SWOT Analysis
- 11.2.2.4. Recent Developments
- 11.2.2.5. Financials (Based on Availability)
- 11.2.3 Simple Life Packaging
- 11.2.3.1. Overview
- 11.2.3.2. Products
- 11.2.3.3. SWOT Analysis
- 11.2.3.4. Recent Developments
- 11.2.3.5. Financials (Based on Availability)
- 11.2.4 Itterra
- 11.2.4.1. Overview
- 11.2.4.2. Products
- 11.2.4.3. SWOT Analysis
- 11.2.4.4. Recent Developments
- 11.2.4.5. Financials (Based on Availability)
- 11.2.5 Formacia Packaging
- 11.2.5.1. Overview
- 11.2.5.2. Products
- 11.2.5.3. SWOT Analysis
- 11.2.5.4. Recent Developments
- 11.2.5.5. Financials (Based on Availability)
- 11.2.6 Papperskopp
- 11.2.6.1. Overview
- 11.2.6.2. Products
- 11.2.6.3. SWOT Analysis
- 11.2.6.4. Recent Developments
- 11.2.6.5. Financials (Based on Availability)
- 11.2.7 Paper Cup Company
- 11.2.7.1. Overview
- 11.2.7.2. Products
- 11.2.7.3. SWOT Analysis
- 11.2.7.4. Recent Developments
- 11.2.7.5. Financials (Based on Availability)
- 11.2.8 Sowinpak
- 11.2.8.1. Overview
- 11.2.8.2. Products
- 11.2.8.3. SWOT Analysis
- 11.2.8.4. Recent Developments
- 11.2.8.5. Financials (Based on Availability)
- 11.2.9 TopCup
- 11.2.9.1. Overview
- 11.2.9.2. Products
- 11.2.9.3. SWOT Analysis
- 11.2.9.4. Recent Developments
- 11.2.9.5. Financials (Based on Availability)
- 11.2.10 LOKYO Foodpack
- 11.2.10.1. Overview
- 11.2.10.2. Products
- 11.2.10.3. SWOT Analysis
- 11.2.10.4. Recent Developments
- 11.2.10.5. Financials (Based on Availability)
- 11.2.1 BioPak
List of Figures
- Figure 1: Global Single-Wall Paper Cup Revenue Breakdown (billion, %) by Region 2025 & 2033
- Figure 2: Global Single-Wall Paper Cup Volume Breakdown (K, %) by Region 2025 & 2033
- Figure 3: North America Single-Wall Paper Cup Revenue (billion), by Application 2025 & 2033
- Figure 4: North America Single-Wall Paper Cup Volume (K), by Application 2025 & 2033
- Figure 5: North America Single-Wall Paper Cup Revenue Share (%), by Application 2025 & 2033
- Figure 6: North America Single-Wall Paper Cup Volume Share (%), by Application 2025 & 2033
- Figure 7: North America Single-Wall Paper Cup Revenue (billion), by Types 2025 & 2033
- Figure 8: North America Single-Wall Paper Cup Volume (K), by Types 2025 & 2033
- Figure 9: North America Single-Wall Paper Cup Revenue Share (%), by Types 2025 & 2033
- Figure 10: North America Single-Wall Paper Cup Volume Share (%), by Types 2025 & 2033
- Figure 11: North America Single-Wall Paper Cup Revenue (billion), by Country 2025 & 2033
- Figure 12: North America Single-Wall Paper Cup Volume (K), by Country 2025 & 2033
- Figure 13: North America Single-Wall Paper Cup Revenue Share (%), by Country 2025 & 2033
- Figure 14: North America Single-Wall Paper Cup Volume Share (%), by Country 2025 & 2033
- Figure 15: South America Single-Wall Paper Cup Revenue (billion), by Application 2025 & 2033
- Figure 16: South America Single-Wall Paper Cup Volume (K), by Application 2025 & 2033
- Figure 17: South America Single-Wall Paper Cup Revenue Share (%), by Application 2025 & 2033
- Figure 18: South America Single-Wall Paper Cup Volume Share (%), by Application 2025 & 2033
- Figure 19: South America Single-Wall Paper Cup Revenue (billion), by Types 2025 & 2033
- Figure 20: South America Single-Wall Paper Cup Volume (K), by Types 2025 & 2033
- Figure 21: South America Single-Wall Paper Cup Revenue Share (%), by Types 2025 & 2033
- Figure 22: South America Single-Wall Paper Cup Volume Share (%), by Types 2025 & 2033
- Figure 23: South America Single-Wall Paper Cup Revenue (billion), by Country 2025 & 2033
- Figure 24: South America Single-Wall Paper Cup Volume (K), by Country 2025 & 2033
- Figure 25: South America Single-Wall Paper Cup Revenue Share (%), by Country 2025 & 2033
- Figure 26: South America Single-Wall Paper Cup Volume Share (%), by Country 2025 & 2033
- Figure 27: Europe Single-Wall Paper Cup Revenue (billion), by Application 2025 & 2033
- Figure 28: Europe Single-Wall Paper Cup Volume (K), by Application 2025 & 2033
- Figure 29: Europe Single-Wall Paper Cup Revenue Share (%), by Application 2025 & 2033
- Figure 30: Europe Single-Wall Paper Cup Volume Share (%), by Application 2025 & 2033
- Figure 31: Europe Single-Wall Paper Cup Revenue (billion), by Types 2025 & 2033
- Figure 32: Europe Single-Wall Paper Cup Volume (K), by Types 2025 & 2033
- Figure 33: Europe Single-Wall Paper Cup Revenue Share (%), by Types 2025 & 2033
- Figure 34: Europe Single-Wall Paper Cup Volume Share (%), by Types 2025 & 2033
- Figure 35: Europe Single-Wall Paper Cup Revenue (billion), by Country 2025 & 2033
- Figure 36: Europe Single-Wall Paper Cup Volume (K), by Country 2025 & 2033
- Figure 37: Europe Single-Wall Paper Cup Revenue Share (%), by Country 2025 & 2033
- Figure 38: Europe Single-Wall Paper Cup Volume Share (%), by Country 2025 & 2033
- Figure 39: Middle East & Africa Single-Wall Paper Cup Revenue (billion), by Application 2025 & 2033
- Figure 40: Middle East & Africa Single-Wall Paper Cup Volume (K), by Application 2025 & 2033
- Figure 41: Middle East & Africa Single-Wall Paper Cup Revenue Share (%), by Application 2025 & 2033
- Figure 42: Middle East & Africa Single-Wall Paper Cup Volume Share (%), by Application 2025 & 2033
- Figure 43: Middle East & Africa Single-Wall Paper Cup Revenue (billion), by Types 2025 & 2033
- Figure 44: Middle East & Africa Single-Wall Paper Cup Volume (K), by Types 2025 & 2033
- Figure 45: Middle East & Africa Single-Wall Paper Cup Revenue Share (%), by Types 2025 & 2033
- Figure 46: Middle East & Africa Single-Wall Paper Cup Volume Share (%), by Types 2025 & 2033
- Figure 47: Middle East & Africa Single-Wall Paper Cup Revenue (billion), by Country 2025 & 2033
- Figure 48: Middle East & Africa Single-Wall Paper Cup Volume (K), by Country 2025 & 2033
- Figure 49: Middle East & Africa Single-Wall Paper Cup Revenue Share (%), by Country 2025 & 2033
- Figure 50: Middle East & Africa Single-Wall Paper Cup Volume Share (%), by Country 2025 & 2033
- Figure 51: Asia Pacific Single-Wall Paper Cup Revenue (billion), by Application 2025 & 2033
- Figure 52: Asia Pacific Single-Wall Paper Cup Volume (K), by Application 2025 & 2033
- Figure 53: Asia Pacific Single-Wall Paper Cup Revenue Share (%), by Application 2025 & 2033
- Figure 54: Asia Pacific Single-Wall Paper Cup Volume Share (%), by Application 2025 & 2033
- Figure 55: Asia Pacific Single-Wall Paper Cup Revenue (billion), by Types 2025 & 2033
- Figure 56: Asia Pacific Single-Wall Paper Cup Volume (K), by Types 2025 & 2033
- Figure 57: Asia Pacific Single-Wall Paper Cup Revenue Share (%), by Types 2025 & 2033
- Figure 58: Asia Pacific Single-Wall Paper Cup Volume Share (%), by Types 2025 & 2033
- Figure 59: Asia Pacific Single-Wall Paper Cup Revenue (billion), by Country 2025 & 2033
- Figure 60: Asia Pacific Single-Wall Paper Cup Volume (K), by Country 2025 & 2033
- Figure 61: Asia Pacific Single-Wall Paper Cup Revenue Share (%), by Country 2025 & 2033
- Figure 62: Asia Pacific Single-Wall Paper Cup Volume Share (%), by Country 2025 & 2033
List of Tables
- Table 1: Global Single-Wall Paper Cup Revenue billion Forecast, by Application 2020 & 2033
- Table 2: Global Single-Wall Paper Cup Volume K Forecast, by Application 2020 & 2033
- Table 3: Global Single-Wall Paper Cup Revenue billion Forecast, by Types 2020 & 2033
- Table 4: Global Single-Wall Paper Cup Volume K Forecast, by Types 2020 & 2033
- Table 5: Global Single-Wall Paper Cup Revenue billion Forecast, by Region 2020 & 2033
- Table 6: Global Single-Wall Paper Cup Volume K Forecast, by Region 2020 & 2033
- Table 7: Global Single-Wall Paper Cup Revenue billion Forecast, by Application 2020 & 2033
- Table 8: Global Single-Wall Paper Cup Volume K Forecast, by Application 2020 & 2033
- Table 9: Global Single-Wall Paper Cup Revenue billion Forecast, by Types 2020 & 2033
- Table 10: Global Single-Wall Paper Cup Volume K Forecast, by Types 2020 & 2033
- Table 11: Global Single-Wall Paper Cup Revenue billion Forecast, by Country 2020 & 2033
- Table 12: Global Single-Wall Paper Cup Volume K Forecast, by Country 2020 & 2033
- Table 13: United States Single-Wall Paper Cup Revenue (billion) Forecast, by Application 2020 & 2033
- Table 14: United States Single-Wall Paper Cup Volume (K) Forecast, by Application 2020 & 2033
- Table 15: Canada Single-Wall Paper Cup Revenue (billion) Forecast, by Application 2020 & 2033
- Table 16: Canada Single-Wall Paper Cup Volume (K) Forecast, by Application 2020 & 2033
- Table 17: Mexico Single-Wall Paper Cup Revenue (billion) Forecast, by Application 2020 & 2033
- Table 18: Mexico Single-Wall Paper Cup Volume (K) Forecast, by Application 2020 & 2033
- Table 19: Global Single-Wall Paper Cup Revenue billion Forecast, by Application 2020 & 2033
- Table 20: Global Single-Wall Paper Cup Volume K Forecast, by Application 2020 & 2033
- Table 21: Global Single-Wall Paper Cup Revenue billion Forecast, by Types 2020 & 2033
- Table 22: Global Single-Wall Paper Cup Volume K Forecast, by Types 2020 & 2033
- Table 23: Global Single-Wall Paper Cup Revenue billion Forecast, by Country 2020 & 2033
- Table 24: Global Single-Wall Paper Cup Volume K Forecast, by Country 2020 & 2033
- Table 25: Brazil Single-Wall Paper Cup Revenue (billion) Forecast, by Application 2020 & 2033
- Table 26: Brazil Single-Wall Paper Cup Volume (K) Forecast, by Application 2020 & 2033
- Table 27: Argentina Single-Wall Paper Cup Revenue (billion) Forecast, by Application 2020 & 2033
- Table 28: Argentina Single-Wall Paper Cup Volume (K) Forecast, by Application 2020 & 2033
- Table 29: Rest of South America Single-Wall Paper Cup Revenue (billion) Forecast, by Application 2020 & 2033
- Table 30: Rest of South America Single-Wall Paper Cup Volume (K) Forecast, by Application 2020 & 2033
- Table 31: Global Single-Wall Paper Cup Revenue billion Forecast, by Application 2020 & 2033
- Table 32: Global Single-Wall Paper Cup Volume K Forecast, by Application 2020 & 2033
- Table 33: Global Single-Wall Paper Cup Revenue billion Forecast, by Types 2020 & 2033
- Table 34: Global Single-Wall Paper Cup Volume K Forecast, by Types 2020 & 2033
- Table 35: Global Single-Wall Paper Cup Revenue billion Forecast, by Country 2020 & 2033
- Table 36: Global Single-Wall Paper Cup Volume K Forecast, by Country 2020 & 2033
- Table 37: United Kingdom Single-Wall Paper Cup Revenue (billion) Forecast, by Application 2020 & 2033
- Table 38: United Kingdom Single-Wall Paper Cup Volume (K) Forecast, by Application 2020 & 2033
- Table 39: Germany Single-Wall Paper Cup Revenue (billion) Forecast, by Application 2020 & 2033
- Table 40: Germany Single-Wall Paper Cup Volume (K) Forecast, by Application 2020 & 2033
- Table 41: France Single-Wall Paper Cup Revenue (billion) Forecast, by Application 2020 & 2033
- Table 42: France Single-Wall Paper Cup Volume (K) Forecast, by Application 2020 & 2033
- Table 43: Italy Single-Wall Paper Cup Revenue (billion) Forecast, by Application 2020 & 2033
- Table 44: Italy Single-Wall Paper Cup Volume (K) Forecast, by Application 2020 & 2033
- Table 45: Spain Single-Wall Paper Cup Revenue (billion) Forecast, by Application 2020 & 2033
- Table 46: Spain Single-Wall Paper Cup Volume (K) Forecast, by Application 2020 & 2033
- Table 47: Russia Single-Wall Paper Cup Revenue (billion) Forecast, by Application 2020 & 2033
- Table 48: Russia Single-Wall Paper Cup Volume (K) Forecast, by Application 2020 & 2033
- Table 49: Benelux Single-Wall Paper Cup Revenue (billion) Forecast, by Application 2020 & 2033
- Table 50: Benelux Single-Wall Paper Cup Volume (K) Forecast, by Application 2020 & 2033
- Table 51: Nordics Single-Wall Paper Cup Revenue (billion) Forecast, by Application 2020 & 2033
- Table 52: Nordics Single-Wall Paper Cup Volume (K) Forecast, by Application 2020 & 2033
- Table 53: Rest of Europe Single-Wall Paper Cup Revenue (billion) Forecast, by Application 2020 & 2033
- Table 54: Rest of Europe Single-Wall Paper Cup Volume (K) Forecast, by Application 2020 & 2033
- Table 55: Global Single-Wall Paper Cup Revenue billion Forecast, by Application 2020 & 2033
- Table 56: Global Single-Wall Paper Cup Volume K Forecast, by Application 2020 & 2033
- Table 57: Global Single-Wall Paper Cup Revenue billion Forecast, by Types 2020 & 2033
- Table 58: Global Single-Wall Paper Cup Volume K Forecast, by Types 2020 & 2033
- Table 59: Global Single-Wall Paper Cup Revenue billion Forecast, by Country 2020 & 2033
- Table 60: Global Single-Wall Paper Cup Volume K Forecast, by Country 2020 & 2033
- Table 61: Turkey Single-Wall Paper Cup Revenue (billion) Forecast, by Application 2020 & 2033
- Table 62: Turkey Single-Wall Paper Cup Volume (K) Forecast, by Application 2020 & 2033
- Table 63: Israel Single-Wall Paper Cup Revenue (billion) Forecast, by Application 2020 & 2033
- Table 64: Israel Single-Wall Paper Cup Volume (K) Forecast, by Application 2020 & 2033
- Table 65: GCC Single-Wall Paper Cup Revenue (billion) Forecast, by Application 2020 & 2033
- Table 66: GCC Single-Wall Paper Cup Volume (K) Forecast, by Application 2020 & 2033
- Table 67: North Africa Single-Wall Paper Cup Revenue (billion) Forecast, by Application 2020 & 2033
- Table 68: North Africa Single-Wall Paper Cup Volume (K) Forecast, by Application 2020 & 2033
- Table 69: South Africa Single-Wall Paper Cup Revenue (billion) Forecast, by Application 2020 & 2033
- Table 70: South Africa Single-Wall Paper Cup Volume (K) Forecast, by Application 2020 & 2033
- Table 71: Rest of Middle East & Africa Single-Wall Paper Cup Revenue (billion) Forecast, by Application 2020 & 2033
- Table 72: Rest of Middle East & Africa Single-Wall Paper Cup Volume (K) Forecast, by Application 2020 & 2033
- Table 73: Global Single-Wall Paper Cup Revenue billion Forecast, by Application 2020 & 2033
- Table 74: Global Single-Wall Paper Cup Volume K Forecast, by Application 2020 & 2033
- Table 75: Global Single-Wall Paper Cup Revenue billion Forecast, by Types 2020 & 2033
- Table 76: Global Single-Wall Paper Cup Volume K Forecast, by Types 2020 & 2033
- Table 77: Global Single-Wall Paper Cup Revenue billion Forecast, by Country 2020 & 2033
- Table 78: Global Single-Wall Paper Cup Volume K Forecast, by Country 2020 & 2033
- Table 79: China Single-Wall Paper Cup Revenue (billion) Forecast, by Application 2020 & 2033
- Table 80: China Single-Wall Paper Cup Volume (K) Forecast, by Application 2020 & 2033
- Table 81: India Single-Wall Paper Cup Revenue (billion) Forecast, by Application 2020 & 2033
- Table 82: India Single-Wall Paper Cup Volume (K) Forecast, by Application 2020 & 2033
- Table 83: Japan Single-Wall Paper Cup Revenue (billion) Forecast, by Application 2020 & 2033
- Table 84: Japan Single-Wall Paper Cup Volume (K) Forecast, by Application 2020 & 2033
- Table 85: South Korea Single-Wall Paper Cup Revenue (billion) Forecast, by Application 2020 & 2033
- Table 86: South Korea Single-Wall Paper Cup Volume (K) Forecast, by Application 2020 & 2033
- Table 87: ASEAN Single-Wall Paper Cup Revenue (billion) Forecast, by Application 2020 & 2033
- Table 88: ASEAN Single-Wall Paper Cup Volume (K) Forecast, by Application 2020 & 2033
- Table 89: Oceania Single-Wall Paper Cup Revenue (billion) Forecast, by Application 2020 & 2033
- Table 90: Oceania Single-Wall Paper Cup Volume (K) Forecast, by Application 2020 & 2033
- Table 91: Rest of Asia Pacific Single-Wall Paper Cup Revenue (billion) Forecast, by Application 2020 & 2033
- Table 92: Rest of Asia Pacific Single-Wall Paper Cup Volume (K) Forecast, by Application 2020 & 2033
Frequently Asked Questions
1. What is the projected Compound Annual Growth Rate (CAGR) of the Single-Wall Paper Cup?
The projected CAGR is approximately 4.42%.
2. Which companies are prominent players in the Single-Wall Paper Cup?
Key companies in the market include BioPak, Go-Pak Group, Simple Life Packaging, Itterra, Formacia Packaging, Papperskopp, Paper Cup Company, Sowinpak, TopCup, LOKYO Foodpack.
3. What are the main segments of the Single-Wall Paper Cup?
The market segments include Application, Types.
4. Can you provide details about the market size?
The market size is estimated to be USD 11.52 billion as of 2022.
5. What are some drivers contributing to market growth?
N/A
6. What are the notable trends driving market growth?
N/A
7. Are there any restraints impacting market growth?
N/A
8. Can you provide examples of recent developments in the market?
N/A
9. What pricing options are available for accessing the report?
Pricing options include single-user, multi-user, and enterprise licenses priced at USD 3350.00, USD 5025.00, and USD 6700.00 respectively.
10. Is the market size provided in terms of value or volume?
The market size is provided in terms of value, measured in billion and volume, measured in K.
11. Are there any specific market keywords associated with the report?
Yes, the market keyword associated with the report is "Single-Wall Paper Cup," which aids in identifying and referencing the specific market segment covered.
12. How do I determine which pricing option suits my needs best?
The pricing options vary based on user requirements and access needs. Individual users may opt for single-user licenses, while businesses requiring broader access may choose multi-user or enterprise licenses for cost-effective access to the report.
13. Are there any additional resources or data provided in the Single-Wall Paper Cup report?
While the report offers comprehensive insights, it's advisable to review the specific contents or supplementary materials provided to ascertain if additional resources or data are available.
14. How can I stay updated on further developments or reports in the Single-Wall Paper Cup?
To stay informed about further developments, trends, and reports in the Single-Wall Paper Cup, consider subscribing to industry newsletters, following relevant companies and organizations, or regularly checking reputable industry news sources and publications.
Methodology
Step 1 - Identification of Relevant Samples Size from Population Database


Step 2 - Approaches for Defining Global Market Size (Value, Volume* & Price*)

Note*: In applicable scenarios
Step 3 - Data Sources
Primary Research
- Web Analytics
- Survey Reports
- Research Institute
- Latest Research Reports
- Opinion Leaders
Secondary Research
- Annual Reports
- White Paper
- Latest Press Release
- Industry Association
- Paid Database
- Investor Presentations

Step 4 - Data Triangulation
Involves using different sources of information in order to increase the validity of a study
These sources are likely to be stakeholders in a program - participants, other researchers, program staff, other community members, and so on.
Then we put all data in single framework & apply various statistical tools to find out the dynamic on the market.
During the analysis stage, feedback from the stakeholder groups would be compared to determine areas of agreement as well as areas of divergence