

Key Insights
The Silicon-28 market, a critical component in advanced technological applications, is poised for substantial expansion. This growth is primarily propelled by escalating demand from the semiconductor industry, where ultra-pure Silicon-28 is indispensable for manufacturing high-performance integrated circuits and advanced silicon wafers. Key growth catalysts include the widespread adoption of 5G technology, the increasing deployment of high-performance computing (HPC) systems, and the robust expansion of the global electronics sector. Emerging applications in quantum computing further contribute to market dynamism. The market is projected to reach a size of 76.97 million by the base year 2024, with an estimated Compound Annual Growth Rate (CAGR) of 10.9% through 2032. Market performance may be influenced by global economic conditions and rapid technological evolution.
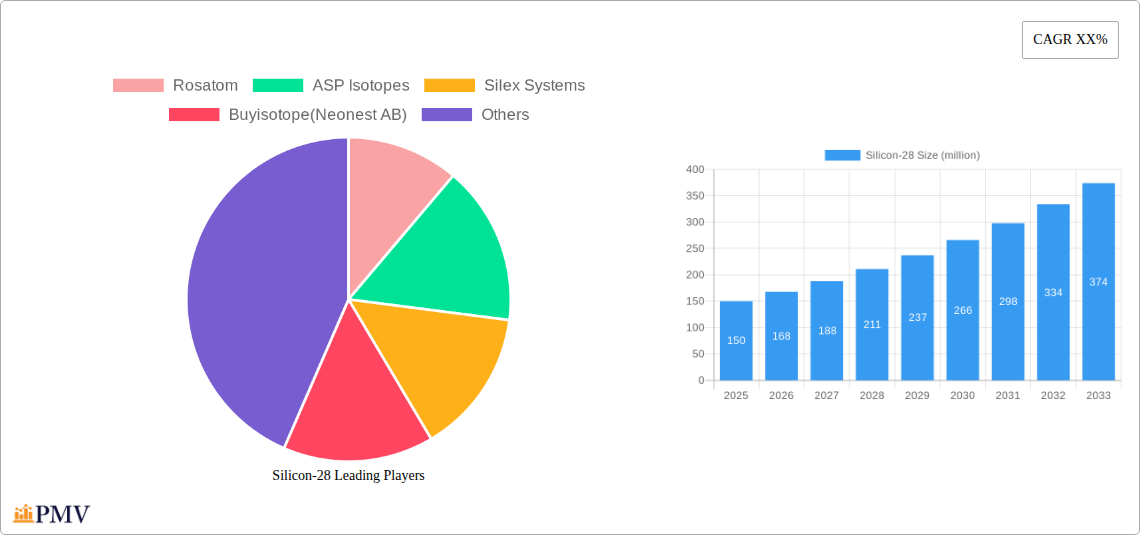
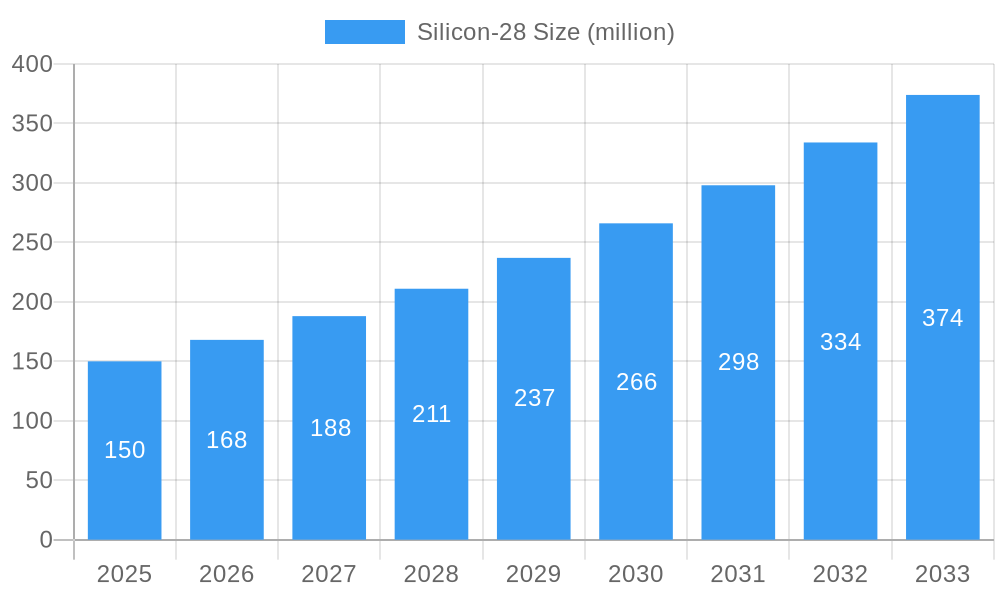
Silicon-28 Market Size (In Million)
The competitive landscape features prominent suppliers such as Rosatom, ASP Isotopes, Silex Systems, and Buyisotope (Neonest AB), who are actively engaged in enhancing production technologies to improve purity, efficiency, and cost-effectiveness. Despite challenges such as high production costs and complex isotope separation processes, ongoing technological innovations are mitigating these restraints. The market is segmented by application, purity level, and geographic region. North America and Europe are anticipated to lead market share due to the concentrated presence of semiconductor manufacturing and research facilities. Future growth hinges on advancements in isotope separation technology, sustained demand from the electronics industry, and the successful commercialization of quantum computing applications. The forecast period (2024-2032) offers significant opportunities for market participants to strengthen their positions and for new entrants to capitalize on the growing demand for high-purity Silicon-28.
Silicon-28 Company Market Share
Silicon-28 Market Report: 2019-2033
This comprehensive report provides an in-depth analysis of the Silicon-28 market, offering invaluable insights for businesses and investors navigating this dynamic landscape. With a study period spanning 2019-2033, a base year of 2025, and an estimated year of 2025, this report projects market trends through 2033, utilizing historical data from 2019-2024. The report examines market structure, competitive dynamics, industry trends, leading players, and future growth opportunities, forecasting substantial market expansion within the next decade. Expected values are presented for several metrics; in cases where specific figures are unavailable, estimates are provided.
Silicon-28 Market Structure & Competitive Dynamics
The Silicon-28 market exhibits a moderately concentrated structure, with several key players holding significant market share. While exact figures for 2025 are still being compiled (estimated at xx million USD), preliminary analysis suggests Rosatom, ASP Isotopes, Silex Systems, and Buyisotope (Neonest AB) command a considerable portion of the market. The market share distribution is dynamic, influenced by ongoing innovation, technological advancements, and strategic mergers and acquisitions (M&A) activities.
- Market Concentration: The Herfindahl-Hirschman Index (HHI) is estimated to be around xx, indicating a moderately concentrated market.
- Innovation Ecosystems: Significant R&D investment drives innovation, particularly in purification techniques and applications in specific industries. Collaborative partnerships between research institutions and commercial entities are growing.
- Regulatory Frameworks: Regulatory compliance concerning material handling and radioactive isotopes varies across regions, impacting market access and operational costs. Stringent safety protocols significantly influence business strategies.
- Product Substitutes: While direct substitutes for Silicon-28 are limited, alternative materials or processes might be considered for certain applications, affecting market demand.
- End-User Trends: Growing demand from semiconductor manufacturing and specific niche applications (e.g., medical isotopes) drives market expansion.
- M&A Activities: The past five years have seen xx million USD in M&A activity within the Silicon-28 sector, primarily focused on strengthening supply chains and expanding product portfolios.
Silicon-28 Industry Trends & Insights
The Silicon-28 market is experiencing robust growth, fueled by several key factors. Technological advancements in purification and enrichment methods are enabling cost reductions and increased purity levels, thereby expanding potential applications. The Compound Annual Growth Rate (CAGR) from 2025 to 2033 is projected at xx%, driving market value to an estimated xx million USD by 2033. This growth is underpinned by increasing demand from the semiconductor industry, which accounts for a significant portion of the market. Furthermore, the growing adoption of Silicon-28 in specific niche applications such as medical isotopes and specialized research is boosting market penetration rates. Competitive dynamics are intense, with companies vying for market leadership by improving product quality, optimizing production processes, and developing innovative applications. Market penetration of Silicon-28 in several key applications is predicted to reach xx% by 2033.
Dominant Markets & Segments in Silicon-28
The North American market currently holds a dominant position in the global Silicon-28 market, largely driven by significant investment in the semiconductor industry and robust technological capabilities within the region. This dominance is primarily concentrated in the United States, due to its strong manufacturing sector and leading role in advanced semiconductor technology.
- Key Drivers in North America:
- Robust semiconductor manufacturing sector.
- Favorable government policies promoting technological advancement.
- Extensive research and development infrastructure.
- High capital investment in technological infrastructure.
The Asian market, particularly in regions like East Asia, is anticipated to witness substantial growth over the forecast period, driven by a rising demand for semiconductors from the electronics industry and ongoing industrial expansion.
Silicon-28 Product Innovations
Recent innovations in Silicon-28 production focus on improving purity levels and enhancing efficiency through advanced isotope separation techniques. This has resulted in cost reductions, increased availability, and the expansion of applications in various industries. New purification technologies offer higher yields and reduced energy consumption, while improvements in handling and transportation enhance safety and efficiency. These innovations improve the competitive advantage of leading players, while driving market expansion into newer sectors.
Report Segmentation & Scope
This report segments the Silicon-28 market based on several key factors, including purity level, application, and geographic region. Each segment demonstrates varying growth rates and competitive dynamics. The high-purity segment is expected to show the fastest growth, while the semiconductor application dominates by market size. Regional segments are analyzed based on their unique market characteristics and growth drivers. The report offers detailed insights into each segment, including its market size, growth projections, and competitive landscape.
Key Drivers of Silicon-28 Growth
The Silicon-28 market’s growth is propelled by several key factors. The burgeoning semiconductor industry's requirement for ultra-pure silicon is a major driver, demanding high-quality Silicon-28 for enhanced device performance. Government incentives and investments in research and development further contribute to market expansion. Additionally, increasing adoption in niche applications such as medical isotopes and specialized research is fueling growth. Technological advancements in purification processes are also playing a critical role, driving down costs and improving efficiency.
Challenges in the Silicon-28 Sector
Challenges include the high cost of production, particularly for achieving ultra-high purity levels, and the complex regulatory requirements surrounding the handling and transportation of radioactive materials. Supply chain disruptions and potential geopolitical risks also pose significant challenges. The intense competitive landscape requires companies to continuously innovate to maintain a competitive edge. These factors constrain market growth and profitability, impacting overall market expansion.
Leading Players in the Silicon-28 Market
- Rosatom
- ASP Isotopes
- Silex Systems
- Buyisotope (Neonest AB)
Key Developments in Silicon-28 Sector
- 2022 Q3: Silex Systems announced advancements in their separation technology, improving efficiency and purity.
- 2023 Q1: Rosatom initiated a new production facility expansion to meet growing demand.
- 2024 Q2: A significant R&D partnership between ASP Isotopes and a leading university was announced, focusing on next-generation purification technologies.
Strategic Silicon-28 Market Outlook
The Silicon-28 market is poised for significant growth over the next decade, driven by technological advancements, expanding applications, and favorable regulatory environments in key regions. Strategic opportunities exist for companies that can optimize production processes, enhance product purity, and effectively navigate the regulatory landscape. Companies focusing on innovation and strategic partnerships will be best positioned to capture the substantial market potential. The expanding semiconductor industry, coupled with the emergence of new applications, ensures strong future growth prospects.
Silicon-28 Segmentation
-
1. Application
- 1.1. Quantum Computers
- 1.2. Photovoltaic Cells
-
2. Types
- 2.1. Purity: 3N
- 2.2. Purity: 4N
- 2.3. Purity: >4N
Silicon-28 Segmentation By Geography
-
1. North America
- 1.1. United States
- 1.2. Canada
- 1.3. Mexico
-
2. South America
- 2.1. Brazil
- 2.2. Argentina
- 2.3. Rest of South America
-
3. Europe
- 3.1. United Kingdom
- 3.2. Germany
- 3.3. France
- 3.4. Italy
- 3.5. Spain
- 3.6. Russia
- 3.7. Benelux
- 3.8. Nordics
- 3.9. Rest of Europe
-
4. Middle East & Africa
- 4.1. Turkey
- 4.2. Israel
- 4.3. GCC
- 4.4. North Africa
- 4.5. South Africa
- 4.6. Rest of Middle East & Africa
-
5. Asia Pacific
- 5.1. China
- 5.2. India
- 5.3. Japan
- 5.4. South Korea
- 5.5. ASEAN
- 5.6. Oceania
- 5.7. Rest of Asia Pacific
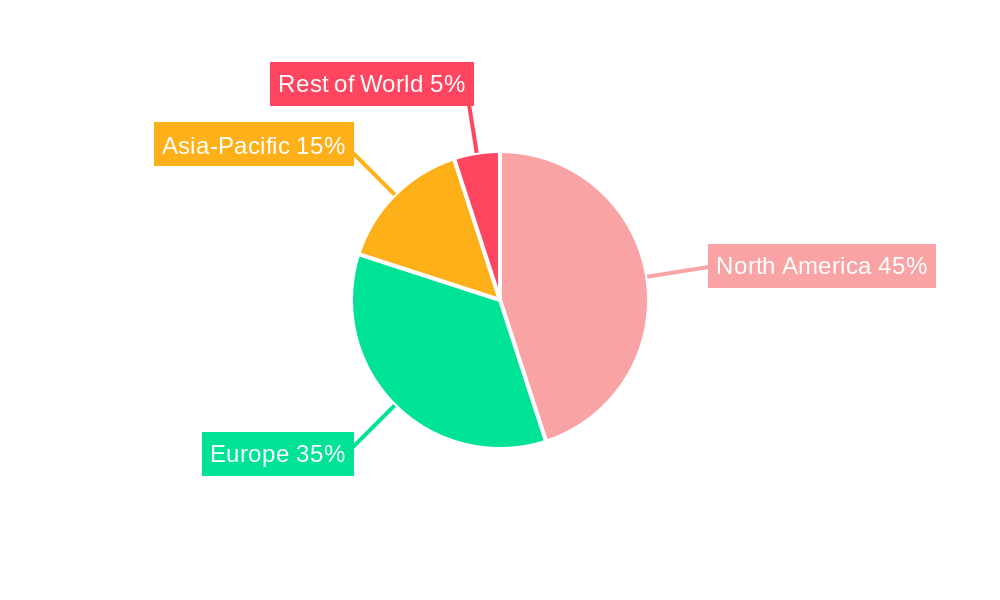
Silicon-28 Regional Market Share
Geographic Coverage of Silicon-28
Silicon-28 REPORT HIGHLIGHTS
| Aspects | Details |
|---|---|
| Study Period | 2020-2034 |
| Base Year | 2025 |
| Estimated Year | 2026 |
| Forecast Period | 2026-2034 |
| Historical Period | 2020-2025 |
| Growth Rate | CAGR of 10.9% from 2020-2034 |
| Segmentation |
|
Table of Contents
- 1. Introduction
- 1.1. Research Scope
- 1.2. Market Segmentation
- 1.3. Research Objective
- 1.4. Definitions and Assumptions
- 2. Executive Summary
- 2.1. Market Snapshot
- 3. Market Dynamics
- 3.1. Market Drivers
- 3.2. Market Restrains
- 3.3. Market Trends
- 3.4. Market Opportunities
- 4. Market Factor Analysis
- 4.1. Porters Five Forces
- 4.1.1. Bargaining Power of Suppliers
- 4.1.2. Bargaining Power of Buyers
- 4.1.3. Threat of New Entrants
- 4.1.4. Threat of Substitutes
- 4.1.5. Competitive Rivalry
- 4.2. PESTEL analysis
- 4.3. BCG Analysis
- 4.3.1. Stars (High Growth, High Market Share)
- 4.3.2. Cash Cows (Low Growth, High Market Share)
- 4.3.3. Question Mark (High Growth, Low Market Share)
- 4.3.4. Dogs (Low Growth, Low Market Share)
- 4.4. Ansoff Matrix Analysis
- 4.5. Supply Chain Analysis
- 4.6. Regulatory Landscape
- 4.7. Current Market Potential and Opportunity Assessment (TAM–SAM–SOM Framework)
- 4.8. PMV Analyst Note
- 4.1. Porters Five Forces
- 5. Market Analysis, Insights and Forecast 2021-2033
- 5.1. Market Analysis, Insights and Forecast - by Application
- 5.1.1. Quantum Computers
- 5.1.2. Photovoltaic Cells
- 5.2. Market Analysis, Insights and Forecast - by Types
- 5.2.1. Purity: 3N
- 5.2.2. Purity: 4N
- 5.2.3. Purity: >4N
- 5.3. Market Analysis, Insights and Forecast - by Region
- 5.3.1. North America
- 5.3.2. South America
- 5.3.3. Europe
- 5.3.4. Middle East & Africa
- 5.3.5. Asia Pacific
- 5.1. Market Analysis, Insights and Forecast - by Application
- 6. Global Silicon-28 Analysis, Insights and Forecast, 2021-2033
- 6.1. Market Analysis, Insights and Forecast - by Application
- 6.1.1. Quantum Computers
- 6.1.2. Photovoltaic Cells
- 6.2. Market Analysis, Insights and Forecast - by Types
- 6.2.1. Purity: 3N
- 6.2.2. Purity: 4N
- 6.2.3. Purity: >4N
- 6.1. Market Analysis, Insights and Forecast - by Application
- 7. North America Silicon-28 Analysis, Insights and Forecast, 2020-2032
- 7.1. Market Analysis, Insights and Forecast - by Application
- 7.1.1. Quantum Computers
- 7.1.2. Photovoltaic Cells
- 7.2. Market Analysis, Insights and Forecast - by Types
- 7.2.1. Purity: 3N
- 7.2.2. Purity: 4N
- 7.2.3. Purity: >4N
- 7.1. Market Analysis, Insights and Forecast - by Application
- 8. South America Silicon-28 Analysis, Insights and Forecast, 2020-2032
- 8.1. Market Analysis, Insights and Forecast - by Application
- 8.1.1. Quantum Computers
- 8.1.2. Photovoltaic Cells
- 8.2. Market Analysis, Insights and Forecast - by Types
- 8.2.1. Purity: 3N
- 8.2.2. Purity: 4N
- 8.2.3. Purity: >4N
- 8.1. Market Analysis, Insights and Forecast - by Application
- 9. Europe Silicon-28 Analysis, Insights and Forecast, 2020-2032
- 9.1. Market Analysis, Insights and Forecast - by Application
- 9.1.1. Quantum Computers
- 9.1.2. Photovoltaic Cells
- 9.2. Market Analysis, Insights and Forecast - by Types
- 9.2.1. Purity: 3N
- 9.2.2. Purity: 4N
- 9.2.3. Purity: >4N
- 9.1. Market Analysis, Insights and Forecast - by Application
- 10. Middle East & Africa Silicon-28 Analysis, Insights and Forecast, 2020-2032
- 10.1. Market Analysis, Insights and Forecast - by Application
- 10.1.1. Quantum Computers
- 10.1.2. Photovoltaic Cells
- 10.2. Market Analysis, Insights and Forecast - by Types
- 10.2.1. Purity: 3N
- 10.2.2. Purity: 4N
- 10.2.3. Purity: >4N
- 10.1. Market Analysis, Insights and Forecast - by Application
- 11. Asia Pacific Silicon-28 Analysis, Insights and Forecast, 2020-2032
- 11.1. Market Analysis, Insights and Forecast - by Application
- 11.1.1. Quantum Computers
- 11.1.2. Photovoltaic Cells
- 11.2. Market Analysis, Insights and Forecast - by Types
- 11.2.1. Purity: 3N
- 11.2.2. Purity: 4N
- 11.2.3. Purity: >4N
- 11.1. Market Analysis, Insights and Forecast - by Application
- 12. Competitive Analysis
- 12.1. Company Profiles
- 12.1.1 Rosatom
- 12.1.1.1. Company Overview
- 12.1.1.2. Products
- 12.1.1.3. Company Financials
- 12.1.1.4. SWOT Analysis
- 12.1.2 ASP Isotopes
- 12.1.2.1. Company Overview
- 12.1.2.2. Products
- 12.1.2.3. Company Financials
- 12.1.2.4. SWOT Analysis
- 12.1.3 Silex Systems
- 12.1.3.1. Company Overview
- 12.1.3.2. Products
- 12.1.3.3. Company Financials
- 12.1.3.4. SWOT Analysis
- 12.1.4 Buyisotope(Neonest AB)
- 12.1.4.1. Company Overview
- 12.1.4.2. Products
- 12.1.4.3. Company Financials
- 12.1.4.4. SWOT Analysis
- 12.1.1 Rosatom
- 12.2. Market Entropy
- 12.2.1 Company's Key Areas Served
- 12.2.2 Recent Developments
- 12.3. Company Market Share Analysis 2025
- 12.3.1 Top 5 Companies Market Share Analysis
- 12.3.2 Top 3 Companies Market Share Analysis
- 12.4. List of Potential Customers
- 13. Research Methodology
List of Figures
- Figure 1: Global Silicon-28 Revenue Breakdown (million, %) by Region 2025 & 2033
- Figure 2: North America Silicon-28 Revenue (million), by Application 2025 & 2033
- Figure 3: North America Silicon-28 Revenue Share (%), by Application 2025 & 2033
- Figure 4: North America Silicon-28 Revenue (million), by Types 2025 & 2033
- Figure 5: North America Silicon-28 Revenue Share (%), by Types 2025 & 2033
- Figure 6: North America Silicon-28 Revenue (million), by Country 2025 & 2033
- Figure 7: North America Silicon-28 Revenue Share (%), by Country 2025 & 2033
- Figure 8: South America Silicon-28 Revenue (million), by Application 2025 & 2033
- Figure 9: South America Silicon-28 Revenue Share (%), by Application 2025 & 2033
- Figure 10: South America Silicon-28 Revenue (million), by Types 2025 & 2033
- Figure 11: South America Silicon-28 Revenue Share (%), by Types 2025 & 2033
- Figure 12: South America Silicon-28 Revenue (million), by Country 2025 & 2033
- Figure 13: South America Silicon-28 Revenue Share (%), by Country 2025 & 2033
- Figure 14: Europe Silicon-28 Revenue (million), by Application 2025 & 2033
- Figure 15: Europe Silicon-28 Revenue Share (%), by Application 2025 & 2033
- Figure 16: Europe Silicon-28 Revenue (million), by Types 2025 & 2033
- Figure 17: Europe Silicon-28 Revenue Share (%), by Types 2025 & 2033
- Figure 18: Europe Silicon-28 Revenue (million), by Country 2025 & 2033
- Figure 19: Europe Silicon-28 Revenue Share (%), by Country 2025 & 2033
- Figure 20: Middle East & Africa Silicon-28 Revenue (million), by Application 2025 & 2033
- Figure 21: Middle East & Africa Silicon-28 Revenue Share (%), by Application 2025 & 2033
- Figure 22: Middle East & Africa Silicon-28 Revenue (million), by Types 2025 & 2033
- Figure 23: Middle East & Africa Silicon-28 Revenue Share (%), by Types 2025 & 2033
- Figure 24: Middle East & Africa Silicon-28 Revenue (million), by Country 2025 & 2033
- Figure 25: Middle East & Africa Silicon-28 Revenue Share (%), by Country 2025 & 2033
- Figure 26: Asia Pacific Silicon-28 Revenue (million), by Application 2025 & 2033
- Figure 27: Asia Pacific Silicon-28 Revenue Share (%), by Application 2025 & 2033
- Figure 28: Asia Pacific Silicon-28 Revenue (million), by Types 2025 & 2033
- Figure 29: Asia Pacific Silicon-28 Revenue Share (%), by Types 2025 & 2033
- Figure 30: Asia Pacific Silicon-28 Revenue (million), by Country 2025 & 2033
- Figure 31: Asia Pacific Silicon-28 Revenue Share (%), by Country 2025 & 2033
List of Tables
- Table 1: Global Silicon-28 Revenue million Forecast, by Application 2020 & 2033
- Table 2: Global Silicon-28 Revenue million Forecast, by Types 2020 & 2033
- Table 3: Global Silicon-28 Revenue million Forecast, by Region 2020 & 2033
- Table 4: Global Silicon-28 Revenue million Forecast, by Application 2020 & 2033
- Table 5: Global Silicon-28 Revenue million Forecast, by Types 2020 & 2033
- Table 6: Global Silicon-28 Revenue million Forecast, by Country 2020 & 2033
- Table 7: United States Silicon-28 Revenue (million) Forecast, by Application 2020 & 2033
- Table 8: Canada Silicon-28 Revenue (million) Forecast, by Application 2020 & 2033
- Table 9: Mexico Silicon-28 Revenue (million) Forecast, by Application 2020 & 2033
- Table 10: Global Silicon-28 Revenue million Forecast, by Application 2020 & 2033
- Table 11: Global Silicon-28 Revenue million Forecast, by Types 2020 & 2033
- Table 12: Global Silicon-28 Revenue million Forecast, by Country 2020 & 2033
- Table 13: Brazil Silicon-28 Revenue (million) Forecast, by Application 2020 & 2033
- Table 14: Argentina Silicon-28 Revenue (million) Forecast, by Application 2020 & 2033
- Table 15: Rest of South America Silicon-28 Revenue (million) Forecast, by Application 2020 & 2033
- Table 16: Global Silicon-28 Revenue million Forecast, by Application 2020 & 2033
- Table 17: Global Silicon-28 Revenue million Forecast, by Types 2020 & 2033
- Table 18: Global Silicon-28 Revenue million Forecast, by Country 2020 & 2033
- Table 19: United Kingdom Silicon-28 Revenue (million) Forecast, by Application 2020 & 2033
- Table 20: Germany Silicon-28 Revenue (million) Forecast, by Application 2020 & 2033
- Table 21: France Silicon-28 Revenue (million) Forecast, by Application 2020 & 2033
- Table 22: Italy Silicon-28 Revenue (million) Forecast, by Application 2020 & 2033
- Table 23: Spain Silicon-28 Revenue (million) Forecast, by Application 2020 & 2033
- Table 24: Russia Silicon-28 Revenue (million) Forecast, by Application 2020 & 2033
- Table 25: Benelux Silicon-28 Revenue (million) Forecast, by Application 2020 & 2033
- Table 26: Nordics Silicon-28 Revenue (million) Forecast, by Application 2020 & 2033
- Table 27: Rest of Europe Silicon-28 Revenue (million) Forecast, by Application 2020 & 2033
- Table 28: Global Silicon-28 Revenue million Forecast, by Application 2020 & 2033
- Table 29: Global Silicon-28 Revenue million Forecast, by Types 2020 & 2033
- Table 30: Global Silicon-28 Revenue million Forecast, by Country 2020 & 2033
- Table 31: Turkey Silicon-28 Revenue (million) Forecast, by Application 2020 & 2033
- Table 32: Israel Silicon-28 Revenue (million) Forecast, by Application 2020 & 2033
- Table 33: GCC Silicon-28 Revenue (million) Forecast, by Application 2020 & 2033
- Table 34: North Africa Silicon-28 Revenue (million) Forecast, by Application 2020 & 2033
- Table 35: South Africa Silicon-28 Revenue (million) Forecast, by Application 2020 & 2033
- Table 36: Rest of Middle East & Africa Silicon-28 Revenue (million) Forecast, by Application 2020 & 2033
- Table 37: Global Silicon-28 Revenue million Forecast, by Application 2020 & 2033
- Table 38: Global Silicon-28 Revenue million Forecast, by Types 2020 & 2033
- Table 39: Global Silicon-28 Revenue million Forecast, by Country 2020 & 2033
- Table 40: China Silicon-28 Revenue (million) Forecast, by Application 2020 & 2033
- Table 41: India Silicon-28 Revenue (million) Forecast, by Application 2020 & 2033
- Table 42: Japan Silicon-28 Revenue (million) Forecast, by Application 2020 & 2033
- Table 43: South Korea Silicon-28 Revenue (million) Forecast, by Application 2020 & 2033
- Table 44: ASEAN Silicon-28 Revenue (million) Forecast, by Application 2020 & 2033
- Table 45: Oceania Silicon-28 Revenue (million) Forecast, by Application 2020 & 2033
- Table 46: Rest of Asia Pacific Silicon-28 Revenue (million) Forecast, by Application 2020 & 2033
Frequently Asked Questions
1. What is the projected Compound Annual Growth Rate (CAGR) of the Silicon-28?
The projected CAGR is approximately 10.9%.
2. Which companies are prominent players in the Silicon-28?
Key companies in the market include Rosatom, ASP Isotopes, Silex Systems, Buyisotope(Neonest AB).
3. What are the main segments of the Silicon-28?
The market segments include Application, Types.
4. Can you provide details about the market size?
The market size is estimated to be USD 76.97 million as of 2022.
5. What are some drivers contributing to market growth?
N/A
6. What are the notable trends driving market growth?
N/A
7. Are there any restraints impacting market growth?
N/A
8. Can you provide examples of recent developments in the market?
N/A
9. What pricing options are available for accessing the report?
Pricing options include single-user, multi-user, and enterprise licenses priced at USD 2900.00, USD 4350.00, and USD 5800.00 respectively.
10. Is the market size provided in terms of value or volume?
The market size is provided in terms of value, measured in million.
11. Are there any specific market keywords associated with the report?
Yes, the market keyword associated with the report is "Silicon-28," which aids in identifying and referencing the specific market segment covered.
12. How do I determine which pricing option suits my needs best?
The pricing options vary based on user requirements and access needs. Individual users may opt for single-user licenses, while businesses requiring broader access may choose multi-user or enterprise licenses for cost-effective access to the report.
13. Are there any additional resources or data provided in the Silicon-28 report?
While the report offers comprehensive insights, it's advisable to review the specific contents or supplementary materials provided to ascertain if additional resources or data are available.
14. How can I stay updated on further developments or reports in the Silicon-28?
To stay informed about further developments, trends, and reports in the Silicon-28, consider subscribing to industry newsletters, following relevant companies and organizations, or regularly checking reputable industry news sources and publications.
Methodology
Step 1 - Identification of Relevant Samples Size from Population Database


Step 2 - Approaches for Defining Global Market Size (Value, Volume* & Price*)

Note*: In applicable scenarios
Step 3 - Data Sources
Primary Research
- Web Analytics
- Survey Reports
- Research Institute
- Latest Research Reports
- Opinion Leaders
Secondary Research
- Annual Reports
- White Paper
- Latest Press Release
- Industry Association
- Paid Database
- Investor Presentations

Step 4 - Data Triangulation
Involves using different sources of information in order to increase the validity of a study
These sources are likely to be stakeholders in a program - participants, other researchers, program staff, other community members, and so on.
Then we put all data in single framework & apply various statistical tools to find out the dynamic on the market.
During the analysis stage, feedback from the stakeholder groups would be compared to determine areas of agreement as well as areas of divergence