
Key Insights
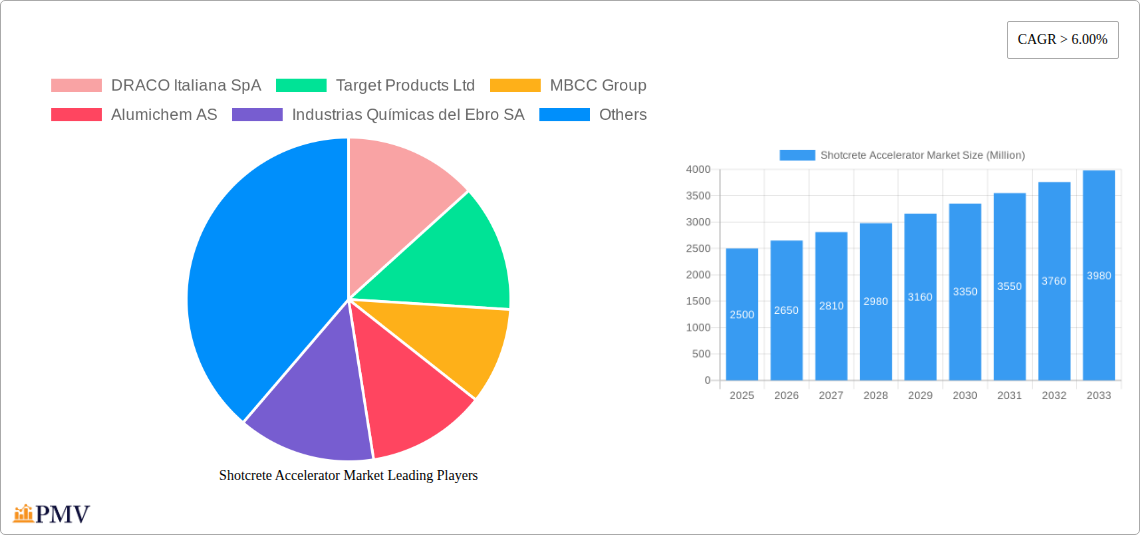
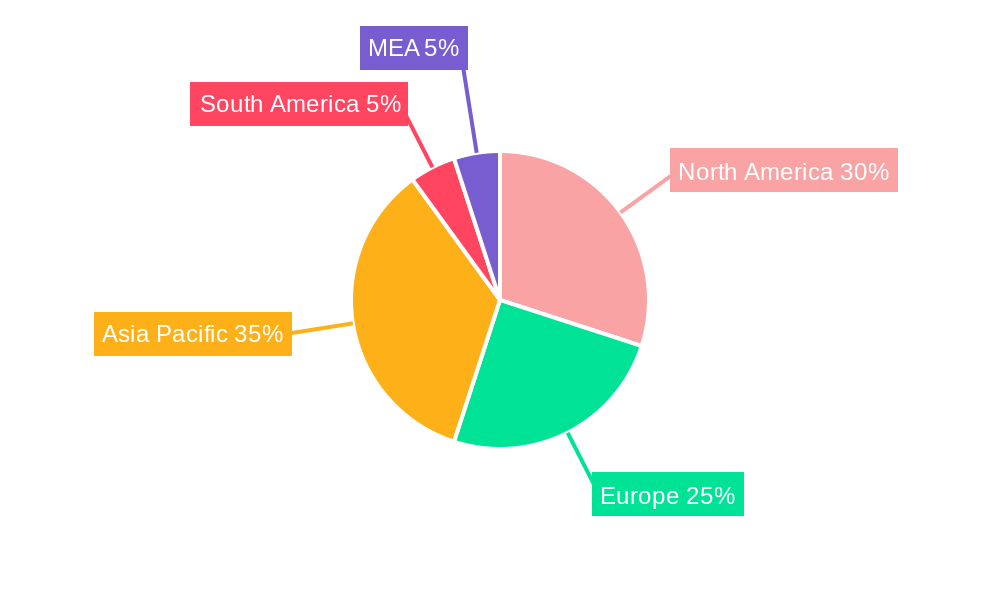
The global shotcrete accelerator market is experiencing robust growth, driven by the expanding construction and infrastructure sectors, particularly in developing economies. A compound annual growth rate (CAGR) exceeding 6% from 2019 to 2024 indicates a significant upward trajectory. This growth is fueled by several factors, including the increasing demand for high-speed construction projects, the rising adoption of shotcrete in mining operations for ground support and stabilization, and the growing preference for sustainable construction practices where shotcrete accelerators play a vital role in reducing material consumption and project timelines. The market is segmented by application (construction & infrastructure, mining, other), state (liquid, powder), mixing process (wet, dry), and type (alkali-free, alkaline aluminate-based, alkaline silicate-based, other). The construction and infrastructure segment currently holds the largest market share, driven by large-scale infrastructure projects globally. However, the mining segment is poised for significant growth due to increasing mining activities and the inherent need for efficient and robust ground support solutions in underground mining operations. Regional growth is expected to be diverse, with Asia-Pacific and North America showing strong performance due to robust infrastructure development and mining activities. While the market faces challenges such as fluctuating raw material prices and stringent environmental regulations, the overall outlook remains positive, driven by the continued expansion of construction and mining activities. Leading players like Sika AG, MBCC Group, and DRACO Italiana SpA are investing heavily in research and development to introduce innovative and eco-friendly shotcrete accelerators, further solidifying market growth.
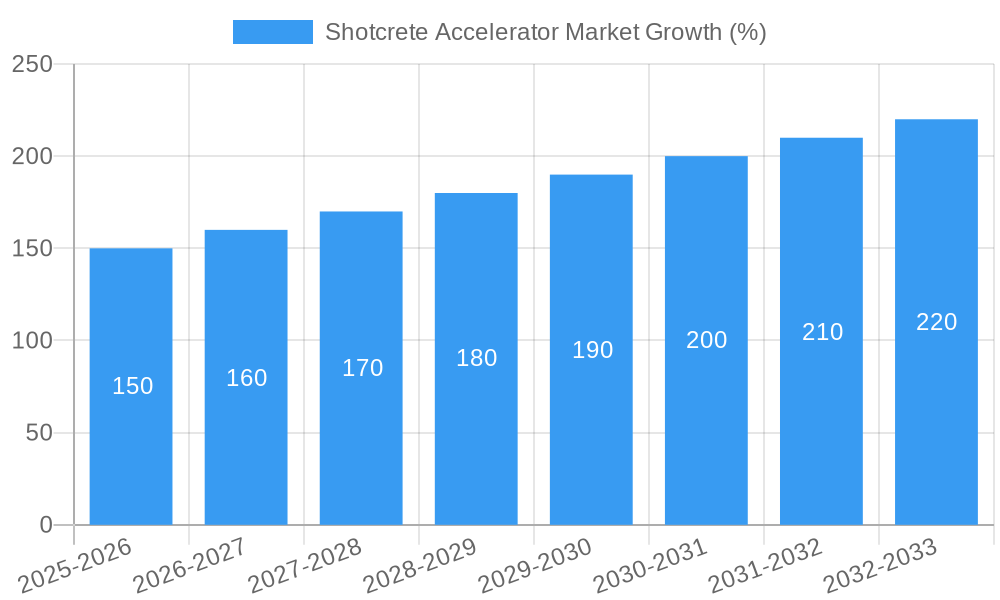
The forecast period (2025-2033) anticipates continued market expansion, with a projected market size exceeding the current estimations based on the sustained CAGR. Liquid shotcrete accelerators are currently the dominant type, but powder-based accelerators are gaining traction due to their ease of handling and transportation. The wet mixing process remains the most prevalent method, but dry-mix applications are showing promising growth, especially in areas with limited water resources. Alkali-free shotcrete accelerators are increasingly favored due to their environmental benefits and reduced corrosion risks. Competitive landscape is characterized by both large multinational corporations and smaller specialized manufacturers. Strategic partnerships, mergers and acquisitions, and technological innovations are key competitive strategies within this dynamic market. The continued focus on sustainable and efficient construction and mining practices will further bolster the growth prospects of the shotcrete accelerator market in the coming years.
Shotcrete Accelerator Market: A Comprehensive Report (2019-2033)
This detailed report provides a comprehensive analysis of the global Shotcrete Accelerator market, offering invaluable insights for businesses, investors, and stakeholders seeking to navigate this dynamic sector. The study covers the period from 2019 to 2033, with 2025 serving as the base and estimated year. The forecast period spans from 2025 to 2033, while the historical period encompasses 2019-2024. The market is segmented by application (Construction and Infrastructure, Mining, Other Applications), state (Liquid, Powder), mixing process (Wet, Dry), and type (Alkali-free, Alkaline Aluminate-based, Alkaline Silicate-based, Other Types). Key players analyzed include DRACO Italiana SpA, Target Products Ltd, MBCC Group, Alumichem AS, Industrias Químicas del Ebro SA, MUHU (China) Construction Materials Co Ltd, Mapei SpA, Maplad, The Euclid Chemical Company, CHRYSO India, Sika AG, JE Tomes, CICO Group, and MC-Bauchemie. The report projects a market value of XX Million by 2033, with a CAGR of xx% during the forecast period.
Shotcrete Accelerator Market Market Structure & Competitive Dynamics
The Shotcrete Accelerator market exhibits a moderately consolidated structure, with a few major players holding significant market share. The market concentration is estimated at xx%, with the top five players accounting for approximately xx% of the total revenue in 2024. Innovation ecosystems are characterized by ongoing research and development efforts focused on enhancing product performance, sustainability, and cost-effectiveness. Regulatory frameworks vary across regions, impacting product approvals and environmental compliance. Key substitutes include alternative binding agents and spraying techniques. End-user trends indicate a growing preference for high-performance, eco-friendly shotcrete accelerators. M&A activity has been moderate in recent years, with notable deals involving [mention specific deals if available, with deal values if possible, e.g., "the acquisition of Company X by Company Y for $XX Million in 2022"].
- Market Share: Top 5 players hold xx% combined market share (2024).
- M&A Activity: Moderate activity observed, with a focus on strategic acquisitions to expand market reach and product portfolios. Estimated total M&A deal value for 2019-2024: XX Million.
- Innovation Ecosystem: Focus on sustainable and high-performance formulations.
- Regulatory Landscape: Varies by region, impacting product approvals and environmental regulations.
Shotcrete Accelerator Market Industry Trends & Insights
The global Shotcrete Accelerator market is experiencing significant growth, driven by the expanding construction and infrastructure sectors, particularly in developing economies. Technological advancements, such as the development of high-performance, environmentally friendly formulations, are further fueling market expansion. Consumer preferences are shifting towards sustainable and efficient solutions, which has led to increased demand for alkali-free and other eco-friendly shotcrete accelerators. Competitive dynamics are characterized by intense rivalry among established players and the emergence of new entrants. The market is anticipated to witness a Compound Annual Growth Rate (CAGR) of xx% during the forecast period (2025-2033), with market penetration expected to reach xx% by 2033. Technological disruptions, such as the adoption of automation in shotcrete application, are expected to further reshape the market landscape. Pricing strategies and marketing initiatives are crucial factors influencing market share. The rising awareness about sustainable construction practices further propels market growth. Government initiatives and infrastructural developments contribute to the accelerated adoption of shotcrete in several regions.
Dominant Markets & Segments in Shotcrete Accelerator Market
The Construction and Infrastructure segment dominates the Shotcrete Accelerator market, accounting for approximately xx% of global revenue in 2024, driven by substantial investments in infrastructure projects worldwide. The Liquid state dominates in terms of market share, due to ease of application and superior performance characteristics. Wet mixing processes hold a significant portion due to its wide applicability. The Alkaline Aluminate-based type dominates because of its superior setting time control and strength development.
- Key Drivers for Construction & Infrastructure Segment:
- Robust infrastructure development programs in developing nations.
- Rising urbanization and the need for improved infrastructure.
- Government initiatives and funding for infrastructure projects.
- Key Drivers for Mining Segment:
- Growth in mining activities and related projects.
- Need for efficient and effective ground support solutions.
- Increasing demand for enhanced safety measures in mining operations.
- Regional Dominance: [Specify dominant region and country, e.g., North America holds the largest market share, followed by Asia-Pacific. Within Asia-Pacific, China is the leading country due to its booming construction industry and significant infrastructure development initiatives.]
Shotcrete Accelerator Market Product Innovations
Recent product innovations have focused on developing environmentally friendly, high-performance shotcrete accelerators. These advancements incorporate sustainable materials and aim to reduce the carbon footprint while improving strength development and setting time control. New formulations offer enhanced workability, improved sprayability, and better adhesion, enabling more efficient and cost-effective applications. The market is witnessing a trend towards specialized accelerators designed for specific applications and substrates. This focus on tailored solutions reflects a growing understanding of material interactions and the demand for optimal performance in diverse settings.
Report Segmentation & Scope
This report comprehensively segments the Shotcrete Accelerator market across various parameters:
- Application: Construction and Infrastructure, Mining, Other Applications (with individual growth projections and market sizes for each).
- State: Liquid, Powder (with market size and share breakdown for each).
- Mixing Process: Wet, Dry (with market share and projected growth for each).
- Type: Alkali-free, Alkaline Aluminate-based, Alkaline Silicate-based, Other Types (including detailed analysis of each type’s market size, growth, and competitive landscape).
Key Drivers of Shotcrete Accelerator Market Growth
Several key factors are driving the growth of the Shotcrete Accelerator market:
- Expanding Construction and Infrastructure Sector: Significant investments in infrastructure projects globally are boosting demand.
- Technological Advancements: The development of high-performance, eco-friendly formulations enhances market appeal.
- Stringent Safety Regulations: The need for robust and durable shotcrete applications in infrastructure and mining is driving demand for quality accelerators.
Challenges in the Shotcrete Accelerator Market Sector
The Shotcrete Accelerator market faces certain challenges:
- Fluctuations in Raw Material Prices: Price volatility of key raw materials impacts production costs and profitability.
- Stringent Environmental Regulations: Compliance with environmental norms adds to the cost of production.
- Intense Competition: The market is characterized by intense competition among established players and new entrants, requiring companies to differentiate their products and services.
Leading Players in the Shotcrete Accelerator Market Market
- DRACO Italiana SpA
- Target Products Ltd
- MBCC Group
- Alumichem AS
- Industrias Químicas del Ebro SA
- MUHU (China) Construction Materials Co Ltd
- Mapei SpA
- Maplad
- The Euclid Chemical Company
- CHRYSO India
- Sika AG
- JE Tomes
- CICO Group
- MC-Bauchemie
Key Developments in Shotcrete Accelerator Market Sector
- January 2023: Company X launched a new eco-friendly shotcrete accelerator.
- June 2022: Company Y acquired Company Z, expanding its product portfolio.
- [Add more bullet points with specific dates and details of significant developments, such as new product launches, mergers, acquisitions, partnerships, regulatory changes, and technological advancements.]
Strategic Shotcrete Accelerator Market Market Outlook
The Shotcrete Accelerator market is poised for continued growth, driven by robust infrastructure development, technological advancements, and the increasing demand for sustainable construction solutions. Strategic opportunities exist for companies focusing on innovation, sustainability, and expansion into emerging markets. Partnerships and collaborations can also play a crucial role in accessing new technologies and expanding market reach. The focus on developing high-performance, cost-effective, and environmentally friendly shotcrete accelerators will be key to success in the coming years.
Shotcrete Accelerator Market Segmentation
-
1. State
- 1.1. Liquid
- 1.2. Powder
-
2. Mixing Process
- 2.1. Wet
- 2.2. Dry
-
3. Type
- 3.1. Alkali-free
- 3.2. Alkaline Aluminate-based
- 3.3. Alkaline Silicate-based
- 3.4. Other Types
-
4. Application
- 4.1. Construction and Infrastructure
- 4.2. Mining
- 4.3. Other Applications
Shotcrete Accelerator Market Segmentation By Geography
-
1. Asia Pacific
- 1.1. China
- 1.2. India
- 1.3. Japan
- 1.4. South Korea
- 1.5. Rest of Asia Pacific
-
2. North America
- 2.1. United States
- 2.2. Canada
- 2.3. Mexico
-
3. Europe
- 3.1. Germany
- 3.2. United Kingdom
- 3.3. Italy
- 3.4. France
- 3.5. Rest of Europe
-
4. South America
- 4.1. Brazil
- 4.2. Argentina
- 4.3. Rest of South America
-
5. Middle East and Africa
- 5.1. Saudi Arabia
- 5.2. South Africa
- 5.3. Rest of Middle East and Africa
Shotcrete Accelerator Market REPORT HIGHLIGHTS
| Aspects | Details |
|---|---|
| Study Period | 2019-2033 |
| Base Year | 2024 |
| Estimated Year | 2025 |
| Forecast Period | 2025-2033 |
| Historical Period | 2019-2024 |
| Growth Rate | CAGR of > 6.00% from 2019-2033 |
| Segmentation |
|
Table of Contents
- 1. Introduction
- 1.1. Research Scope
- 1.2. Market Segmentation
- 1.3. Research Methodology
- 1.4. Definitions and Assumptions
- 2. Executive Summary
- 2.1. Introduction
- 3. Market Dynamics
- 3.1. Introduction
- 3.2. Market Drivers
- 3.2.1. ; Growing Demand from the Construction and Infrastructure Industry; Increasing Demand from the Mining Sector
- 3.3. Market Restrains
- 3.3.1. ; Limited Performance of Alkali-free Shotcrete Accelerators; Unfavourable Conditions Arising Due to the COVID-19 Outbreak
- 3.4. Market Trends
- 3.4.1. Growing Demand from the Construction and Infrastructure Industry
- 4. Market Factor Analysis
- 4.1. Porters Five Forces
- 4.2. Supply/Value Chain
- 4.3. PESTEL analysis
- 4.4. Market Entropy
- 4.5. Patent/Trademark Analysis
- 5. Global Shotcrete Accelerator Market Analysis, Insights and Forecast, 2019-2031
- 5.1. Market Analysis, Insights and Forecast - by State
- 5.1.1. Liquid
- 5.1.2. Powder
- 5.2. Market Analysis, Insights and Forecast - by Mixing Process
- 5.2.1. Wet
- 5.2.2. Dry
- 5.3. Market Analysis, Insights and Forecast - by Type
- 5.3.1. Alkali-free
- 5.3.2. Alkaline Aluminate-based
- 5.3.3. Alkaline Silicate-based
- 5.3.4. Other Types
- 5.4. Market Analysis, Insights and Forecast - by Application
- 5.4.1. Construction and Infrastructure
- 5.4.2. Mining
- 5.4.3. Other Applications
- 5.5. Market Analysis, Insights and Forecast - by Region
- 5.5.1. Asia Pacific
- 5.5.2. North America
- 5.5.3. Europe
- 5.5.4. South America
- 5.5.5. Middle East and Africa
- 5.1. Market Analysis, Insights and Forecast - by State
- 6. Asia Pacific Shotcrete Accelerator Market Analysis, Insights and Forecast, 2019-2031
- 6.1. Market Analysis, Insights and Forecast - by State
- 6.1.1. Liquid
- 6.1.2. Powder
- 6.2. Market Analysis, Insights and Forecast - by Mixing Process
- 6.2.1. Wet
- 6.2.2. Dry
- 6.3. Market Analysis, Insights and Forecast - by Type
- 6.3.1. Alkali-free
- 6.3.2. Alkaline Aluminate-based
- 6.3.3. Alkaline Silicate-based
- 6.3.4. Other Types
- 6.4. Market Analysis, Insights and Forecast - by Application
- 6.4.1. Construction and Infrastructure
- 6.4.2. Mining
- 6.4.3. Other Applications
- 6.1. Market Analysis, Insights and Forecast - by State
- 7. North America Shotcrete Accelerator Market Analysis, Insights and Forecast, 2019-2031
- 7.1. Market Analysis, Insights and Forecast - by State
- 7.1.1. Liquid
- 7.1.2. Powder
- 7.2. Market Analysis, Insights and Forecast - by Mixing Process
- 7.2.1. Wet
- 7.2.2. Dry
- 7.3. Market Analysis, Insights and Forecast - by Type
- 7.3.1. Alkali-free
- 7.3.2. Alkaline Aluminate-based
- 7.3.3. Alkaline Silicate-based
- 7.3.4. Other Types
- 7.4. Market Analysis, Insights and Forecast - by Application
- 7.4.1. Construction and Infrastructure
- 7.4.2. Mining
- 7.4.3. Other Applications
- 7.1. Market Analysis, Insights and Forecast - by State
- 8. Europe Shotcrete Accelerator Market Analysis, Insights and Forecast, 2019-2031
- 8.1. Market Analysis, Insights and Forecast - by State
- 8.1.1. Liquid
- 8.1.2. Powder
- 8.2. Market Analysis, Insights and Forecast - by Mixing Process
- 8.2.1. Wet
- 8.2.2. Dry
- 8.3. Market Analysis, Insights and Forecast - by Type
- 8.3.1. Alkali-free
- 8.3.2. Alkaline Aluminate-based
- 8.3.3. Alkaline Silicate-based
- 8.3.4. Other Types
- 8.4. Market Analysis, Insights and Forecast - by Application
- 8.4.1. Construction and Infrastructure
- 8.4.2. Mining
- 8.4.3. Other Applications
- 8.1. Market Analysis, Insights and Forecast - by State
- 9. South America Shotcrete Accelerator Market Analysis, Insights and Forecast, 2019-2031
- 9.1. Market Analysis, Insights and Forecast - by State
- 9.1.1. Liquid
- 9.1.2. Powder
- 9.2. Market Analysis, Insights and Forecast - by Mixing Process
- 9.2.1. Wet
- 9.2.2. Dry
- 9.3. Market Analysis, Insights and Forecast - by Type
- 9.3.1. Alkali-free
- 9.3.2. Alkaline Aluminate-based
- 9.3.3. Alkaline Silicate-based
- 9.3.4. Other Types
- 9.4. Market Analysis, Insights and Forecast - by Application
- 9.4.1. Construction and Infrastructure
- 9.4.2. Mining
- 9.4.3. Other Applications
- 9.1. Market Analysis, Insights and Forecast - by State
- 10. Middle East and Africa Shotcrete Accelerator Market Analysis, Insights and Forecast, 2019-2031
- 10.1. Market Analysis, Insights and Forecast - by State
- 10.1.1. Liquid
- 10.1.2. Powder
- 10.2. Market Analysis, Insights and Forecast - by Mixing Process
- 10.2.1. Wet
- 10.2.2. Dry
- 10.3. Market Analysis, Insights and Forecast - by Type
- 10.3.1. Alkali-free
- 10.3.2. Alkaline Aluminate-based
- 10.3.3. Alkaline Silicate-based
- 10.3.4. Other Types
- 10.4. Market Analysis, Insights and Forecast - by Application
- 10.4.1. Construction and Infrastructure
- 10.4.2. Mining
- 10.4.3. Other Applications
- 10.1. Market Analysis, Insights and Forecast - by State
- 11. North America Shotcrete Accelerator Market Analysis, Insights and Forecast, 2019-2031
- 11.1. Market Analysis, Insights and Forecast - By Country/Sub-region
- 11.1.1 United States
- 11.1.2 Canada
- 11.1.3 Mexico
- 12. Europe Shotcrete Accelerator Market Analysis, Insights and Forecast, 2019-2031
- 12.1. Market Analysis, Insights and Forecast - By Country/Sub-region
- 12.1.1 Germany
- 12.1.2 France
- 12.1.3 Italy
- 12.1.4 United Kingdom
- 12.1.5 Netherlands
- 12.1.6 Rest of Europe
- 13. Asia Pacific Shotcrete Accelerator Market Analysis, Insights and Forecast, 2019-2031
- 13.1. Market Analysis, Insights and Forecast - By Country/Sub-region
- 13.1.1 China
- 13.1.2 Japan
- 13.1.3 India
- 13.1.4 South Korea
- 13.1.5 Taiwan
- 13.1.6 Australia
- 13.1.7 Rest of Asia-Pacific
- 14. South America Shotcrete Accelerator Market Analysis, Insights and Forecast, 2019-2031
- 14.1. Market Analysis, Insights and Forecast - By Country/Sub-region
- 14.1.1 Brazil
- 14.1.2 Argentina
- 14.1.3 Rest of South America
- 15. MEA Shotcrete Accelerator Market Analysis, Insights and Forecast, 2019-2031
- 15.1. Market Analysis, Insights and Forecast - By Country/Sub-region
- 15.1.1 Middle East
- 15.1.2 Africa
- 16. Competitive Analysis
- 16.1. Global Market Share Analysis 2024
- 16.2. Company Profiles
- 16.2.1 DRACO Italiana SpA
- 16.2.1.1. Overview
- 16.2.1.2. Products
- 16.2.1.3. SWOT Analysis
- 16.2.1.4. Recent Developments
- 16.2.1.5. Financials (Based on Availability)
- 16.2.2 Target Products Ltd
- 16.2.2.1. Overview
- 16.2.2.2. Products
- 16.2.2.3. SWOT Analysis
- 16.2.2.4. Recent Developments
- 16.2.2.5. Financials (Based on Availability)
- 16.2.3 MBCC Group
- 16.2.3.1. Overview
- 16.2.3.2. Products
- 16.2.3.3. SWOT Analysis
- 16.2.3.4. Recent Developments
- 16.2.3.5. Financials (Based on Availability)
- 16.2.4 Alumichem AS
- 16.2.4.1. Overview
- 16.2.4.2. Products
- 16.2.4.3. SWOT Analysis
- 16.2.4.4. Recent Developments
- 16.2.4.5. Financials (Based on Availability)
- 16.2.5 Industrias Químicas del Ebro SA
- 16.2.5.1. Overview
- 16.2.5.2. Products
- 16.2.5.3. SWOT Analysis
- 16.2.5.4. Recent Developments
- 16.2.5.5. Financials (Based on Availability)
- 16.2.6 MUHU (China) Construction Materials Co Ltd
- 16.2.6.1. Overview
- 16.2.6.2. Products
- 16.2.6.3. SWOT Analysis
- 16.2.6.4. Recent Developments
- 16.2.6.5. Financials (Based on Availability)
- 16.2.7 Mapei SpA
- 16.2.7.1. Overview
- 16.2.7.2. Products
- 16.2.7.3. SWOT Analysis
- 16.2.7.4. Recent Developments
- 16.2.7.5. Financials (Based on Availability)
- 16.2.8 Maplad
- 16.2.8.1. Overview
- 16.2.8.2. Products
- 16.2.8.3. SWOT Analysis
- 16.2.8.4. Recent Developments
- 16.2.8.5. Financials (Based on Availability)
- 16.2.9 The Euclid Chemical Company
- 16.2.9.1. Overview
- 16.2.9.2. Products
- 16.2.9.3. SWOT Analysis
- 16.2.9.4. Recent Developments
- 16.2.9.5. Financials (Based on Availability)
- 16.2.10 CHRYSO India
- 16.2.10.1. Overview
- 16.2.10.2. Products
- 16.2.10.3. SWOT Analysis
- 16.2.10.4. Recent Developments
- 16.2.10.5. Financials (Based on Availability)
- 16.2.11 Sika AG
- 16.2.11.1. Overview
- 16.2.11.2. Products
- 16.2.11.3. SWOT Analysis
- 16.2.11.4. Recent Developments
- 16.2.11.5. Financials (Based on Availability)
- 16.2.12 JE Tomes
- 16.2.12.1. Overview
- 16.2.12.2. Products
- 16.2.12.3. SWOT Analysis
- 16.2.12.4. Recent Developments
- 16.2.12.5. Financials (Based on Availability)
- 16.2.13 CICO Group
- 16.2.13.1. Overview
- 16.2.13.2. Products
- 16.2.13.3. SWOT Analysis
- 16.2.13.4. Recent Developments
- 16.2.13.5. Financials (Based on Availability)
- 16.2.14 MC-Bauchemie
- 16.2.14.1. Overview
- 16.2.14.2. Products
- 16.2.14.3. SWOT Analysis
- 16.2.14.4. Recent Developments
- 16.2.14.5. Financials (Based on Availability)
- 16.2.1 DRACO Italiana SpA
List of Figures
- Figure 1: Global Shotcrete Accelerator Market Revenue Breakdown (Million, %) by Region 2024 & 2032
- Figure 2: Global Shotcrete Accelerator Market Volume Breakdown (K Tons, %) by Region 2024 & 2032
- Figure 3: North America Shotcrete Accelerator Market Revenue (Million), by Country 2024 & 2032
- Figure 4: North America Shotcrete Accelerator Market Volume (K Tons), by Country 2024 & 2032
- Figure 5: North America Shotcrete Accelerator Market Revenue Share (%), by Country 2024 & 2032
- Figure 6: North America Shotcrete Accelerator Market Volume Share (%), by Country 2024 & 2032
- Figure 7: Europe Shotcrete Accelerator Market Revenue (Million), by Country 2024 & 2032
- Figure 8: Europe Shotcrete Accelerator Market Volume (K Tons), by Country 2024 & 2032
- Figure 9: Europe Shotcrete Accelerator Market Revenue Share (%), by Country 2024 & 2032
- Figure 10: Europe Shotcrete Accelerator Market Volume Share (%), by Country 2024 & 2032
- Figure 11: Asia Pacific Shotcrete Accelerator Market Revenue (Million), by Country 2024 & 2032
- Figure 12: Asia Pacific Shotcrete Accelerator Market Volume (K Tons), by Country 2024 & 2032
- Figure 13: Asia Pacific Shotcrete Accelerator Market Revenue Share (%), by Country 2024 & 2032
- Figure 14: Asia Pacific Shotcrete Accelerator Market Volume Share (%), by Country 2024 & 2032
- Figure 15: South America Shotcrete Accelerator Market Revenue (Million), by Country 2024 & 2032
- Figure 16: South America Shotcrete Accelerator Market Volume (K Tons), by Country 2024 & 2032
- Figure 17: South America Shotcrete Accelerator Market Revenue Share (%), by Country 2024 & 2032
- Figure 18: South America Shotcrete Accelerator Market Volume Share (%), by Country 2024 & 2032
- Figure 19: MEA Shotcrete Accelerator Market Revenue (Million), by Country 2024 & 2032
- Figure 20: MEA Shotcrete Accelerator Market Volume (K Tons), by Country 2024 & 2032
- Figure 21: MEA Shotcrete Accelerator Market Revenue Share (%), by Country 2024 & 2032
- Figure 22: MEA Shotcrete Accelerator Market Volume Share (%), by Country 2024 & 2032
- Figure 23: Asia Pacific Shotcrete Accelerator Market Revenue (Million), by State 2024 & 2032
- Figure 24: Asia Pacific Shotcrete Accelerator Market Volume (K Tons), by State 2024 & 2032
- Figure 25: Asia Pacific Shotcrete Accelerator Market Revenue Share (%), by State 2024 & 2032
- Figure 26: Asia Pacific Shotcrete Accelerator Market Volume Share (%), by State 2024 & 2032
- Figure 27: Asia Pacific Shotcrete Accelerator Market Revenue (Million), by Mixing Process 2024 & 2032
- Figure 28: Asia Pacific Shotcrete Accelerator Market Volume (K Tons), by Mixing Process 2024 & 2032
- Figure 29: Asia Pacific Shotcrete Accelerator Market Revenue Share (%), by Mixing Process 2024 & 2032
- Figure 30: Asia Pacific Shotcrete Accelerator Market Volume Share (%), by Mixing Process 2024 & 2032
- Figure 31: Asia Pacific Shotcrete Accelerator Market Revenue (Million), by Type 2024 & 2032
- Figure 32: Asia Pacific Shotcrete Accelerator Market Volume (K Tons), by Type 2024 & 2032
- Figure 33: Asia Pacific Shotcrete Accelerator Market Revenue Share (%), by Type 2024 & 2032
- Figure 34: Asia Pacific Shotcrete Accelerator Market Volume Share (%), by Type 2024 & 2032
- Figure 35: Asia Pacific Shotcrete Accelerator Market Revenue (Million), by Application 2024 & 2032
- Figure 36: Asia Pacific Shotcrete Accelerator Market Volume (K Tons), by Application 2024 & 2032
- Figure 37: Asia Pacific Shotcrete Accelerator Market Revenue Share (%), by Application 2024 & 2032
- Figure 38: Asia Pacific Shotcrete Accelerator Market Volume Share (%), by Application 2024 & 2032
- Figure 39: Asia Pacific Shotcrete Accelerator Market Revenue (Million), by Country 2024 & 2032
- Figure 40: Asia Pacific Shotcrete Accelerator Market Volume (K Tons), by Country 2024 & 2032
- Figure 41: Asia Pacific Shotcrete Accelerator Market Revenue Share (%), by Country 2024 & 2032
- Figure 42: Asia Pacific Shotcrete Accelerator Market Volume Share (%), by Country 2024 & 2032
- Figure 43: North America Shotcrete Accelerator Market Revenue (Million), by State 2024 & 2032
- Figure 44: North America Shotcrete Accelerator Market Volume (K Tons), by State 2024 & 2032
- Figure 45: North America Shotcrete Accelerator Market Revenue Share (%), by State 2024 & 2032
- Figure 46: North America Shotcrete Accelerator Market Volume Share (%), by State 2024 & 2032
- Figure 47: North America Shotcrete Accelerator Market Revenue (Million), by Mixing Process 2024 & 2032
- Figure 48: North America Shotcrete Accelerator Market Volume (K Tons), by Mixing Process 2024 & 2032
- Figure 49: North America Shotcrete Accelerator Market Revenue Share (%), by Mixing Process 2024 & 2032
- Figure 50: North America Shotcrete Accelerator Market Volume Share (%), by Mixing Process 2024 & 2032
- Figure 51: North America Shotcrete Accelerator Market Revenue (Million), by Type 2024 & 2032
- Figure 52: North America Shotcrete Accelerator Market Volume (K Tons), by Type 2024 & 2032
- Figure 53: North America Shotcrete Accelerator Market Revenue Share (%), by Type 2024 & 2032
- Figure 54: North America Shotcrete Accelerator Market Volume Share (%), by Type 2024 & 2032
- Figure 55: North America Shotcrete Accelerator Market Revenue (Million), by Application 2024 & 2032
- Figure 56: North America Shotcrete Accelerator Market Volume (K Tons), by Application 2024 & 2032
- Figure 57: North America Shotcrete Accelerator Market Revenue Share (%), by Application 2024 & 2032
- Figure 58: North America Shotcrete Accelerator Market Volume Share (%), by Application 2024 & 2032
- Figure 59: North America Shotcrete Accelerator Market Revenue (Million), by Country 2024 & 2032
- Figure 60: North America Shotcrete Accelerator Market Volume (K Tons), by Country 2024 & 2032
- Figure 61: North America Shotcrete Accelerator Market Revenue Share (%), by Country 2024 & 2032
- Figure 62: North America Shotcrete Accelerator Market Volume Share (%), by Country 2024 & 2032
- Figure 63: Europe Shotcrete Accelerator Market Revenue (Million), by State 2024 & 2032
- Figure 64: Europe Shotcrete Accelerator Market Volume (K Tons), by State 2024 & 2032
- Figure 65: Europe Shotcrete Accelerator Market Revenue Share (%), by State 2024 & 2032
- Figure 66: Europe Shotcrete Accelerator Market Volume Share (%), by State 2024 & 2032
- Figure 67: Europe Shotcrete Accelerator Market Revenue (Million), by Mixing Process 2024 & 2032
- Figure 68: Europe Shotcrete Accelerator Market Volume (K Tons), by Mixing Process 2024 & 2032
- Figure 69: Europe Shotcrete Accelerator Market Revenue Share (%), by Mixing Process 2024 & 2032
- Figure 70: Europe Shotcrete Accelerator Market Volume Share (%), by Mixing Process 2024 & 2032
- Figure 71: Europe Shotcrete Accelerator Market Revenue (Million), by Type 2024 & 2032
- Figure 72: Europe Shotcrete Accelerator Market Volume (K Tons), by Type 2024 & 2032
- Figure 73: Europe Shotcrete Accelerator Market Revenue Share (%), by Type 2024 & 2032
- Figure 74: Europe Shotcrete Accelerator Market Volume Share (%), by Type 2024 & 2032
- Figure 75: Europe Shotcrete Accelerator Market Revenue (Million), by Application 2024 & 2032
- Figure 76: Europe Shotcrete Accelerator Market Volume (K Tons), by Application 2024 & 2032
- Figure 77: Europe Shotcrete Accelerator Market Revenue Share (%), by Application 2024 & 2032
- Figure 78: Europe Shotcrete Accelerator Market Volume Share (%), by Application 2024 & 2032
- Figure 79: Europe Shotcrete Accelerator Market Revenue (Million), by Country 2024 & 2032
- Figure 80: Europe Shotcrete Accelerator Market Volume (K Tons), by Country 2024 & 2032
- Figure 81: Europe Shotcrete Accelerator Market Revenue Share (%), by Country 2024 & 2032
- Figure 82: Europe Shotcrete Accelerator Market Volume Share (%), by Country 2024 & 2032
- Figure 83: South America Shotcrete Accelerator Market Revenue (Million), by State 2024 & 2032
- Figure 84: South America Shotcrete Accelerator Market Volume (K Tons), by State 2024 & 2032
- Figure 85: South America Shotcrete Accelerator Market Revenue Share (%), by State 2024 & 2032
- Figure 86: South America Shotcrete Accelerator Market Volume Share (%), by State 2024 & 2032
- Figure 87: South America Shotcrete Accelerator Market Revenue (Million), by Mixing Process 2024 & 2032
- Figure 88: South America Shotcrete Accelerator Market Volume (K Tons), by Mixing Process 2024 & 2032
- Figure 89: South America Shotcrete Accelerator Market Revenue Share (%), by Mixing Process 2024 & 2032
- Figure 90: South America Shotcrete Accelerator Market Volume Share (%), by Mixing Process 2024 & 2032
- Figure 91: South America Shotcrete Accelerator Market Revenue (Million), by Type 2024 & 2032
- Figure 92: South America Shotcrete Accelerator Market Volume (K Tons), by Type 2024 & 2032
- Figure 93: South America Shotcrete Accelerator Market Revenue Share (%), by Type 2024 & 2032
- Figure 94: South America Shotcrete Accelerator Market Volume Share (%), by Type 2024 & 2032
- Figure 95: South America Shotcrete Accelerator Market Revenue (Million), by Application 2024 & 2032
- Figure 96: South America Shotcrete Accelerator Market Volume (K Tons), by Application 2024 & 2032
- Figure 97: South America Shotcrete Accelerator Market Revenue Share (%), by Application 2024 & 2032
- Figure 98: South America Shotcrete Accelerator Market Volume Share (%), by Application 2024 & 2032
- Figure 99: South America Shotcrete Accelerator Market Revenue (Million), by Country 2024 & 2032
- Figure 100: South America Shotcrete Accelerator Market Volume (K Tons), by Country 2024 & 2032
- Figure 101: South America Shotcrete Accelerator Market Revenue Share (%), by Country 2024 & 2032
- Figure 102: South America Shotcrete Accelerator Market Volume Share (%), by Country 2024 & 2032
- Figure 103: Middle East and Africa Shotcrete Accelerator Market Revenue (Million), by State 2024 & 2032
- Figure 104: Middle East and Africa Shotcrete Accelerator Market Volume (K Tons), by State 2024 & 2032
- Figure 105: Middle East and Africa Shotcrete Accelerator Market Revenue Share (%), by State 2024 & 2032
- Figure 106: Middle East and Africa Shotcrete Accelerator Market Volume Share (%), by State 2024 & 2032
- Figure 107: Middle East and Africa Shotcrete Accelerator Market Revenue (Million), by Mixing Process 2024 & 2032
- Figure 108: Middle East and Africa Shotcrete Accelerator Market Volume (K Tons), by Mixing Process 2024 & 2032
- Figure 109: Middle East and Africa Shotcrete Accelerator Market Revenue Share (%), by Mixing Process 2024 & 2032
- Figure 110: Middle East and Africa Shotcrete Accelerator Market Volume Share (%), by Mixing Process 2024 & 2032
- Figure 111: Middle East and Africa Shotcrete Accelerator Market Revenue (Million), by Type 2024 & 2032
- Figure 112: Middle East and Africa Shotcrete Accelerator Market Volume (K Tons), by Type 2024 & 2032
- Figure 113: Middle East and Africa Shotcrete Accelerator Market Revenue Share (%), by Type 2024 & 2032
- Figure 114: Middle East and Africa Shotcrete Accelerator Market Volume Share (%), by Type 2024 & 2032
- Figure 115: Middle East and Africa Shotcrete Accelerator Market Revenue (Million), by Application 2024 & 2032
- Figure 116: Middle East and Africa Shotcrete Accelerator Market Volume (K Tons), by Application 2024 & 2032
- Figure 117: Middle East and Africa Shotcrete Accelerator Market Revenue Share (%), by Application 2024 & 2032
- Figure 118: Middle East and Africa Shotcrete Accelerator Market Volume Share (%), by Application 2024 & 2032
- Figure 119: Middle East and Africa Shotcrete Accelerator Market Revenue (Million), by Country 2024 & 2032
- Figure 120: Middle East and Africa Shotcrete Accelerator Market Volume (K Tons), by Country 2024 & 2032
- Figure 121: Middle East and Africa Shotcrete Accelerator Market Revenue Share (%), by Country 2024 & 2032
- Figure 122: Middle East and Africa Shotcrete Accelerator Market Volume Share (%), by Country 2024 & 2032
List of Tables
- Table 1: Global Shotcrete Accelerator Market Revenue Million Forecast, by Region 2019 & 2032
- Table 2: Global Shotcrete Accelerator Market Volume K Tons Forecast, by Region 2019 & 2032
- Table 3: Global Shotcrete Accelerator Market Revenue Million Forecast, by State 2019 & 2032
- Table 4: Global Shotcrete Accelerator Market Volume K Tons Forecast, by State 2019 & 2032
- Table 5: Global Shotcrete Accelerator Market Revenue Million Forecast, by Mixing Process 2019 & 2032
- Table 6: Global Shotcrete Accelerator Market Volume K Tons Forecast, by Mixing Process 2019 & 2032
- Table 7: Global Shotcrete Accelerator Market Revenue Million Forecast, by Type 2019 & 2032
- Table 8: Global Shotcrete Accelerator Market Volume K Tons Forecast, by Type 2019 & 2032
- Table 9: Global Shotcrete Accelerator Market Revenue Million Forecast, by Application 2019 & 2032
- Table 10: Global Shotcrete Accelerator Market Volume K Tons Forecast, by Application 2019 & 2032
- Table 11: Global Shotcrete Accelerator Market Revenue Million Forecast, by Region 2019 & 2032
- Table 12: Global Shotcrete Accelerator Market Volume K Tons Forecast, by Region 2019 & 2032
- Table 13: Global Shotcrete Accelerator Market Revenue Million Forecast, by Country 2019 & 2032
- Table 14: Global Shotcrete Accelerator Market Volume K Tons Forecast, by Country 2019 & 2032
- Table 15: United States Shotcrete Accelerator Market Revenue (Million) Forecast, by Application 2019 & 2032
- Table 16: United States Shotcrete Accelerator Market Volume (K Tons) Forecast, by Application 2019 & 2032
- Table 17: Canada Shotcrete Accelerator Market Revenue (Million) Forecast, by Application 2019 & 2032
- Table 18: Canada Shotcrete Accelerator Market Volume (K Tons) Forecast, by Application 2019 & 2032
- Table 19: Mexico Shotcrete Accelerator Market Revenue (Million) Forecast, by Application 2019 & 2032
- Table 20: Mexico Shotcrete Accelerator Market Volume (K Tons) Forecast, by Application 2019 & 2032
- Table 21: Global Shotcrete Accelerator Market Revenue Million Forecast, by Country 2019 & 2032
- Table 22: Global Shotcrete Accelerator Market Volume K Tons Forecast, by Country 2019 & 2032
- Table 23: Germany Shotcrete Accelerator Market Revenue (Million) Forecast, by Application 2019 & 2032
- Table 24: Germany Shotcrete Accelerator Market Volume (K Tons) Forecast, by Application 2019 & 2032
- Table 25: France Shotcrete Accelerator Market Revenue (Million) Forecast, by Application 2019 & 2032
- Table 26: France Shotcrete Accelerator Market Volume (K Tons) Forecast, by Application 2019 & 2032
- Table 27: Italy Shotcrete Accelerator Market Revenue (Million) Forecast, by Application 2019 & 2032
- Table 28: Italy Shotcrete Accelerator Market Volume (K Tons) Forecast, by Application 2019 & 2032
- Table 29: United Kingdom Shotcrete Accelerator Market Revenue (Million) Forecast, by Application 2019 & 2032
- Table 30: United Kingdom Shotcrete Accelerator Market Volume (K Tons) Forecast, by Application 2019 & 2032
- Table 31: Netherlands Shotcrete Accelerator Market Revenue (Million) Forecast, by Application 2019 & 2032
- Table 32: Netherlands Shotcrete Accelerator Market Volume (K Tons) Forecast, by Application 2019 & 2032
- Table 33: Rest of Europe Shotcrete Accelerator Market Revenue (Million) Forecast, by Application 2019 & 2032
- Table 34: Rest of Europe Shotcrete Accelerator Market Volume (K Tons) Forecast, by Application 2019 & 2032
- Table 35: Global Shotcrete Accelerator Market Revenue Million Forecast, by Country 2019 & 2032
- Table 36: Global Shotcrete Accelerator Market Volume K Tons Forecast, by Country 2019 & 2032
- Table 37: China Shotcrete Accelerator Market Revenue (Million) Forecast, by Application 2019 & 2032
- Table 38: China Shotcrete Accelerator Market Volume (K Tons) Forecast, by Application 2019 & 2032
- Table 39: Japan Shotcrete Accelerator Market Revenue (Million) Forecast, by Application 2019 & 2032
- Table 40: Japan Shotcrete Accelerator Market Volume (K Tons) Forecast, by Application 2019 & 2032
- Table 41: India Shotcrete Accelerator Market Revenue (Million) Forecast, by Application 2019 & 2032
- Table 42: India Shotcrete Accelerator Market Volume (K Tons) Forecast, by Application 2019 & 2032
- Table 43: South Korea Shotcrete Accelerator Market Revenue (Million) Forecast, by Application 2019 & 2032
- Table 44: South Korea Shotcrete Accelerator Market Volume (K Tons) Forecast, by Application 2019 & 2032
- Table 45: Taiwan Shotcrete Accelerator Market Revenue (Million) Forecast, by Application 2019 & 2032
- Table 46: Taiwan Shotcrete Accelerator Market Volume (K Tons) Forecast, by Application 2019 & 2032
- Table 47: Australia Shotcrete Accelerator Market Revenue (Million) Forecast, by Application 2019 & 2032
- Table 48: Australia Shotcrete Accelerator Market Volume (K Tons) Forecast, by Application 2019 & 2032
- Table 49: Rest of Asia-Pacific Shotcrete Accelerator Market Revenue (Million) Forecast, by Application 2019 & 2032
- Table 50: Rest of Asia-Pacific Shotcrete Accelerator Market Volume (K Tons) Forecast, by Application 2019 & 2032
- Table 51: Global Shotcrete Accelerator Market Revenue Million Forecast, by Country 2019 & 2032
- Table 52: Global Shotcrete Accelerator Market Volume K Tons Forecast, by Country 2019 & 2032
- Table 53: Brazil Shotcrete Accelerator Market Revenue (Million) Forecast, by Application 2019 & 2032
- Table 54: Brazil Shotcrete Accelerator Market Volume (K Tons) Forecast, by Application 2019 & 2032
- Table 55: Argentina Shotcrete Accelerator Market Revenue (Million) Forecast, by Application 2019 & 2032
- Table 56: Argentina Shotcrete Accelerator Market Volume (K Tons) Forecast, by Application 2019 & 2032
- Table 57: Rest of South America Shotcrete Accelerator Market Revenue (Million) Forecast, by Application 2019 & 2032
- Table 58: Rest of South America Shotcrete Accelerator Market Volume (K Tons) Forecast, by Application 2019 & 2032
- Table 59: Global Shotcrete Accelerator Market Revenue Million Forecast, by Country 2019 & 2032
- Table 60: Global Shotcrete Accelerator Market Volume K Tons Forecast, by Country 2019 & 2032
- Table 61: Middle East Shotcrete Accelerator Market Revenue (Million) Forecast, by Application 2019 & 2032
- Table 62: Middle East Shotcrete Accelerator Market Volume (K Tons) Forecast, by Application 2019 & 2032
- Table 63: Africa Shotcrete Accelerator Market Revenue (Million) Forecast, by Application 2019 & 2032
- Table 64: Africa Shotcrete Accelerator Market Volume (K Tons) Forecast, by Application 2019 & 2032
- Table 65: Global Shotcrete Accelerator Market Revenue Million Forecast, by State 2019 & 2032
- Table 66: Global Shotcrete Accelerator Market Volume K Tons Forecast, by State 2019 & 2032
- Table 67: Global Shotcrete Accelerator Market Revenue Million Forecast, by Mixing Process 2019 & 2032
- Table 68: Global Shotcrete Accelerator Market Volume K Tons Forecast, by Mixing Process 2019 & 2032
- Table 69: Global Shotcrete Accelerator Market Revenue Million Forecast, by Type 2019 & 2032
- Table 70: Global Shotcrete Accelerator Market Volume K Tons Forecast, by Type 2019 & 2032
- Table 71: Global Shotcrete Accelerator Market Revenue Million Forecast, by Application 2019 & 2032
- Table 72: Global Shotcrete Accelerator Market Volume K Tons Forecast, by Application 2019 & 2032
- Table 73: Global Shotcrete Accelerator Market Revenue Million Forecast, by Country 2019 & 2032
- Table 74: Global Shotcrete Accelerator Market Volume K Tons Forecast, by Country 2019 & 2032
- Table 75: China Shotcrete Accelerator Market Revenue (Million) Forecast, by Application 2019 & 2032
- Table 76: China Shotcrete Accelerator Market Volume (K Tons) Forecast, by Application 2019 & 2032
- Table 77: India Shotcrete Accelerator Market Revenue (Million) Forecast, by Application 2019 & 2032
- Table 78: India Shotcrete Accelerator Market Volume (K Tons) Forecast, by Application 2019 & 2032
- Table 79: Japan Shotcrete Accelerator Market Revenue (Million) Forecast, by Application 2019 & 2032
- Table 80: Japan Shotcrete Accelerator Market Volume (K Tons) Forecast, by Application 2019 & 2032
- Table 81: South Korea Shotcrete Accelerator Market Revenue (Million) Forecast, by Application 2019 & 2032
- Table 82: South Korea Shotcrete Accelerator Market Volume (K Tons) Forecast, by Application 2019 & 2032
- Table 83: Rest of Asia Pacific Shotcrete Accelerator Market Revenue (Million) Forecast, by Application 2019 & 2032
- Table 84: Rest of Asia Pacific Shotcrete Accelerator Market Volume (K Tons) Forecast, by Application 2019 & 2032
- Table 85: Global Shotcrete Accelerator Market Revenue Million Forecast, by State 2019 & 2032
- Table 86: Global Shotcrete Accelerator Market Volume K Tons Forecast, by State 2019 & 2032
- Table 87: Global Shotcrete Accelerator Market Revenue Million Forecast, by Mixing Process 2019 & 2032
- Table 88: Global Shotcrete Accelerator Market Volume K Tons Forecast, by Mixing Process 2019 & 2032
- Table 89: Global Shotcrete Accelerator Market Revenue Million Forecast, by Type 2019 & 2032
- Table 90: Global Shotcrete Accelerator Market Volume K Tons Forecast, by Type 2019 & 2032
- Table 91: Global Shotcrete Accelerator Market Revenue Million Forecast, by Application 2019 & 2032
- Table 92: Global Shotcrete Accelerator Market Volume K Tons Forecast, by Application 2019 & 2032
- Table 93: Global Shotcrete Accelerator Market Revenue Million Forecast, by Country 2019 & 2032
- Table 94: Global Shotcrete Accelerator Market Volume K Tons Forecast, by Country 2019 & 2032
- Table 95: United States Shotcrete Accelerator Market Revenue (Million) Forecast, by Application 2019 & 2032
- Table 96: United States Shotcrete Accelerator Market Volume (K Tons) Forecast, by Application 2019 & 2032
- Table 97: Canada Shotcrete Accelerator Market Revenue (Million) Forecast, by Application 2019 & 2032
- Table 98: Canada Shotcrete Accelerator Market Volume (K Tons) Forecast, by Application 2019 & 2032
- Table 99: Mexico Shotcrete Accelerator Market Revenue (Million) Forecast, by Application 2019 & 2032
- Table 100: Mexico Shotcrete Accelerator Market Volume (K Tons) Forecast, by Application 2019 & 2032
- Table 101: Global Shotcrete Accelerator Market Revenue Million Forecast, by State 2019 & 2032
- Table 102: Global Shotcrete Accelerator Market Volume K Tons Forecast, by State 2019 & 2032
- Table 103: Global Shotcrete Accelerator Market Revenue Million Forecast, by Mixing Process 2019 & 2032
- Table 104: Global Shotcrete Accelerator Market Volume K Tons Forecast, by Mixing Process 2019 & 2032
- Table 105: Global Shotcrete Accelerator Market Revenue Million Forecast, by Type 2019 & 2032
- Table 106: Global Shotcrete Accelerator Market Volume K Tons Forecast, by Type 2019 & 2032
- Table 107: Global Shotcrete Accelerator Market Revenue Million Forecast, by Application 2019 & 2032
- Table 108: Global Shotcrete Accelerator Market Volume K Tons Forecast, by Application 2019 & 2032
- Table 109: Global Shotcrete Accelerator Market Revenue Million Forecast, by Country 2019 & 2032
- Table 110: Global Shotcrete Accelerator Market Volume K Tons Forecast, by Country 2019 & 2032
- Table 111: Germany Shotcrete Accelerator Market Revenue (Million) Forecast, by Application 2019 & 2032
- Table 112: Germany Shotcrete Accelerator Market Volume (K Tons) Forecast, by Application 2019 & 2032
- Table 113: United Kingdom Shotcrete Accelerator Market Revenue (Million) Forecast, by Application 2019 & 2032
- Table 114: United Kingdom Shotcrete Accelerator Market Volume (K Tons) Forecast, by Application 2019 & 2032
- Table 115: Italy Shotcrete Accelerator Market Revenue (Million) Forecast, by Application 2019 & 2032
- Table 116: Italy Shotcrete Accelerator Market Volume (K Tons) Forecast, by Application 2019 & 2032
- Table 117: France Shotcrete Accelerator Market Revenue (Million) Forecast, by Application 2019 & 2032
- Table 118: France Shotcrete Accelerator Market Volume (K Tons) Forecast, by Application 2019 & 2032
- Table 119: Rest of Europe Shotcrete Accelerator Market Revenue (Million) Forecast, by Application 2019 & 2032
- Table 120: Rest of Europe Shotcrete Accelerator Market Volume (K Tons) Forecast, by Application 2019 & 2032
- Table 121: Global Shotcrete Accelerator Market Revenue Million Forecast, by State 2019 & 2032
- Table 122: Global Shotcrete Accelerator Market Volume K Tons Forecast, by State 2019 & 2032
- Table 123: Global Shotcrete Accelerator Market Revenue Million Forecast, by Mixing Process 2019 & 2032
- Table 124: Global Shotcrete Accelerator Market Volume K Tons Forecast, by Mixing Process 2019 & 2032
- Table 125: Global Shotcrete Accelerator Market Revenue Million Forecast, by Type 2019 & 2032
- Table 126: Global Shotcrete Accelerator Market Volume K Tons Forecast, by Type 2019 & 2032
- Table 127: Global Shotcrete Accelerator Market Revenue Million Forecast, by Application 2019 & 2032
- Table 128: Global Shotcrete Accelerator Market Volume K Tons Forecast, by Application 2019 & 2032
- Table 129: Global Shotcrete Accelerator Market Revenue Million Forecast, by Country 2019 & 2032
- Table 130: Global Shotcrete Accelerator Market Volume K Tons Forecast, by Country 2019 & 2032
- Table 131: Brazil Shotcrete Accelerator Market Revenue (Million) Forecast, by Application 2019 & 2032
- Table 132: Brazil Shotcrete Accelerator Market Volume (K Tons) Forecast, by Application 2019 & 2032
- Table 133: Argentina Shotcrete Accelerator Market Revenue (Million) Forecast, by Application 2019 & 2032
- Table 134: Argentina Shotcrete Accelerator Market Volume (K Tons) Forecast, by Application 2019 & 2032
- Table 135: Rest of South America Shotcrete Accelerator Market Revenue (Million) Forecast, by Application 2019 & 2032
- Table 136: Rest of South America Shotcrete Accelerator Market Volume (K Tons) Forecast, by Application 2019 & 2032
- Table 137: Global Shotcrete Accelerator Market Revenue Million Forecast, by State 2019 & 2032
- Table 138: Global Shotcrete Accelerator Market Volume K Tons Forecast, by State 2019 & 2032
- Table 139: Global Shotcrete Accelerator Market Revenue Million Forecast, by Mixing Process 2019 & 2032
- Table 140: Global Shotcrete Accelerator Market Volume K Tons Forecast, by Mixing Process 2019 & 2032
- Table 141: Global Shotcrete Accelerator Market Revenue Million Forecast, by Type 2019 & 2032
- Table 142: Global Shotcrete Accelerator Market Volume K Tons Forecast, by Type 2019 & 2032
- Table 143: Global Shotcrete Accelerator Market Revenue Million Forecast, by Application 2019 & 2032
- Table 144: Global Shotcrete Accelerator Market Volume K Tons Forecast, by Application 2019 & 2032
- Table 145: Global Shotcrete Accelerator Market Revenue Million Forecast, by Country 2019 & 2032
- Table 146: Global Shotcrete Accelerator Market Volume K Tons Forecast, by Country 2019 & 2032
- Table 147: Saudi Arabia Shotcrete Accelerator Market Revenue (Million) Forecast, by Application 2019 & 2032
- Table 148: Saudi Arabia Shotcrete Accelerator Market Volume (K Tons) Forecast, by Application 2019 & 2032
- Table 149: South Africa Shotcrete Accelerator Market Revenue (Million) Forecast, by Application 2019 & 2032
- Table 150: South Africa Shotcrete Accelerator Market Volume (K Tons) Forecast, by Application 2019 & 2032
- Table 151: Rest of Middle East and Africa Shotcrete Accelerator Market Revenue (Million) Forecast, by Application 2019 & 2032
- Table 152: Rest of Middle East and Africa Shotcrete Accelerator Market Volume (K Tons) Forecast, by Application 2019 & 2032
Frequently Asked Questions
1. What is the projected Compound Annual Growth Rate (CAGR) of the Shotcrete Accelerator Market?
The projected CAGR is approximately > 6.00%.
2. Which companies are prominent players in the Shotcrete Accelerator Market?
Key companies in the market include DRACO Italiana SpA, Target Products Ltd, MBCC Group, Alumichem AS, Industrias Químicas del Ebro SA, MUHU (China) Construction Materials Co Ltd, Mapei SpA, Maplad, The Euclid Chemical Company, CHRYSO India, Sika AG, JE Tomes, CICO Group, MC-Bauchemie.
3. What are the main segments of the Shotcrete Accelerator Market?
The market segments include State, Mixing Process, Type, Application.
4. Can you provide details about the market size?
The market size is estimated to be USD XX Million as of 2022.
5. What are some drivers contributing to market growth?
; Growing Demand from the Construction and Infrastructure Industry; Increasing Demand from the Mining Sector.
6. What are the notable trends driving market growth?
Growing Demand from the Construction and Infrastructure Industry.
7. Are there any restraints impacting market growth?
; Limited Performance of Alkali-free Shotcrete Accelerators; Unfavourable Conditions Arising Due to the COVID-19 Outbreak.
8. Can you provide examples of recent developments in the market?
N/A
9. What pricing options are available for accessing the report?
Pricing options include single-user, multi-user, and enterprise licenses priced at USD 4750, USD 5250, and USD 8750 respectively.
10. Is the market size provided in terms of value or volume?
The market size is provided in terms of value, measured in Million and volume, measured in K Tons.
11. Are there any specific market keywords associated with the report?
Yes, the market keyword associated with the report is "Shotcrete Accelerator Market," which aids in identifying and referencing the specific market segment covered.
12. How do I determine which pricing option suits my needs best?
The pricing options vary based on user requirements and access needs. Individual users may opt for single-user licenses, while businesses requiring broader access may choose multi-user or enterprise licenses for cost-effective access to the report.
13. Are there any additional resources or data provided in the Shotcrete Accelerator Market report?
While the report offers comprehensive insights, it's advisable to review the specific contents or supplementary materials provided to ascertain if additional resources or data are available.
14. How can I stay updated on further developments or reports in the Shotcrete Accelerator Market?
To stay informed about further developments, trends, and reports in the Shotcrete Accelerator Market, consider subscribing to industry newsletters, following relevant companies and organizations, or regularly checking reputable industry news sources and publications.
Methodology
Step 1 - Identification of Relevant Samples Size from Population Database


Step 2 - Approaches for Defining Global Market Size (Value, Volume* & Price*)

Note*: In applicable scenarios
Step 3 - Data Sources
Primary Research
- Web Analytics
- Survey Reports
- Research Institute
- Latest Research Reports
- Opinion Leaders
Secondary Research
- Annual Reports
- White Paper
- Latest Press Release
- Industry Association
- Paid Database
- Investor Presentations

Step 4 - Data Triangulation
Involves using different sources of information in order to increase the validity of a study
These sources are likely to be stakeholders in a program - participants, other researchers, program staff, other community members, and so on.
Then we put all data in single framework & apply various statistical tools to find out the dynamic on the market.
During the analysis stage, feedback from the stakeholder groups would be compared to determine areas of agreement as well as areas of divergence


