

Key Insights
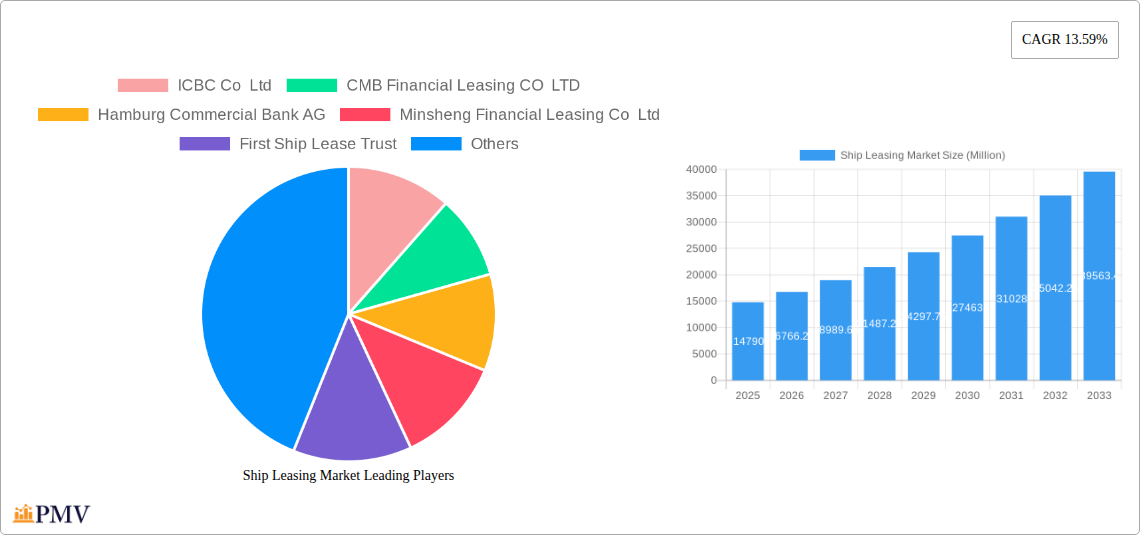
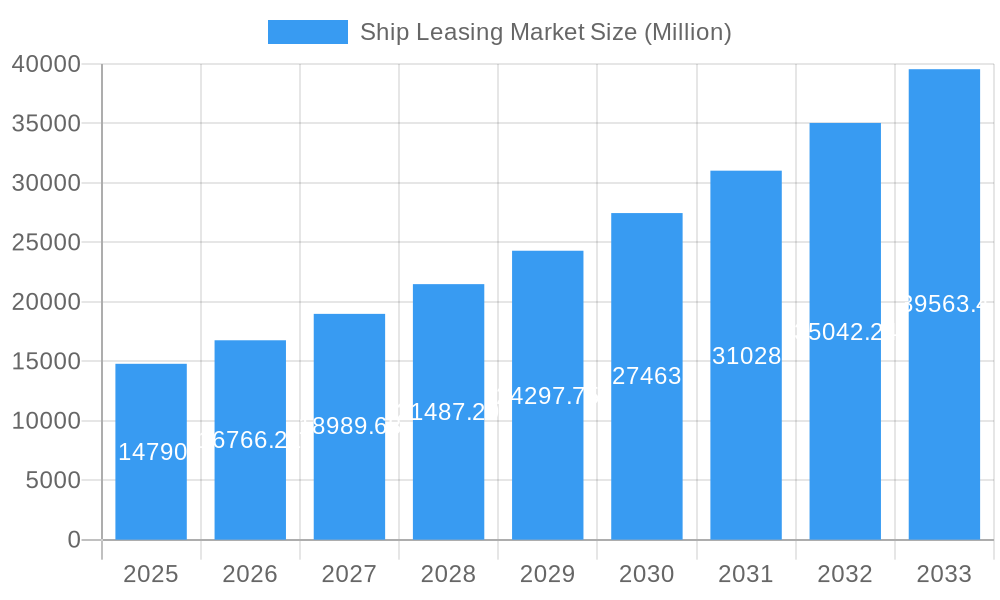
The global ship leasing market, valued at $14.79 billion in 2025, is projected to experience robust growth, exhibiting a Compound Annual Growth Rate (CAGR) of 13.59% from 2025 to 2033. This expansion is driven by several key factors. Increasing global trade volumes necessitate a larger fleet of vessels, fueling demand for efficient and cost-effective leasing options. The preference for operational flexibility offered by leasing, especially for short-term projects or seasonal demands, contributes significantly to market growth. Furthermore, the stringent regulatory environment surrounding ship ownership and maintenance encourages companies to opt for leasing arrangements to manage compliance costs more effectively. Technological advancements in vessel monitoring and management systems also enhance the appeal of leasing, providing greater transparency and control for both lessors and lessees. Finally, the rise of specialized ship types, catering to niche cargo segments, further drives demand within the market's diverse application segments.
Ship Leasing Market Market Size (In Billion)
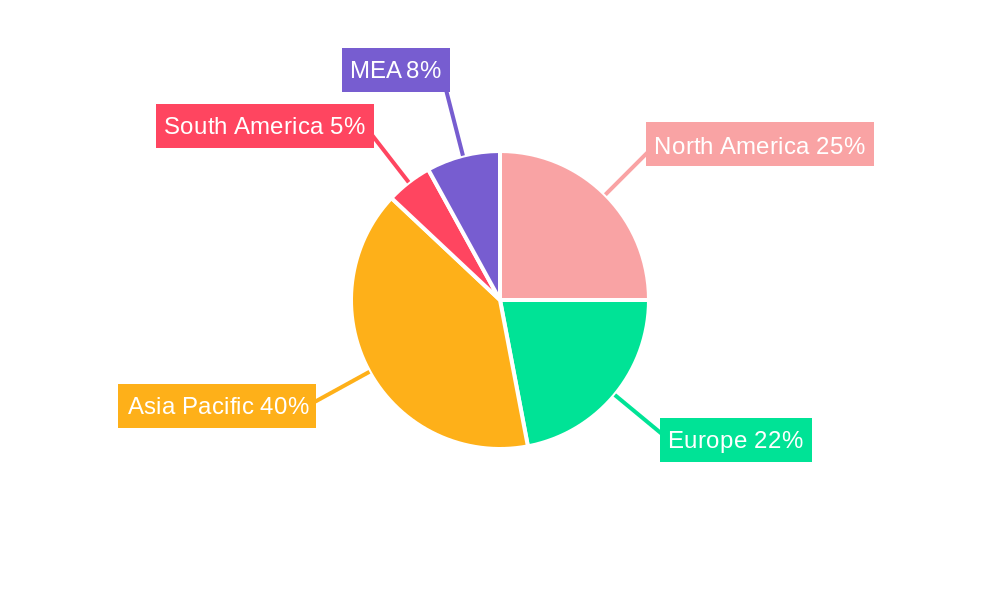
The market segmentation reveals a diverse landscape. Financial leases, offering long-term commitment, and full-service leases, including maintenance and insurance, cater to different operational needs. Container ships and bulk carriers dominate the application segment, reflecting the importance of these vessel types in global trade. Lease types like real-time lease and periodic tenancy provide flexibility, while bareboat charters offer greater operational control to lessees. Geographically, Asia-Pacific, driven by strong economic growth and increasing trade within the region, is expected to hold a significant market share. North America and Europe also contribute substantially, while emerging markets in South America and the Middle East and Africa present promising growth opportunities. Competitive dynamics involve major players like ICBC Co Ltd, CMB Financial Leasing CO LTD, and others, with new entrants continually challenging the established order, fostering innovation and competition within the market. Despite potential headwinds, such as economic fluctuations and geopolitical uncertainties, the long-term outlook for the ship leasing market remains positive, underpinned by the fundamental drivers of global trade and the inherent advantages of leasing in the maritime industry.
Ship Leasing Market Company Market Share
Ship Leasing Market: A Comprehensive Report (2019-2033)
This in-depth report provides a comprehensive analysis of the global Ship Leasing Market, offering valuable insights into market dynamics, competitive landscape, and future growth prospects. Covering the period from 2019 to 2033, with a base year of 2025 and a forecast period of 2025-2033, this report is an essential resource for industry stakeholders, investors, and researchers seeking to understand and capitalize on opportunities within this dynamic sector. The market size in 2025 is estimated at $XX Million.
Ship Leasing Market Market Structure & Competitive Dynamics
The global ship leasing market exhibits a moderately concentrated structure, with several large players holding significant market share. Key players include ICBC Co Ltd, CMB Financial Leasing CO LTD, Hamburg Commercial Bank AG, Minsheng Financial Leasing Co Ltd, First Ship Lease Trust, MUFG Bank Ltd, Bothra Group, Bank of Communications Financial Leasing Co Ltd, Galbraiths Ltd, A P Møller - Mærsk A/S, and Global Ship Lease Inc. These companies compete primarily on pricing, service quality, and the breadth of their vessel portfolios. Market share analysis reveals that the top 5 players collectively hold approximately xx% of the market in 2025, indicating a degree of consolidation.
The market is characterized by a dynamic innovation ecosystem, with ongoing investments in technology and operational efficiency improvements. Regulatory frameworks, including those related to maritime safety, environmental protection (IMO 2020 and beyond), and financing, significantly influence market dynamics. Product substitutes, while limited, include alternative transportation modes such as rail and trucking, although the specialized nature of seaborne trade limits their impact. End-user trends, driven by global trade patterns and evolving cargo demands, are a significant factor, particularly in container shipping and bulk carriers. M&A activity in the sector has been notable, with several large deals exceeding $XX Million in value over the past few years, reflecting the consolidation trend and pursuit of economies of scale.
Ship Leasing Market Industry Trends & Insights
The global ship leasing market is experiencing robust expansion and is poised for significant growth over the forecast period (2025-2033). This surge is primarily propelled by escalating global trade volumes, with a notable concentration in the dynamic Asia-Pacific region. Key drivers include advancements in vessel design, increased automation, and pervasive digitalization, all contributing to enhanced operational efficiency and reduced costs. Shipowners are increasingly embracing digital solutions for sophisticated fleet management and optimized vessel operations, directly stimulating demand for leasing services. Furthermore, evolving consumer preferences for expedited and highly reliable shipping services are significantly influencing market dynamics. The proliferation of e-commerce and the widespread adoption of just-in-time inventory management strategies are fueling a persistent need for agile and efficient shipping solutions, thereby bolstering the ship leasing sector. The Compound Annual Growth Rate (CAGR) for the Ship Leasing Market is projected to be **XX%** during the forecast period, with market penetration anticipated to reach **XX%** by 2033. An intensified focus on sustainability and stringent environmental regulations is actively reshaping industry practices, accelerating the adoption of environmentally sound vessels and innovative green technologies.
Dominant Markets & Segments in Ship Leasing Market
The Asia-Pacific region dominates the global ship leasing market due to its substantial role in global trade and its rapidly expanding maritime sector. Key drivers include strong economic growth in the region, increasing infrastructure development, and favorable government policies supporting maritime trade.
Lease Type: Financial leases currently hold the largest market share due to their advantages in terms of tax benefits and financing flexibility. Full-service leases are experiencing significant growth due to their comprehensive nature and reduced operational burden for lessees.
Application: Container ships represent the largest segment due to the robust growth of containerized trade. Bulk carriers also hold a significant share driven by increasing demand for raw materials.
Type: Bareboat charters are the most prevalent lease type, offering lessees maximum operational flexibility. Real-time leases are gaining traction with the growth of digital technologies facilitating immediate vessel allocation.
Detailed analysis indicates that the dominance of specific segments is further influenced by regional variations in economic activity, regulatory frameworks, and specific infrastructural capabilities, such as the availability of port facilities and skilled labor.
Ship Leasing Market Product Innovations
Recent innovations within the ship leasing market are sharply focused on elevating operational efficiency, championing sustainability initiatives, and refining data analytics capabilities. Leading technological advancements include sophisticated remote monitoring systems, AI-driven predictive maintenance algorithms to minimize downtime, and the integration of blockchain technology for secure, transparent, and streamlined lease management. These innovations are instrumental in conferring substantial competitive advantages by effectively reducing operational expenditures, optimizing vessel performance metrics, and proactively mitigating associated risks. The development and deployment of fuel-efficient and eco-friendly vessels are also critically addressing escalating environmental concerns and adhering to increasingly stringent regulatory frameworks.
Report Segmentation & Scope
This comprehensive report meticulously segments the Ship Leasing Market across key categories: Lease Type (encompassing Financial Lease and Full-Service Lease), Application (including Container Ships, Bulk Carriers, and Other Vessel Types), and Type (covering Real-Time Lease, Periodic Tenancy, Bareboat Charter, and Other specific charter arrangements). Each segment has undergone detailed analysis, including granular growth projections, precise market size estimations, and an in-depth examination of competitive dynamics. The report offers a holistic overview of the market's intricate structure, prevailing trends, and its promising future outlook. Crucially, the growth trajectory of each individual segment is influenced by a unique set of factors, ranging from the fluctuating economic costs associated with specific vessel classes to the specialized regulatory environments governing their operational deployment.
Key Drivers of Ship Leasing Market Growth
The ship leasing market is driven by several key factors: increasing global trade volumes, demand for efficient and cost-effective shipping solutions, technological advancements resulting in improved operational efficiencies, favorable regulatory environments in certain regions, and strategic investments in port infrastructure. The ongoing digitalization of the maritime industry is also a significant catalyst, creating new opportunities for innovation and efficiency gains.
Challenges in the Ship Leasing Market Sector
The ship leasing market faces challenges including fluctuating fuel prices, geopolitical instability impacting global trade routes, stringent environmental regulations increasing operational costs, and intense competition among leasing companies. These factors can create uncertainty and affect the profitability of leasing operations. Supply chain disruptions, particularly impacting vessel construction and maintenance, can also significantly impact market dynamics.
Leading Players in the Ship Leasing Market Market
- ICBC Financial Leasing Co., Ltd.
- CMB Financial Leasing Co., Ltd.
- Hamburg Commercial Bank AG
- Minsheng Financial Leasing Co., Ltd.
- First Ship Lease Trust
- MUFG Bank Ltd.
- Bothra Group
- Bank of Communications Financial Leasing Co., Ltd.
- Galbraiths Ltd.
- A.P. Møller - Mærsk A/S
- Global Ship Lease, Inc.
Key Developments in Ship Leasing Market Sector
- January 2023: Global Ship Lease Inc. announced a new strategic partnership with a major container shipping line.
- June 2022: ICBC Co Ltd invested in the development of a new fleet of eco-friendly container ships.
- October 2021: CMB Financial Leasing CO LTD acquired a significant number of secondhand vessels to expand its portfolio. (Further developments can be added here)
Strategic Ship Leasing Market Market Outlook
The Ship Leasing Market is on track for sustained and significant growth in the upcoming years, propelled by robust global trade expansion, continuous technological advancements, and a strong commitment to adopting sustainable shipping practices. Strategic opportunities abound for market participants to amplify their market share through astute mergers and acquisitions, pioneering technological innovation, and the development of forward-thinking lease offerings. A dedicated focus on delivering sustainable and highly efficient solutions will be paramount for attracting an increasingly environmentally conscious clientele. The future potential of this market is exceptionally promising, particularly within rapidly developing emerging economies that represent substantial growth frontiers.
Ship Leasing Market Segmentation
-
1. Lease Type
- 1.1. Financial Lease
- 1.2. Full-Service Lease
-
2. Application
- 2.1. Container Ships
- 2.2. Bulk Carriers
-
3. Type
- 3.1. Real-Time Lease
- 3.2. Periodic Tenancy
- 3.3. Bareboat Charter
- 3.4. Other Types
Ship Leasing Market Segmentation By Geography
-
1. North America
- 1.1. United States
- 1.2. Canada
-
2. Europe
- 2.1. United Kingdom
- 2.2. France
- 2.3. Germany
- 2.4. Rest of Europe
-
3. Asia Pacific
- 3.1. China
- 3.2. India
- 3.3. Japan
- 3.4. South Korea
- 3.5. Rest of Asia Pacific
-
4. Latin America
- 4.1. Brazil
- 4.2. Rest of Latin America
-
5. Middle East and Africa
- 5.1. United Arab Emirates
- 5.2. Saudi Arabia
- 5.3. South Africa
- 5.4. Rest of Middle East and Africa
Ship Leasing Market Regional Market Share
Geographic Coverage of Ship Leasing Market
Ship Leasing Market REPORT HIGHLIGHTS
| Aspects | Details |
|---|---|
| Study Period | 2020-2034 |
| Base Year | 2025 |
| Estimated Year | 2026 |
| Forecast Period | 2026-2034 |
| Historical Period | 2020-2025 |
| Growth Rate | CAGR of 13.59% from 2020-2034 |
| Segmentation |
|
Table of Contents
- 1. Introduction
- 1.1. Research Scope
- 1.2. Market Segmentation
- 1.3. Research Objective
- 1.4. Definitions and Assumptions
- 2. Executive Summary
- 2.1. Market Snapshot
- 3. Market Dynamics
- 3.1. Market Drivers
- 3.2. Market Restrains
- 3.3. Market Trends
- 3.4. Market Opportunities
- 4. Market Factor Analysis
- 4.1. Porters Five Forces
- 4.1.1. Bargaining Power of Suppliers
- 4.1.2. Bargaining Power of Buyers
- 4.1.3. Threat of New Entrants
- 4.1.4. Threat of Substitutes
- 4.1.5. Competitive Rivalry
- 4.2. PESTEL analysis
- 4.3. BCG Analysis
- 4.3.1. Stars (High Growth, High Market Share)
- 4.3.2. Cash Cows (Low Growth, High Market Share)
- 4.3.3. Question Mark (High Growth, Low Market Share)
- 4.3.4. Dogs (Low Growth, Low Market Share)
- 4.4. Ansoff Matrix Analysis
- 4.5. Supply Chain Analysis
- 4.6. Regulatory Landscape
- 4.7. Current Market Potential and Opportunity Assessment (TAM–SAM–SOM Framework)
- 4.8. PMV Analyst Note
- 4.1. Porters Five Forces
- 5. Market Analysis, Insights and Forecast 2021-2033
- 5.1. Market Analysis, Insights and Forecast - by Lease Type
- 5.1.1. Financial Lease
- 5.1.2. Full-Service Lease
- 5.2. Market Analysis, Insights and Forecast - by Application
- 5.2.1. Container Ships
- 5.2.2. Bulk Carriers
- 5.3. Market Analysis, Insights and Forecast - by Type
- 5.3.1. Real-Time Lease
- 5.3.2. Periodic Tenancy
- 5.3.3. Bareboat Charter
- 5.3.4. Other Types
- 5.4. Market Analysis, Insights and Forecast - by Region
- 5.4.1. North America
- 5.4.2. Europe
- 5.4.3. Asia Pacific
- 5.4.4. Latin America
- 5.4.5. Middle East and Africa
- 5.1. Market Analysis, Insights and Forecast - by Lease Type
- 6. Global Ship Leasing Market Analysis, Insights and Forecast, 2021-2033
- 6.1. Market Analysis, Insights and Forecast - by Lease Type
- 6.1.1. Financial Lease
- 6.1.2. Full-Service Lease
- 6.2. Market Analysis, Insights and Forecast - by Application
- 6.2.1. Container Ships
- 6.2.2. Bulk Carriers
- 6.3. Market Analysis, Insights and Forecast - by Type
- 6.3.1. Real-Time Lease
- 6.3.2. Periodic Tenancy
- 6.3.3. Bareboat Charter
- 6.3.4. Other Types
- 6.1. Market Analysis, Insights and Forecast - by Lease Type
- 7. North America Ship Leasing Market Analysis, Insights and Forecast, 2020-2032
- 7.1. Market Analysis, Insights and Forecast - by Lease Type
- 7.1.1. Financial Lease
- 7.1.2. Full-Service Lease
- 7.2. Market Analysis, Insights and Forecast - by Application
- 7.2.1. Container Ships
- 7.2.2. Bulk Carriers
- 7.3. Market Analysis, Insights and Forecast - by Type
- 7.3.1. Real-Time Lease
- 7.3.2. Periodic Tenancy
- 7.3.3. Bareboat Charter
- 7.3.4. Other Types
- 7.1. Market Analysis, Insights and Forecast - by Lease Type
- 8. Europe Ship Leasing Market Analysis, Insights and Forecast, 2020-2032
- 8.1. Market Analysis, Insights and Forecast - by Lease Type
- 8.1.1. Financial Lease
- 8.1.2. Full-Service Lease
- 8.2. Market Analysis, Insights and Forecast - by Application
- 8.2.1. Container Ships
- 8.2.2. Bulk Carriers
- 8.3. Market Analysis, Insights and Forecast - by Type
- 8.3.1. Real-Time Lease
- 8.3.2. Periodic Tenancy
- 8.3.3. Bareboat Charter
- 8.3.4. Other Types
- 8.1. Market Analysis, Insights and Forecast - by Lease Type
- 9. Asia Pacific Ship Leasing Market Analysis, Insights and Forecast, 2020-2032
- 9.1. Market Analysis, Insights and Forecast - by Lease Type
- 9.1.1. Financial Lease
- 9.1.2. Full-Service Lease
- 9.2. Market Analysis, Insights and Forecast - by Application
- 9.2.1. Container Ships
- 9.2.2. Bulk Carriers
- 9.3. Market Analysis, Insights and Forecast - by Type
- 9.3.1. Real-Time Lease
- 9.3.2. Periodic Tenancy
- 9.3.3. Bareboat Charter
- 9.3.4. Other Types
- 9.1. Market Analysis, Insights and Forecast - by Lease Type
- 10. Latin America Ship Leasing Market Analysis, Insights and Forecast, 2020-2032
- 10.1. Market Analysis, Insights and Forecast - by Lease Type
- 10.1.1. Financial Lease
- 10.1.2. Full-Service Lease
- 10.2. Market Analysis, Insights and Forecast - by Application
- 10.2.1. Container Ships
- 10.2.2. Bulk Carriers
- 10.3. Market Analysis, Insights and Forecast - by Type
- 10.3.1. Real-Time Lease
- 10.3.2. Periodic Tenancy
- 10.3.3. Bareboat Charter
- 10.3.4. Other Types
- 10.1. Market Analysis, Insights and Forecast - by Lease Type
- 11. Middle East and Africa Ship Leasing Market Analysis, Insights and Forecast, 2020-2032
- 11.1. Market Analysis, Insights and Forecast - by Lease Type
- 11.1.1. Financial Lease
- 11.1.2. Full-Service Lease
- 11.2. Market Analysis, Insights and Forecast - by Application
- 11.2.1. Container Ships
- 11.2.2. Bulk Carriers
- 11.3. Market Analysis, Insights and Forecast - by Type
- 11.3.1. Real-Time Lease
- 11.3.2. Periodic Tenancy
- 11.3.3. Bareboat Charter
- 11.3.4. Other Types
- 11.1. Market Analysis, Insights and Forecast - by Lease Type
- 12. Competitive Analysis
- 12.1. Company Profiles
- 12.1.1 ICBC Co Ltd
- 12.1.1.1. Company Overview
- 12.1.1.2. Products
- 12.1.1.3. Company Financials
- 12.1.1.4. SWOT Analysis
- 12.1.2 CMB Financial Leasing CO LTD
- 12.1.2.1. Company Overview
- 12.1.2.2. Products
- 12.1.2.3. Company Financials
- 12.1.2.4. SWOT Analysis
- 12.1.3 Hamburg Commercial Bank AG
- 12.1.3.1. Company Overview
- 12.1.3.2. Products
- 12.1.3.3. Company Financials
- 12.1.3.4. SWOT Analysis
- 12.1.4 Minsheng Financial Leasing Co Ltd
- 12.1.4.1. Company Overview
- 12.1.4.2. Products
- 12.1.4.3. Company Financials
- 12.1.4.4. SWOT Analysis
- 12.1.5 First Ship Lease Trust
- 12.1.5.1. Company Overview
- 12.1.5.2. Products
- 12.1.5.3. Company Financials
- 12.1.5.4. SWOT Analysis
- 12.1.6 MUFG Bank Ltd
- 12.1.6.1. Company Overview
- 12.1.6.2. Products
- 12.1.6.3. Company Financials
- 12.1.6.4. SWOT Analysis
- 12.1.7 Bothra Group
- 12.1.7.1. Company Overview
- 12.1.7.2. Products
- 12.1.7.3. Company Financials
- 12.1.7.4. SWOT Analysis
- 12.1.8 Bank of Communications Financial Leasing Co Ltd
- 12.1.8.1. Company Overview
- 12.1.8.2. Products
- 12.1.8.3. Company Financials
- 12.1.8.4. SWOT Analysis
- 12.1.9 Galbraiths Ltd
- 12.1.9.1. Company Overview
- 12.1.9.2. Products
- 12.1.9.3. Company Financials
- 12.1.9.4. SWOT Analysis
- 12.1.10 A P Møller - Mærsk A/S
- 12.1.10.1. Company Overview
- 12.1.10.2. Products
- 12.1.10.3. Company Financials
- 12.1.10.4. SWOT Analysis
- 12.1.11 Global Ship Lease Inc
- 12.1.11.1. Company Overview
- 12.1.11.2. Products
- 12.1.11.3. Company Financials
- 12.1.11.4. SWOT Analysis
- 12.1.1 ICBC Co Ltd
- 12.2. Market Entropy
- 12.2.1 Company's Key Areas Served
- 12.2.2 Recent Developments
- 12.3. Company Market Share Analysis 2025
- 12.3.1 Top 5 Companies Market Share Analysis
- 12.3.2 Top 3 Companies Market Share Analysis
- 12.4. List of Potential Customers
- 13. Research Methodology
List of Figures
- Figure 1: Global Ship Leasing Market Revenue Breakdown (Million, %) by Region 2025 & 2033
- Figure 2: North America Ship Leasing Market Revenue (Million), by Lease Type 2025 & 2033
- Figure 3: North America Ship Leasing Market Revenue Share (%), by Lease Type 2025 & 2033
- Figure 4: North America Ship Leasing Market Revenue (Million), by Application 2025 & 2033
- Figure 5: North America Ship Leasing Market Revenue Share (%), by Application 2025 & 2033
- Figure 6: North America Ship Leasing Market Revenue (Million), by Type 2025 & 2033
- Figure 7: North America Ship Leasing Market Revenue Share (%), by Type 2025 & 2033
- Figure 8: North America Ship Leasing Market Revenue (Million), by Country 2025 & 2033
- Figure 9: North America Ship Leasing Market Revenue Share (%), by Country 2025 & 2033
- Figure 10: Europe Ship Leasing Market Revenue (Million), by Lease Type 2025 & 2033
- Figure 11: Europe Ship Leasing Market Revenue Share (%), by Lease Type 2025 & 2033
- Figure 12: Europe Ship Leasing Market Revenue (Million), by Application 2025 & 2033
- Figure 13: Europe Ship Leasing Market Revenue Share (%), by Application 2025 & 2033
- Figure 14: Europe Ship Leasing Market Revenue (Million), by Type 2025 & 2033
- Figure 15: Europe Ship Leasing Market Revenue Share (%), by Type 2025 & 2033
- Figure 16: Europe Ship Leasing Market Revenue (Million), by Country 2025 & 2033
- Figure 17: Europe Ship Leasing Market Revenue Share (%), by Country 2025 & 2033
- Figure 18: Asia Pacific Ship Leasing Market Revenue (Million), by Lease Type 2025 & 2033
- Figure 19: Asia Pacific Ship Leasing Market Revenue Share (%), by Lease Type 2025 & 2033
- Figure 20: Asia Pacific Ship Leasing Market Revenue (Million), by Application 2025 & 2033
- Figure 21: Asia Pacific Ship Leasing Market Revenue Share (%), by Application 2025 & 2033
- Figure 22: Asia Pacific Ship Leasing Market Revenue (Million), by Type 2025 & 2033
- Figure 23: Asia Pacific Ship Leasing Market Revenue Share (%), by Type 2025 & 2033
- Figure 24: Asia Pacific Ship Leasing Market Revenue (Million), by Country 2025 & 2033
- Figure 25: Asia Pacific Ship Leasing Market Revenue Share (%), by Country 2025 & 2033
- Figure 26: Latin America Ship Leasing Market Revenue (Million), by Lease Type 2025 & 2033
- Figure 27: Latin America Ship Leasing Market Revenue Share (%), by Lease Type 2025 & 2033
- Figure 28: Latin America Ship Leasing Market Revenue (Million), by Application 2025 & 2033
- Figure 29: Latin America Ship Leasing Market Revenue Share (%), by Application 2025 & 2033
- Figure 30: Latin America Ship Leasing Market Revenue (Million), by Type 2025 & 2033
- Figure 31: Latin America Ship Leasing Market Revenue Share (%), by Type 2025 & 2033
- Figure 32: Latin America Ship Leasing Market Revenue (Million), by Country 2025 & 2033
- Figure 33: Latin America Ship Leasing Market Revenue Share (%), by Country 2025 & 2033
- Figure 34: Middle East and Africa Ship Leasing Market Revenue (Million), by Lease Type 2025 & 2033
- Figure 35: Middle East and Africa Ship Leasing Market Revenue Share (%), by Lease Type 2025 & 2033
- Figure 36: Middle East and Africa Ship Leasing Market Revenue (Million), by Application 2025 & 2033
- Figure 37: Middle East and Africa Ship Leasing Market Revenue Share (%), by Application 2025 & 2033
- Figure 38: Middle East and Africa Ship Leasing Market Revenue (Million), by Type 2025 & 2033
- Figure 39: Middle East and Africa Ship Leasing Market Revenue Share (%), by Type 2025 & 2033
- Figure 40: Middle East and Africa Ship Leasing Market Revenue (Million), by Country 2025 & 2033
- Figure 41: Middle East and Africa Ship Leasing Market Revenue Share (%), by Country 2025 & 2033
List of Tables
- Table 1: Global Ship Leasing Market Revenue Million Forecast, by Lease Type 2020 & 2033
- Table 2: Global Ship Leasing Market Revenue Million Forecast, by Application 2020 & 2033
- Table 3: Global Ship Leasing Market Revenue Million Forecast, by Type 2020 & 2033
- Table 4: Global Ship Leasing Market Revenue Million Forecast, by Region 2020 & 2033
- Table 5: Global Ship Leasing Market Revenue Million Forecast, by Lease Type 2020 & 2033
- Table 6: Global Ship Leasing Market Revenue Million Forecast, by Application 2020 & 2033
- Table 7: Global Ship Leasing Market Revenue Million Forecast, by Type 2020 & 2033
- Table 8: Global Ship Leasing Market Revenue Million Forecast, by Country 2020 & 2033
- Table 9: United States Ship Leasing Market Revenue (Million) Forecast, by Application 2020 & 2033
- Table 10: Canada Ship Leasing Market Revenue (Million) Forecast, by Application 2020 & 2033
- Table 11: Global Ship Leasing Market Revenue Million Forecast, by Lease Type 2020 & 2033
- Table 12: Global Ship Leasing Market Revenue Million Forecast, by Application 2020 & 2033
- Table 13: Global Ship Leasing Market Revenue Million Forecast, by Type 2020 & 2033
- Table 14: Global Ship Leasing Market Revenue Million Forecast, by Country 2020 & 2033
- Table 15: United Kingdom Ship Leasing Market Revenue (Million) Forecast, by Application 2020 & 2033
- Table 16: France Ship Leasing Market Revenue (Million) Forecast, by Application 2020 & 2033
- Table 17: Germany Ship Leasing Market Revenue (Million) Forecast, by Application 2020 & 2033
- Table 18: Rest of Europe Ship Leasing Market Revenue (Million) Forecast, by Application 2020 & 2033
- Table 19: Global Ship Leasing Market Revenue Million Forecast, by Lease Type 2020 & 2033
- Table 20: Global Ship Leasing Market Revenue Million Forecast, by Application 2020 & 2033
- Table 21: Global Ship Leasing Market Revenue Million Forecast, by Type 2020 & 2033
- Table 22: Global Ship Leasing Market Revenue Million Forecast, by Country 2020 & 2033
- Table 23: China Ship Leasing Market Revenue (Million) Forecast, by Application 2020 & 2033
- Table 24: India Ship Leasing Market Revenue (Million) Forecast, by Application 2020 & 2033
- Table 25: Japan Ship Leasing Market Revenue (Million) Forecast, by Application 2020 & 2033
- Table 26: South Korea Ship Leasing Market Revenue (Million) Forecast, by Application 2020 & 2033
- Table 27: Rest of Asia Pacific Ship Leasing Market Revenue (Million) Forecast, by Application 2020 & 2033
- Table 28: Global Ship Leasing Market Revenue Million Forecast, by Lease Type 2020 & 2033
- Table 29: Global Ship Leasing Market Revenue Million Forecast, by Application 2020 & 2033
- Table 30: Global Ship Leasing Market Revenue Million Forecast, by Type 2020 & 2033
- Table 31: Global Ship Leasing Market Revenue Million Forecast, by Country 2020 & 2033
- Table 32: Brazil Ship Leasing Market Revenue (Million) Forecast, by Application 2020 & 2033
- Table 33: Rest of Latin America Ship Leasing Market Revenue (Million) Forecast, by Application 2020 & 2033
- Table 34: Global Ship Leasing Market Revenue Million Forecast, by Lease Type 2020 & 2033
- Table 35: Global Ship Leasing Market Revenue Million Forecast, by Application 2020 & 2033
- Table 36: Global Ship Leasing Market Revenue Million Forecast, by Type 2020 & 2033
- Table 37: Global Ship Leasing Market Revenue Million Forecast, by Country 2020 & 2033
- Table 38: United Arab Emirates Ship Leasing Market Revenue (Million) Forecast, by Application 2020 & 2033
- Table 39: Saudi Arabia Ship Leasing Market Revenue (Million) Forecast, by Application 2020 & 2033
- Table 40: South Africa Ship Leasing Market Revenue (Million) Forecast, by Application 2020 & 2033
- Table 41: Rest of Middle East and Africa Ship Leasing Market Revenue (Million) Forecast, by Application 2020 & 2033
Frequently Asked Questions
1. What is the projected Compound Annual Growth Rate (CAGR) of the Ship Leasing Market?
The projected CAGR is approximately 13.59%.
2. Which companies are prominent players in the Ship Leasing Market?
Key companies in the market include ICBC Co Ltd, CMB Financial Leasing CO LTD, Hamburg Commercial Bank AG, Minsheng Financial Leasing Co Ltd, First Ship Lease Trust, MUFG Bank Ltd, Bothra Group, Bank of Communications Financial Leasing Co Ltd, Galbraiths Ltd, A P Møller - Mærsk A/S, Global Ship Lease Inc.
3. What are the main segments of the Ship Leasing Market?
The market segments include Lease Type, Application, Type.
4. Can you provide details about the market size?
The market size is estimated to be USD 14.79 Million as of 2022.
5. What are some drivers contributing to market growth?
N/A
6. What are the notable trends driving market growth?
Bareboat Charter Segment is Expected to Witness Significant Growth During the Forecast Period.
7. Are there any restraints impacting market growth?
N/A
8. Can you provide examples of recent developments in the market?
N/A
9. What pricing options are available for accessing the report?
Pricing options include single-user, multi-user, and enterprise licenses priced at USD 4750, USD 5250, and USD 8750 respectively.
10. Is the market size provided in terms of value or volume?
The market size is provided in terms of value, measured in Million.
11. Are there any specific market keywords associated with the report?
Yes, the market keyword associated with the report is "Ship Leasing Market," which aids in identifying and referencing the specific market segment covered.
12. How do I determine which pricing option suits my needs best?
The pricing options vary based on user requirements and access needs. Individual users may opt for single-user licenses, while businesses requiring broader access may choose multi-user or enterprise licenses for cost-effective access to the report.
13. Are there any additional resources or data provided in the Ship Leasing Market report?
While the report offers comprehensive insights, it's advisable to review the specific contents or supplementary materials provided to ascertain if additional resources or data are available.
14. How can I stay updated on further developments or reports in the Ship Leasing Market?
To stay informed about further developments, trends, and reports in the Ship Leasing Market, consider subscribing to industry newsletters, following relevant companies and organizations, or regularly checking reputable industry news sources and publications.
Methodology
Step 1 - Identification of Relevant Samples Size from Population Database


Step 2 - Approaches for Defining Global Market Size (Value, Volume* & Price*)

Note*: In applicable scenarios
Step 3 - Data Sources
Primary Research
- Web Analytics
- Survey Reports
- Research Institute
- Latest Research Reports
- Opinion Leaders
Secondary Research
- Annual Reports
- White Paper
- Latest Press Release
- Industry Association
- Paid Database
- Investor Presentations

Step 4 - Data Triangulation
Involves using different sources of information in order to increase the validity of a study
These sources are likely to be stakeholders in a program - participants, other researchers, program staff, other community members, and so on.
Then we put all data in single framework & apply various statistical tools to find out the dynamic on the market.
During the analysis stage, feedback from the stakeholder groups would be compared to determine areas of agreement as well as areas of divergence