

Key Insights
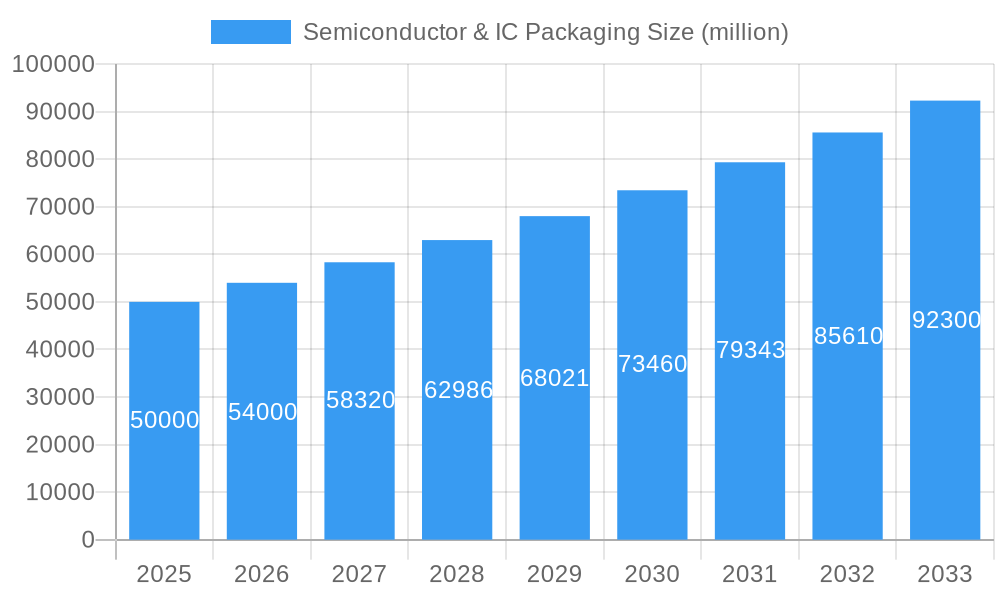
The Semiconductor & IC Packaging market is poised for substantial growth, driven by escalating demand for sophisticated electronic devices across numerous industries. The market, valued at $48.48 billion in the base year 2025, is projected to expand at a Compound Annual Growth Rate (CAGR) of 10.2%, reaching an estimated $100.89 billion by 2033. This trajectory is propelled by key industry drivers such as the proliferation of High-Performance Computing (HPC), the rapid adoption of 5G and IoT technologies, and the increasing implementation of advanced packaging solutions like System-in-Package (SiP) and 3D packaging. These advancements necessitate higher integration densities, superior thermal management, and enhanced miniaturization. While geopolitical uncertainties and supply chain volatility present potential challenges, the market's outlook remains robust, bolstered by ongoing innovation and expanding application frontiers.
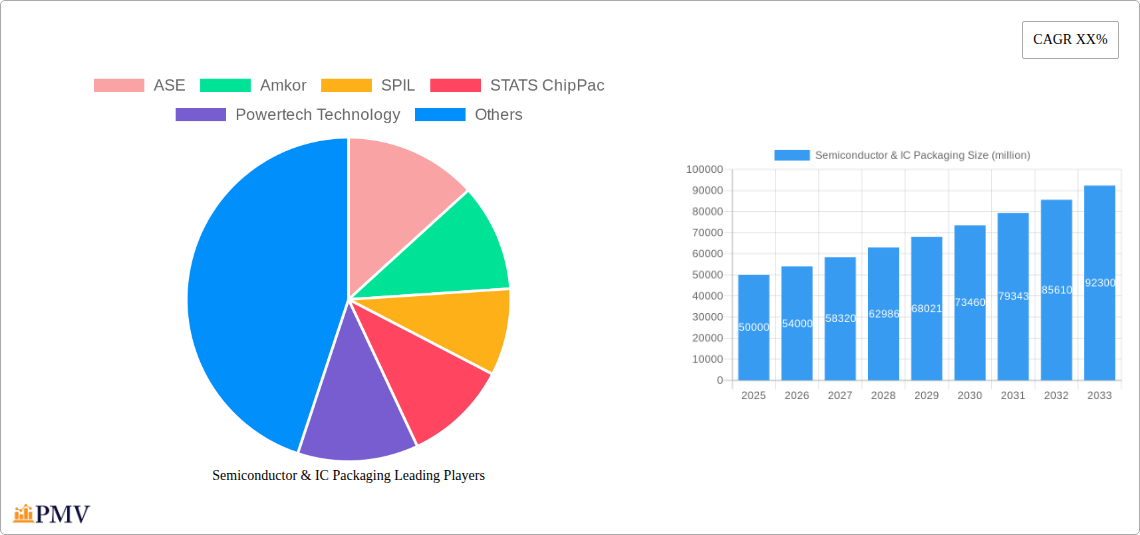
Semiconductor & IC Packaging Market Size (In Billion)
The competitive environment features established leaders, including ASE Technology, Amkor Technology, and SPIL, alongside dynamic emerging companies. Significant regional dominance is observed in North America and Asia-Pacific, with Europe also contributing substantially. Emerging economies in Asia and Latin America present considerable expansion opportunities. Strategic collaborations, mergers, acquisitions, and sustained R&D investment are key strategies employed by companies to maintain a competitive edge and leverage market expansion. Future market success in semiconductor and IC packaging will be dictated by continuous advancements in materials, processes, and design, alongside the ability to meet the evolving requirements of the global electronics sector.
Semiconductor & IC Packaging Company Market Share
Semiconductor & IC Packaging Market Report: 2019-2033
This comprehensive report provides an in-depth analysis of the global semiconductor & IC packaging market, offering invaluable insights for industry stakeholders. Covering the period 2019-2033, with a base year of 2025 and a forecast period of 2025-2033, this report meticulously examines market dynamics, competitive landscapes, and future growth projections. The report details market sizing in millions, offering actionable intelligence to navigate this rapidly evolving sector.
Semiconductor & IC Packaging Market Structure & Competitive Dynamics
This section analyzes the competitive landscape of the semiconductor & IC packaging market, focusing on market concentration, innovation ecosystems, regulatory frameworks, product substitutes, end-user trends, and mergers & acquisitions (M&A) activities. The global market is characterized by a moderately concentrated structure, with a few major players holding significant market share. ASE, Amkor, and SPIL are among the leading companies, collectively controlling an estimated xx% of the market in 2025.
The industry is witnessing significant innovation, driven by advancements in materials science, packaging technologies (e.g., advanced packaging solutions like 3D stacking and system-in-package), and automation. Stringent regulatory frameworks related to environmental sustainability and data security are shaping industry practices. Competition is fierce, with players vying for market share through product differentiation, technological advancements, and strategic acquisitions.
M&A activity has been significant, with deal values totaling over $xx million in the past five years. These activities aim to expand market reach, acquire innovative technologies, and enhance vertical integration. End-user trends in the automotive, consumer electronics, and 5G communication sectors are shaping demand for advanced packaging solutions. The report analyzes these trends and their impact on market growth.
- Market Share (2025 Estimate): ASE (xx%), Amkor (xx%), SPIL (xx%), Others (xx%)
- M&A Deal Value (2019-2024): $xx million
Semiconductor & IC Packaging Industry Trends & Insights
The semiconductor & IC packaging market is experiencing robust growth, driven by several key factors. The increasing demand for advanced electronic devices in various end-use sectors, including smartphones, automobiles, and high-performance computing, is a primary growth driver. The CAGR for the market during the forecast period (2025-2033) is projected to be xx%. Technological advancements, such as the miniaturization of electronic components and the development of advanced packaging technologies, are further fueling market expansion. The growing adoption of 5G technology and the rising demand for artificial intelligence (AI) and Internet of Things (IoT) applications are also contributing significantly to the growth of the market.
Consumer preferences for smaller, more powerful, and energy-efficient devices are driving demand for advanced packaging solutions. However, the market is facing challenges such as fluctuating raw material prices and geopolitical uncertainties. Competitive dynamics are intense, with leading players focusing on innovation, strategic partnerships, and capacity expansion to maintain their market positions. Market penetration of advanced packaging technologies is increasing, with a projected xx% penetration rate by 2033.
Dominant Markets & Segments in Semiconductor & IC Packaging
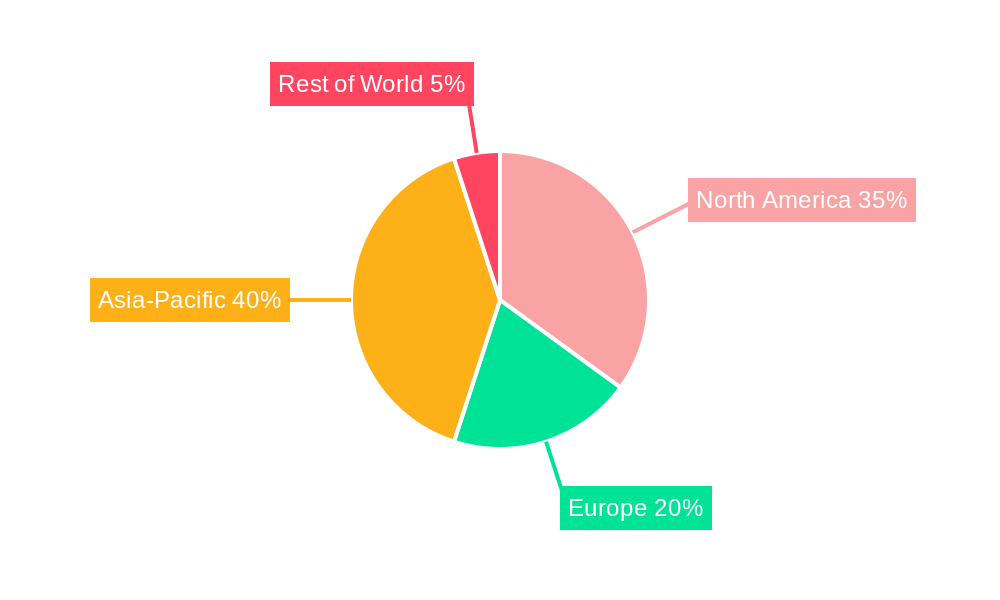
The Asia-Pacific region dominates the global semiconductor & IC packaging market, driven primarily by strong demand from China, South Korea, Taiwan, and Japan. This dominance is attributed to the presence of major semiconductor manufacturers, a robust electronics manufacturing base, and supportive government policies promoting technological advancements in the region.
- Key Drivers in Asia-Pacific:
- Large manufacturing base for electronics
- Strong government support for semiconductor industry development
- High demand from consumer electronics and automotive sectors
- Availability of skilled labor
The report provides a detailed analysis of the regional market shares, identifying key growth opportunities and challenges in each region. The strong growth of the semiconductor industry in China, fuelled by investment in advanced manufacturing capabilities and the expansion of domestic semiconductor companies, is significantly impacting the global market. The market segmentation will also be analyzed based on various factors, including product type, technology, and application.
Semiconductor & IC Packaging Product Innovations
Recent innovations in semiconductor & IC packaging focus on enhancing performance, reducing size, and improving power efficiency. Advancements in materials science have enabled the development of advanced packaging solutions, such as 3D stacking and system-in-package (SiP), which offer significant advantages in terms of miniaturization and improved performance. These innovations cater to the increasing demands for high-performance computing, 5G communication, and AI-enabled devices. This ongoing drive for innovation is shaping competitive dynamics within the market, with companies striving to offer cutting-edge packaging solutions.
Report Segmentation & Scope
The report segments the semiconductor & IC packaging market by packaging type (wire bonding, flip chip, etc.), material (leadframes, substrates), application (consumer electronics, automotive, etc.), and region. Each segment provides growth projections, market size analysis, and competitive dynamics. Market size analysis in 2025 estimates the total market value in millions while projecting growth until 2033. Competitive dynamics within each segment are influenced by technological advancements, pricing strategies, and strategic partnerships.
Key Drivers of Semiconductor & IC Packaging Growth
Several factors are driving the growth of the semiconductor & IC packaging market. The increasing demand for high-performance computing (HPC) systems, fueled by data center expansion and AI development, is a major driver. The proliferation of IoT devices, requiring miniaturization and cost-effective packaging solutions, also fuels market growth. Furthermore, the automotive industry's increasing adoption of advanced driver-assistance systems (ADAS) and autonomous driving technologies is significantly impacting demand. Government initiatives promoting semiconductor manufacturing in several regions are also contributing to market expansion.
Challenges in the Semiconductor & IC Packaging Sector
The semiconductor & IC packaging sector faces challenges such as the volatility of raw material prices, which directly affects production costs and profitability. Supply chain disruptions, exacerbated by geopolitical factors, can lead to production delays and increased costs. The intense competition among established players and the emergence of new entrants pose challenges to market share maintenance and profit margins. Meeting increasingly stringent environmental regulations and maintaining high quality standards are also key industry challenges. These factors impact the market’s overall growth and competitiveness.
Leading Players in the Semiconductor & IC Packaging Market
- ASE
- Amkor
- SPIL
- STATS ChipPAC
- Powertech Technology
- J-devices
- UTAC
- JECT
- ChipMOS
- Chipbond
- KYEC
- STS Semiconductor
- Huatian
- MPI (Carsem)
- Nepes
- FATC
- Walton
- Kyocera
- Unisem
- Nantong Fujitsu Microelectronics
- Hana Micron
- Walton Advanced Engineering
- Signetics
- Intel Corp
- LINGSEN
Key Developments in Semiconductor & IC Packaging Sector
- 2022 Q4: ASE announces a new advanced packaging technology for high-bandwidth memory applications.
- 2023 Q1: Amkor partners with a leading semiconductor manufacturer to expand its capacity in advanced packaging.
- 2023 Q2: SPIL invests in a new facility to meet the growing demand for 3D packaging solutions.
- 2024 Q1: Significant M&A activity reported within the industry. (Specific details will be included in the full report).
Strategic Semiconductor & IC Packaging Market Outlook
The future of the semiconductor & IC packaging market appears promising, driven by ongoing technological advancements, increasing demand from diverse end-use sectors, and supportive government policies. Companies focused on innovation, strategic partnerships, and efficient supply chain management are expected to thrive. The growing adoption of advanced packaging technologies like 3D stacking and system-in-package (SiP) will continue to shape market dynamics. Further expansion into emerging markets and strategic investments in research and development will play a crucial role in determining the future market leaders. The potential for significant growth remains high, particularly in regions with developing semiconductor industries.
Semiconductor & IC Packaging Segmentation
-
1. Application
- 1.1. Telecommunications
- 1.2. Automotive
- 1.3. Aerospace and Defense
- 1.4. Medical Devices
- 1.5. Consumer Electronics
-
2. Types
- 2.1. DIP
- 2.2. SOP
- 2.3. QFP
- 2.4. QFN
- 2.5. BGA
- 2.6. CSP
- 2.7. Others
Semiconductor & IC Packaging Segmentation By Geography
-
1. North America
- 1.1. United States
- 1.2. Canada
- 1.3. Mexico
-
2. South America
- 2.1. Brazil
- 2.2. Argentina
- 2.3. Rest of South America
-
3. Europe
- 3.1. United Kingdom
- 3.2. Germany
- 3.3. France
- 3.4. Italy
- 3.5. Spain
- 3.6. Russia
- 3.7. Benelux
- 3.8. Nordics
- 3.9. Rest of Europe
-
4. Middle East & Africa
- 4.1. Turkey
- 4.2. Israel
- 4.3. GCC
- 4.4. North Africa
- 4.5. South Africa
- 4.6. Rest of Middle East & Africa
-
5. Asia Pacific
- 5.1. China
- 5.2. India
- 5.3. Japan
- 5.4. South Korea
- 5.5. ASEAN
- 5.6. Oceania
- 5.7. Rest of Asia Pacific
Semiconductor & IC Packaging Regional Market Share
Geographic Coverage of Semiconductor & IC Packaging
Semiconductor & IC Packaging REPORT HIGHLIGHTS
| Aspects | Details |
|---|---|
| Study Period | 2020-2034 |
| Base Year | 2025 |
| Estimated Year | 2026 |
| Forecast Period | 2026-2034 |
| Historical Period | 2020-2025 |
| Growth Rate | CAGR of 10.2% from 2020-2034 |
| Segmentation |
|
Table of Contents
- 1. Introduction
- 1.1. Research Scope
- 1.2. Market Segmentation
- 1.3. Research Methodology
- 1.4. Definitions and Assumptions
- 2. Executive Summary
- 2.1. Introduction
- 3. Market Dynamics
- 3.1. Introduction
- 3.2. Market Drivers
- 3.3. Market Restrains
- 3.4. Market Trends
- 4. Market Factor Analysis
- 4.1. Porters Five Forces
- 4.2. Supply/Value Chain
- 4.3. PESTEL analysis
- 4.4. Market Entropy
- 4.5. Patent/Trademark Analysis
- 5. Global Semiconductor & IC Packaging Analysis, Insights and Forecast, 2020-2032
- 5.1. Market Analysis, Insights and Forecast - by Application
- 5.1.1. Telecommunications
- 5.1.2. Automotive
- 5.1.3. Aerospace and Defense
- 5.1.4. Medical Devices
- 5.1.5. Consumer Electronics
- 5.2. Market Analysis, Insights and Forecast - by Types
- 5.2.1. DIP
- 5.2.2. SOP
- 5.2.3. QFP
- 5.2.4. QFN
- 5.2.5. BGA
- 5.2.6. CSP
- 5.2.7. Others
- 5.3. Market Analysis, Insights and Forecast - by Region
- 5.3.1. North America
- 5.3.2. South America
- 5.3.3. Europe
- 5.3.4. Middle East & Africa
- 5.3.5. Asia Pacific
- 5.1. Market Analysis, Insights and Forecast - by Application
- 6. North America Semiconductor & IC Packaging Analysis, Insights and Forecast, 2020-2032
- 6.1. Market Analysis, Insights and Forecast - by Application
- 6.1.1. Telecommunications
- 6.1.2. Automotive
- 6.1.3. Aerospace and Defense
- 6.1.4. Medical Devices
- 6.1.5. Consumer Electronics
- 6.2. Market Analysis, Insights and Forecast - by Types
- 6.2.1. DIP
- 6.2.2. SOP
- 6.2.3. QFP
- 6.2.4. QFN
- 6.2.5. BGA
- 6.2.6. CSP
- 6.2.7. Others
- 6.1. Market Analysis, Insights and Forecast - by Application
- 7. South America Semiconductor & IC Packaging Analysis, Insights and Forecast, 2020-2032
- 7.1. Market Analysis, Insights and Forecast - by Application
- 7.1.1. Telecommunications
- 7.1.2. Automotive
- 7.1.3. Aerospace and Defense
- 7.1.4. Medical Devices
- 7.1.5. Consumer Electronics
- 7.2. Market Analysis, Insights and Forecast - by Types
- 7.2.1. DIP
- 7.2.2. SOP
- 7.2.3. QFP
- 7.2.4. QFN
- 7.2.5. BGA
- 7.2.6. CSP
- 7.2.7. Others
- 7.1. Market Analysis, Insights and Forecast - by Application
- 8. Europe Semiconductor & IC Packaging Analysis, Insights and Forecast, 2020-2032
- 8.1. Market Analysis, Insights and Forecast - by Application
- 8.1.1. Telecommunications
- 8.1.2. Automotive
- 8.1.3. Aerospace and Defense
- 8.1.4. Medical Devices
- 8.1.5. Consumer Electronics
- 8.2. Market Analysis, Insights and Forecast - by Types
- 8.2.1. DIP
- 8.2.2. SOP
- 8.2.3. QFP
- 8.2.4. QFN
- 8.2.5. BGA
- 8.2.6. CSP
- 8.2.7. Others
- 8.1. Market Analysis, Insights and Forecast - by Application
- 9. Middle East & Africa Semiconductor & IC Packaging Analysis, Insights and Forecast, 2020-2032
- 9.1. Market Analysis, Insights and Forecast - by Application
- 9.1.1. Telecommunications
- 9.1.2. Automotive
- 9.1.3. Aerospace and Defense
- 9.1.4. Medical Devices
- 9.1.5. Consumer Electronics
- 9.2. Market Analysis, Insights and Forecast - by Types
- 9.2.1. DIP
- 9.2.2. SOP
- 9.2.3. QFP
- 9.2.4. QFN
- 9.2.5. BGA
- 9.2.6. CSP
- 9.2.7. Others
- 9.1. Market Analysis, Insights and Forecast - by Application
- 10. Asia Pacific Semiconductor & IC Packaging Analysis, Insights and Forecast, 2020-2032
- 10.1. Market Analysis, Insights and Forecast - by Application
- 10.1.1. Telecommunications
- 10.1.2. Automotive
- 10.1.3. Aerospace and Defense
- 10.1.4. Medical Devices
- 10.1.5. Consumer Electronics
- 10.2. Market Analysis, Insights and Forecast - by Types
- 10.2.1. DIP
- 10.2.2. SOP
- 10.2.3. QFP
- 10.2.4. QFN
- 10.2.5. BGA
- 10.2.6. CSP
- 10.2.7. Others
- 10.1. Market Analysis, Insights and Forecast - by Application
- 11. Competitive Analysis
- 11.1. Global Market Share Analysis 2025
- 11.2. Company Profiles
- 11.2.1 ASE
- 11.2.1.1. Overview
- 11.2.1.2. Products
- 11.2.1.3. SWOT Analysis
- 11.2.1.4. Recent Developments
- 11.2.1.5. Financials (Based on Availability)
- 11.2.2 Amkor
- 11.2.2.1. Overview
- 11.2.2.2. Products
- 11.2.2.3. SWOT Analysis
- 11.2.2.4. Recent Developments
- 11.2.2.5. Financials (Based on Availability)
- 11.2.3 SPIL
- 11.2.3.1. Overview
- 11.2.3.2. Products
- 11.2.3.3. SWOT Analysis
- 11.2.3.4. Recent Developments
- 11.2.3.5. Financials (Based on Availability)
- 11.2.4 STATS ChipPac
- 11.2.4.1. Overview
- 11.2.4.2. Products
- 11.2.4.3. SWOT Analysis
- 11.2.4.4. Recent Developments
- 11.2.4.5. Financials (Based on Availability)
- 11.2.5 Powertech Technology
- 11.2.5.1. Overview
- 11.2.5.2. Products
- 11.2.5.3. SWOT Analysis
- 11.2.5.4. Recent Developments
- 11.2.5.5. Financials (Based on Availability)
- 11.2.6 J-devices
- 11.2.6.1. Overview
- 11.2.6.2. Products
- 11.2.6.3. SWOT Analysis
- 11.2.6.4. Recent Developments
- 11.2.6.5. Financials (Based on Availability)
- 11.2.7 UTAC
- 11.2.7.1. Overview
- 11.2.7.2. Products
- 11.2.7.3. SWOT Analysis
- 11.2.7.4. Recent Developments
- 11.2.7.5. Financials (Based on Availability)
- 11.2.8 JECT
- 11.2.8.1. Overview
- 11.2.8.2. Products
- 11.2.8.3. SWOT Analysis
- 11.2.8.4. Recent Developments
- 11.2.8.5. Financials (Based on Availability)
- 11.2.9 ChipMOS
- 11.2.9.1. Overview
- 11.2.9.2. Products
- 11.2.9.3. SWOT Analysis
- 11.2.9.4. Recent Developments
- 11.2.9.5. Financials (Based on Availability)
- 11.2.10 Chipbond
- 11.2.10.1. Overview
- 11.2.10.2. Products
- 11.2.10.3. SWOT Analysis
- 11.2.10.4. Recent Developments
- 11.2.10.5. Financials (Based on Availability)
- 11.2.11 KYEC
- 11.2.11.1. Overview
- 11.2.11.2. Products
- 11.2.11.3. SWOT Analysis
- 11.2.11.4. Recent Developments
- 11.2.11.5. Financials (Based on Availability)
- 11.2.12 STS Semiconductor
- 11.2.12.1. Overview
- 11.2.12.2. Products
- 11.2.12.3. SWOT Analysis
- 11.2.12.4. Recent Developments
- 11.2.12.5. Financials (Based on Availability)
- 11.2.13 Huatian
- 11.2.13.1. Overview
- 11.2.13.2. Products
- 11.2.13.3. SWOT Analysis
- 11.2.13.4. Recent Developments
- 11.2.13.5. Financials (Based on Availability)
- 11.2.14 MPl(Carsem)
- 11.2.14.1. Overview
- 11.2.14.2. Products
- 11.2.14.3. SWOT Analysis
- 11.2.14.4. Recent Developments
- 11.2.14.5. Financials (Based on Availability)
- 11.2.15 Nepes
- 11.2.15.1. Overview
- 11.2.15.2. Products
- 11.2.15.3. SWOT Analysis
- 11.2.15.4. Recent Developments
- 11.2.15.5. Financials (Based on Availability)
- 11.2.16 FATC
- 11.2.16.1. Overview
- 11.2.16.2. Products
- 11.2.16.3. SWOT Analysis
- 11.2.16.4. Recent Developments
- 11.2.16.5. Financials (Based on Availability)
- 11.2.17 Walton
- 11.2.17.1. Overview
- 11.2.17.2. Products
- 11.2.17.3. SWOT Analysis
- 11.2.17.4. Recent Developments
- 11.2.17.5. Financials (Based on Availability)
- 11.2.18 Kyocera
- 11.2.18.1. Overview
- 11.2.18.2. Products
- 11.2.18.3. SWOT Analysis
- 11.2.18.4. Recent Developments
- 11.2.18.5. Financials (Based on Availability)
- 11.2.19 Unisem
- 11.2.19.1. Overview
- 11.2.19.2. Products
- 11.2.19.3. SWOT Analysis
- 11.2.19.4. Recent Developments
- 11.2.19.5. Financials (Based on Availability)
- 11.2.20 NantongFujitsu Microelectronics
- 11.2.20.1. Overview
- 11.2.20.2. Products
- 11.2.20.3. SWOT Analysis
- 11.2.20.4. Recent Developments
- 11.2.20.5. Financials (Based on Availability)
- 11.2.21 Hana Micron
- 11.2.21.1. Overview
- 11.2.21.2. Products
- 11.2.21.3. SWOT Analysis
- 11.2.21.4. Recent Developments
- 11.2.21.5. Financials (Based on Availability)
- 11.2.22 Walton Advanced Engineering
- 11.2.22.1. Overview
- 11.2.22.2. Products
- 11.2.22.3. SWOT Analysis
- 11.2.22.4. Recent Developments
- 11.2.22.5. Financials (Based on Availability)
- 11.2.23 Signetics
- 11.2.23.1. Overview
- 11.2.23.2. Products
- 11.2.23.3. SWOT Analysis
- 11.2.23.4. Recent Developments
- 11.2.23.5. Financials (Based on Availability)
- 11.2.24 Intel Corp
- 11.2.24.1. Overview
- 11.2.24.2. Products
- 11.2.24.3. SWOT Analysis
- 11.2.24.4. Recent Developments
- 11.2.24.5. Financials (Based on Availability)
- 11.2.25 LINGSEN
- 11.2.25.1. Overview
- 11.2.25.2. Products
- 11.2.25.3. SWOT Analysis
- 11.2.25.4. Recent Developments
- 11.2.25.5. Financials (Based on Availability)
- 11.2.1 ASE
List of Figures
- Figure 1: Global Semiconductor & IC Packaging Revenue Breakdown (billion, %) by Region 2025 & 2033
- Figure 2: North America Semiconductor & IC Packaging Revenue (billion), by Application 2025 & 2033
- Figure 3: North America Semiconductor & IC Packaging Revenue Share (%), by Application 2025 & 2033
- Figure 4: North America Semiconductor & IC Packaging Revenue (billion), by Types 2025 & 2033
- Figure 5: North America Semiconductor & IC Packaging Revenue Share (%), by Types 2025 & 2033
- Figure 6: North America Semiconductor & IC Packaging Revenue (billion), by Country 2025 & 2033
- Figure 7: North America Semiconductor & IC Packaging Revenue Share (%), by Country 2025 & 2033
- Figure 8: South America Semiconductor & IC Packaging Revenue (billion), by Application 2025 & 2033
- Figure 9: South America Semiconductor & IC Packaging Revenue Share (%), by Application 2025 & 2033
- Figure 10: South America Semiconductor & IC Packaging Revenue (billion), by Types 2025 & 2033
- Figure 11: South America Semiconductor & IC Packaging Revenue Share (%), by Types 2025 & 2033
- Figure 12: South America Semiconductor & IC Packaging Revenue (billion), by Country 2025 & 2033
- Figure 13: South America Semiconductor & IC Packaging Revenue Share (%), by Country 2025 & 2033
- Figure 14: Europe Semiconductor & IC Packaging Revenue (billion), by Application 2025 & 2033
- Figure 15: Europe Semiconductor & IC Packaging Revenue Share (%), by Application 2025 & 2033
- Figure 16: Europe Semiconductor & IC Packaging Revenue (billion), by Types 2025 & 2033
- Figure 17: Europe Semiconductor & IC Packaging Revenue Share (%), by Types 2025 & 2033
- Figure 18: Europe Semiconductor & IC Packaging Revenue (billion), by Country 2025 & 2033
- Figure 19: Europe Semiconductor & IC Packaging Revenue Share (%), by Country 2025 & 2033
- Figure 20: Middle East & Africa Semiconductor & IC Packaging Revenue (billion), by Application 2025 & 2033
- Figure 21: Middle East & Africa Semiconductor & IC Packaging Revenue Share (%), by Application 2025 & 2033
- Figure 22: Middle East & Africa Semiconductor & IC Packaging Revenue (billion), by Types 2025 & 2033
- Figure 23: Middle East & Africa Semiconductor & IC Packaging Revenue Share (%), by Types 2025 & 2033
- Figure 24: Middle East & Africa Semiconductor & IC Packaging Revenue (billion), by Country 2025 & 2033
- Figure 25: Middle East & Africa Semiconductor & IC Packaging Revenue Share (%), by Country 2025 & 2033
- Figure 26: Asia Pacific Semiconductor & IC Packaging Revenue (billion), by Application 2025 & 2033
- Figure 27: Asia Pacific Semiconductor & IC Packaging Revenue Share (%), by Application 2025 & 2033
- Figure 28: Asia Pacific Semiconductor & IC Packaging Revenue (billion), by Types 2025 & 2033
- Figure 29: Asia Pacific Semiconductor & IC Packaging Revenue Share (%), by Types 2025 & 2033
- Figure 30: Asia Pacific Semiconductor & IC Packaging Revenue (billion), by Country 2025 & 2033
- Figure 31: Asia Pacific Semiconductor & IC Packaging Revenue Share (%), by Country 2025 & 2033
List of Tables
- Table 1: Global Semiconductor & IC Packaging Revenue billion Forecast, by Application 2020 & 2033
- Table 2: Global Semiconductor & IC Packaging Revenue billion Forecast, by Types 2020 & 2033
- Table 3: Global Semiconductor & IC Packaging Revenue billion Forecast, by Region 2020 & 2033
- Table 4: Global Semiconductor & IC Packaging Revenue billion Forecast, by Application 2020 & 2033
- Table 5: Global Semiconductor & IC Packaging Revenue billion Forecast, by Types 2020 & 2033
- Table 6: Global Semiconductor & IC Packaging Revenue billion Forecast, by Country 2020 & 2033
- Table 7: United States Semiconductor & IC Packaging Revenue (billion) Forecast, by Application 2020 & 2033
- Table 8: Canada Semiconductor & IC Packaging Revenue (billion) Forecast, by Application 2020 & 2033
- Table 9: Mexico Semiconductor & IC Packaging Revenue (billion) Forecast, by Application 2020 & 2033
- Table 10: Global Semiconductor & IC Packaging Revenue billion Forecast, by Application 2020 & 2033
- Table 11: Global Semiconductor & IC Packaging Revenue billion Forecast, by Types 2020 & 2033
- Table 12: Global Semiconductor & IC Packaging Revenue billion Forecast, by Country 2020 & 2033
- Table 13: Brazil Semiconductor & IC Packaging Revenue (billion) Forecast, by Application 2020 & 2033
- Table 14: Argentina Semiconductor & IC Packaging Revenue (billion) Forecast, by Application 2020 & 2033
- Table 15: Rest of South America Semiconductor & IC Packaging Revenue (billion) Forecast, by Application 2020 & 2033
- Table 16: Global Semiconductor & IC Packaging Revenue billion Forecast, by Application 2020 & 2033
- Table 17: Global Semiconductor & IC Packaging Revenue billion Forecast, by Types 2020 & 2033
- Table 18: Global Semiconductor & IC Packaging Revenue billion Forecast, by Country 2020 & 2033
- Table 19: United Kingdom Semiconductor & IC Packaging Revenue (billion) Forecast, by Application 2020 & 2033
- Table 20: Germany Semiconductor & IC Packaging Revenue (billion) Forecast, by Application 2020 & 2033
- Table 21: France Semiconductor & IC Packaging Revenue (billion) Forecast, by Application 2020 & 2033
- Table 22: Italy Semiconductor & IC Packaging Revenue (billion) Forecast, by Application 2020 & 2033
- Table 23: Spain Semiconductor & IC Packaging Revenue (billion) Forecast, by Application 2020 & 2033
- Table 24: Russia Semiconductor & IC Packaging Revenue (billion) Forecast, by Application 2020 & 2033
- Table 25: Benelux Semiconductor & IC Packaging Revenue (billion) Forecast, by Application 2020 & 2033
- Table 26: Nordics Semiconductor & IC Packaging Revenue (billion) Forecast, by Application 2020 & 2033
- Table 27: Rest of Europe Semiconductor & IC Packaging Revenue (billion) Forecast, by Application 2020 & 2033
- Table 28: Global Semiconductor & IC Packaging Revenue billion Forecast, by Application 2020 & 2033
- Table 29: Global Semiconductor & IC Packaging Revenue billion Forecast, by Types 2020 & 2033
- Table 30: Global Semiconductor & IC Packaging Revenue billion Forecast, by Country 2020 & 2033
- Table 31: Turkey Semiconductor & IC Packaging Revenue (billion) Forecast, by Application 2020 & 2033
- Table 32: Israel Semiconductor & IC Packaging Revenue (billion) Forecast, by Application 2020 & 2033
- Table 33: GCC Semiconductor & IC Packaging Revenue (billion) Forecast, by Application 2020 & 2033
- Table 34: North Africa Semiconductor & IC Packaging Revenue (billion) Forecast, by Application 2020 & 2033
- Table 35: South Africa Semiconductor & IC Packaging Revenue (billion) Forecast, by Application 2020 & 2033
- Table 36: Rest of Middle East & Africa Semiconductor & IC Packaging Revenue (billion) Forecast, by Application 2020 & 2033
- Table 37: Global Semiconductor & IC Packaging Revenue billion Forecast, by Application 2020 & 2033
- Table 38: Global Semiconductor & IC Packaging Revenue billion Forecast, by Types 2020 & 2033
- Table 39: Global Semiconductor & IC Packaging Revenue billion Forecast, by Country 2020 & 2033
- Table 40: China Semiconductor & IC Packaging Revenue (billion) Forecast, by Application 2020 & 2033
- Table 41: India Semiconductor & IC Packaging Revenue (billion) Forecast, by Application 2020 & 2033
- Table 42: Japan Semiconductor & IC Packaging Revenue (billion) Forecast, by Application 2020 & 2033
- Table 43: South Korea Semiconductor & IC Packaging Revenue (billion) Forecast, by Application 2020 & 2033
- Table 44: ASEAN Semiconductor & IC Packaging Revenue (billion) Forecast, by Application 2020 & 2033
- Table 45: Oceania Semiconductor & IC Packaging Revenue (billion) Forecast, by Application 2020 & 2033
- Table 46: Rest of Asia Pacific Semiconductor & IC Packaging Revenue (billion) Forecast, by Application 2020 & 2033
Frequently Asked Questions
1. What is the projected Compound Annual Growth Rate (CAGR) of the Semiconductor & IC Packaging?
The projected CAGR is approximately 10.2%.
2. Which companies are prominent players in the Semiconductor & IC Packaging?
Key companies in the market include ASE, Amkor, SPIL, STATS ChipPac, Powertech Technology, J-devices, UTAC, JECT, ChipMOS, Chipbond, KYEC, STS Semiconductor, Huatian, MPl(Carsem), Nepes, FATC, Walton, Kyocera, Unisem, NantongFujitsu Microelectronics, Hana Micron, Walton Advanced Engineering, Signetics, Intel Corp, LINGSEN.
3. What are the main segments of the Semiconductor & IC Packaging?
The market segments include Application, Types.
4. Can you provide details about the market size?
The market size is estimated to be USD 48.48 billion as of 2022.
5. What are some drivers contributing to market growth?
N/A
6. What are the notable trends driving market growth?
N/A
7. Are there any restraints impacting market growth?
N/A
8. Can you provide examples of recent developments in the market?
N/A
9. What pricing options are available for accessing the report?
Pricing options include single-user, multi-user, and enterprise licenses priced at USD 3350.00, USD 5025.00, and USD 6700.00 respectively.
10. Is the market size provided in terms of value or volume?
The market size is provided in terms of value, measured in billion.
11. Are there any specific market keywords associated with the report?
Yes, the market keyword associated with the report is "Semiconductor & IC Packaging," which aids in identifying and referencing the specific market segment covered.
12. How do I determine which pricing option suits my needs best?
The pricing options vary based on user requirements and access needs. Individual users may opt for single-user licenses, while businesses requiring broader access may choose multi-user or enterprise licenses for cost-effective access to the report.
13. Are there any additional resources or data provided in the Semiconductor & IC Packaging report?
While the report offers comprehensive insights, it's advisable to review the specific contents or supplementary materials provided to ascertain if additional resources or data are available.
14. How can I stay updated on further developments or reports in the Semiconductor & IC Packaging?
To stay informed about further developments, trends, and reports in the Semiconductor & IC Packaging, consider subscribing to industry newsletters, following relevant companies and organizations, or regularly checking reputable industry news sources and publications.
Methodology
Step 1 - Identification of Relevant Samples Size from Population Database


Step 2 - Approaches for Defining Global Market Size (Value, Volume* & Price*)

Note*: In applicable scenarios
Step 3 - Data Sources
Primary Research
- Web Analytics
- Survey Reports
- Research Institute
- Latest Research Reports
- Opinion Leaders
Secondary Research
- Annual Reports
- White Paper
- Latest Press Release
- Industry Association
- Paid Database
- Investor Presentations

Step 4 - Data Triangulation
Involves using different sources of information in order to increase the validity of a study
These sources are likely to be stakeholders in a program - participants, other researchers, program staff, other community members, and so on.
Then we put all data in single framework & apply various statistical tools to find out the dynamic on the market.
During the analysis stage, feedback from the stakeholder groups would be compared to determine areas of agreement as well as areas of divergence