
Key Insights
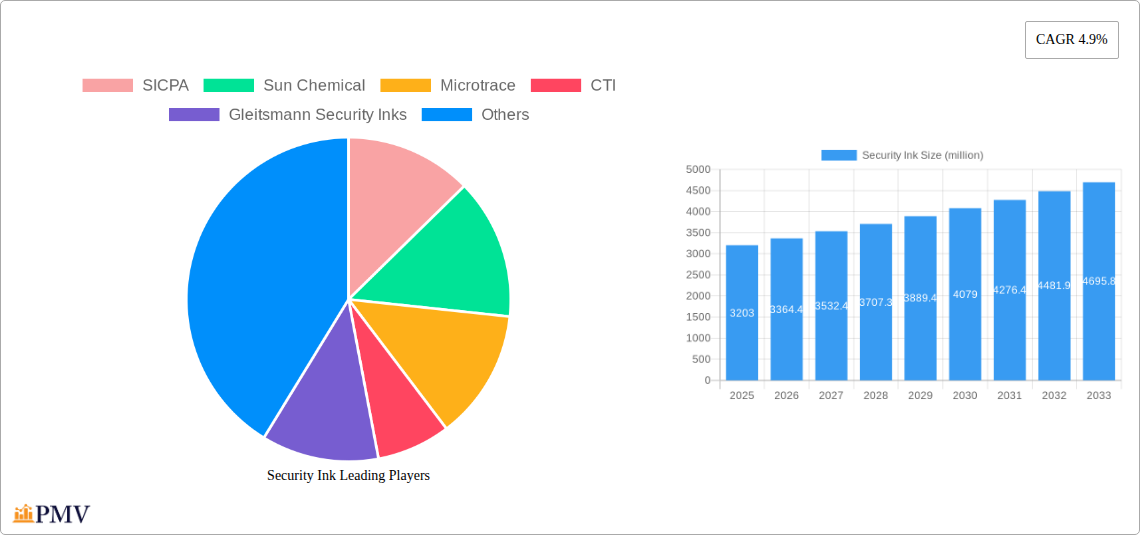
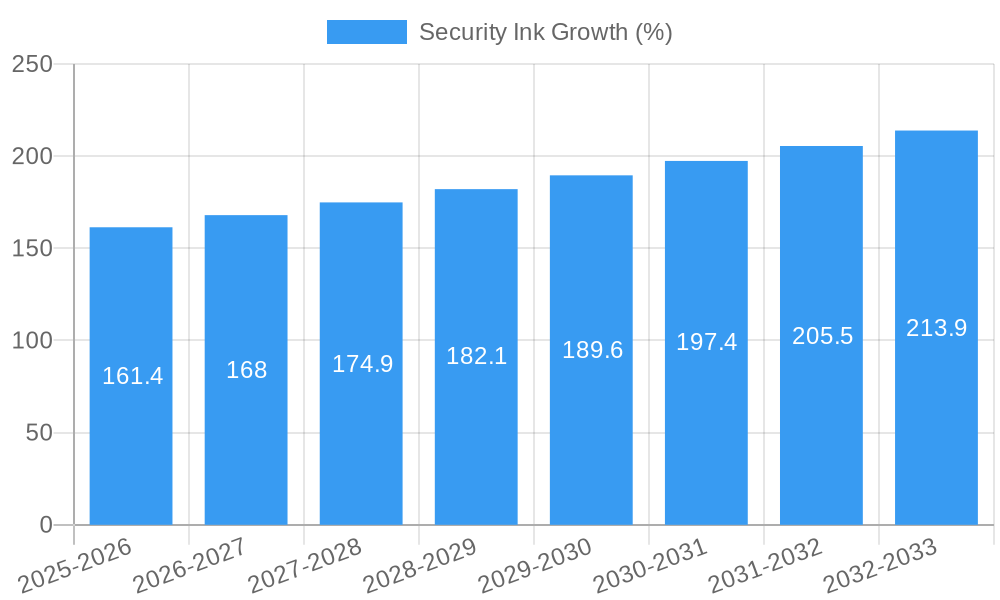
The security ink market, currently valued at approximately $3.203 billion in 2025, is projected to experience robust growth, exhibiting a Compound Annual Growth Rate (CAGR) of 4.9% from 2025 to 2033. This expansion is driven by several key factors. The increasing demand for counterfeit prevention across various sectors, including pharmaceuticals, luxury goods, and currency, is a significant catalyst. Advancements in ink technology, such as the development of more sophisticated anti-counterfeiting features like microtext, metameric inks, and thermochromic inks, are further fueling market growth. Stringent government regulations aimed at combating counterfeiting and enhancing product authenticity globally also contribute significantly to market expansion. Major players like SICPA, Sun Chemical, and Microtrace are leading innovation and market penetration through strategic partnerships and continuous product development. The market is segmented by ink type (e.g., UV inks, infrared inks, thermochromic inks), application (e.g., banknotes, documents, packaging), and geographic region, with regional variations reflecting differing regulatory environments and levels of counterfeiting activity.
The competitive landscape is marked by a mix of established multinational corporations and specialized regional players. While established companies benefit from extensive distribution networks and technological expertise, smaller firms are capitalizing on niche applications and emerging technologies. Future growth will likely be influenced by factors such as the evolving sophistication of counterfeiting techniques, the adoption of digital authentication technologies, and the increasing integration of security inks into smart packaging solutions. The market's ongoing evolution emphasizes the need for continuous innovation and adaptation for companies to maintain a competitive edge. The forecast period (2025-2033) suggests a continued upward trajectory, driven by the persistent need for reliable and advanced security measures in a global economy increasingly susceptible to counterfeiting.
Security Ink Market Report: A Comprehensive Analysis (2019-2033)
This comprehensive report provides a detailed analysis of the global security ink market, offering invaluable insights for stakeholders across the value chain. With a study period spanning 2019-2033, a base year of 2025, and a forecast period of 2025-2033, this report leverages rigorous data analysis and industry expertise to provide a holistic view of this dynamic market. The report delves into market structure, competitive dynamics, industry trends, dominant segments, product innovations, and future growth projections, providing actionable intelligence for strategic decision-making. The total market size is estimated at xx million in 2025, projected to reach xx million by 2033, exhibiting a CAGR of xx%.
Security Ink Market Structure & Competitive Dynamics
The global security ink market exhibits a moderately concentrated structure, with key players such as SICPA, Sun Chemical, and Microtrace holding significant market share. The estimated combined market share of the top five players in 2025 is xx%. Innovation ecosystems are dynamic, driven by advancements in nanotechnology, digital printing, and authentication techniques. Regulatory frameworks, particularly those related to counterfeiting and brand protection, play a crucial role in shaping market growth. Product substitutes, such as holograms and other advanced security features, pose a competitive challenge, forcing ink manufacturers to continuously innovate. End-user trends, including rising demand for secure packaging and documents across various sectors, fuel market growth. M&A activities have been moderate, with deal values totaling approximately xx million in the past five years, reflecting consolidation and expansion strategies within the industry. Examples include [mention specific M&A activities with deal values, if available. Otherwise, state "Specific deal information unavailable"].
- Market Concentration: Moderately Concentrated (Top 5 players hold xx% market share in 2025)
- Innovation Ecosystems: Nanotechnology, Digital Printing, Authentication Techniques
- Regulatory Frameworks: Stringent regulations against counterfeiting drive demand.
- Product Substitutes: Holograms, other advanced security features
- M&A Activity: xx million in deal value over the past five years (Specific details unavailable)
Security Ink Industry Trends & Insights
The security ink market is experiencing robust growth, driven by factors such as increasing instances of counterfeiting across various industries, stringent government regulations aimed at combating fraud, and the rising adoption of advanced security features in sensitive documents and products. Technological disruptions, including the integration of biometric technology and AI for enhanced authentication, are reshaping the landscape. Consumer preferences increasingly favor secure and trustworthy products, creating a strong pull for security inks. The competitive dynamics are characterized by intense rivalry among established players and the emergence of new entrants with innovative solutions. The market is expected to witness significant growth, with a CAGR of xx% during the forecast period (2025-2033). Market penetration in key sectors like pharmaceuticals and banknotes remains high, while expansion into new sectors like electronics and luxury goods is showing promising potential.
Dominant Markets & Segments in Security Ink
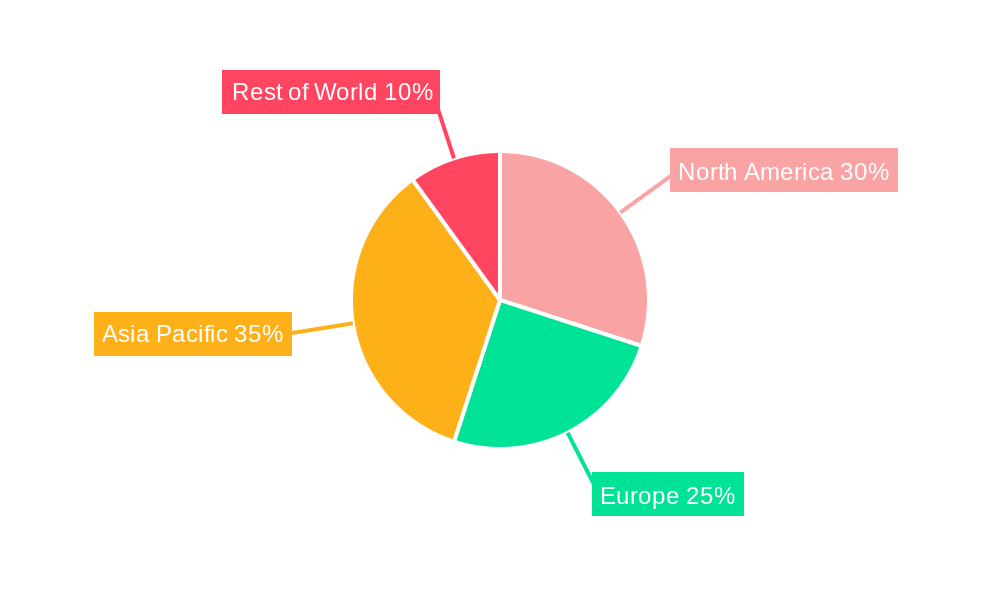
The Asia-Pacific region is currently the dominant market for security inks, driven by factors such as robust economic growth, increasing urbanization, and a burgeoning middle class. China, specifically, plays a significant role, contributing a substantial share to the overall regional demand.
- Key Drivers in Asia-Pacific:
- Rapid Economic Growth
- Rising Urbanization
- Increased Counterfeiting Concerns
- Stringent Government Regulations
- Expanding Middle Class
The dominance of Asia-Pacific stems from factors such as high growth in the packaging industry and increasing government spending on security-related initiatives. However, North America and Europe also hold considerable market share, owing to sophisticated security measures employed across various sectors. This report provides detailed regional and country-level analyses to provide specific market size values for each segment.
Security Ink Product Innovations
Recent innovations in security inks focus on enhanced anti-counterfeiting features, incorporating advanced technologies such as micro-printing, thermochromic inks, and invisible inks. These innovations cater to the growing demand for sophisticated security measures in diverse applications, ranging from banknotes and passports to high-value products and pharmaceuticals. The market is witnessing a trend towards customized ink solutions tailored to specific client needs and security requirements, increasing the competitive advantage of manufacturers offering such services.
Report Segmentation & Scope
This report segments the security ink market based on several key parameters. These include ink type (e.g., UV inks, IR inks, thermochromic inks), application (e.g., banknotes, passports, packaging, pharmaceuticals), and geography. Growth projections, market sizes, and competitive dynamics are provided for each segment to offer a granular view of the market landscape. Detailed analyses of market size and growth potential for each segment within the specified regions are provided within the main report.
Key Drivers of Security Ink Growth
The key drivers of security ink market growth include the escalating global threat of counterfeiting, stricter government regulations on product authenticity, and the expanding use of security features in various applications. Advancements in ink technology, leading to more sophisticated and tamper-evident solutions, also fuel market expansion. The increasing adoption of digital printing technologies further contributes to this growth. The growing demand for secure packaging in the pharmaceutical and food industries, as well as the increasing adoption of security inks in high-value products, are also major drivers.
Challenges in the Security Ink Sector
The security ink sector faces challenges such as high research and development costs associated with developing new and advanced technologies. Fluctuations in raw material prices, which impact the production costs of security inks, also pose a significant challenge. Stringent regulatory compliance procedures can increase operational expenses and restrict market entry. Intense competition and the need to continuously innovate to stay ahead of counterfeiters present additional hurdles.
Leading Players in the Security Ink Market
- SICPA
- Sun Chemical
- Microtrace
- CTI
- Gleitsmann Security Inks
- Petrel
- Kao Collins
- Cronite
- Gans
- Godo
- ANY
- Mingbo
- Pingwei
- Letong Ink
- Wancheng
- FYOTEC
Key Developments in Security Ink Sector
- 2022 Q4: SICPA launched a new generation of security inks with enhanced anti-counterfeiting features.
- 2023 Q1: Sun Chemical acquired a smaller security ink manufacturer, expanding its market reach.
- 2023 Q3: New regulations on product authentication were implemented in [mention specific country/region], stimulating demand for security inks.
- [Add further developments with year/month and impact on market dynamics, if available. Otherwise, state "Further details unavailable."]
Strategic Security Ink Market Outlook
The security ink market is poised for continued growth, driven by ongoing technological advancements, rising security concerns across various sectors, and the increasing adoption of stringent authentication protocols. Strategic opportunities exist for manufacturers to focus on developing innovative, cost-effective, and sustainable security ink solutions. Expansion into emerging markets and strategic partnerships to enhance market reach present significant potential. The market is expected to witness continuous innovation and technological advancements, offering exciting opportunities for both established players and new entrants.
Security Ink Segmentation
-
1. Application
- 1.1. Security Labels
- 1.2. Official Identity Documents
- 1.3. Tax Banderoles
- 1.4. Banknotes
- 1.5. Others
-
2. Types
- 2.1. Offset Inks
- 2.2. Intaglio Inks
- 2.3. Silkscreen Inks
- 2.4. Letterpress Inks
- 2.5. Others
Security Ink Segmentation By Geography
-
1. North America
- 1.1. United States
- 1.2. Canada
- 1.3. Mexico
-
2. South America
- 2.1. Brazil
- 2.2. Argentina
- 2.3. Rest of South America
-
3. Europe
- 3.1. United Kingdom
- 3.2. Germany
- 3.3. France
- 3.4. Italy
- 3.5. Spain
- 3.6. Russia
- 3.7. Benelux
- 3.8. Nordics
- 3.9. Rest of Europe
-
4. Middle East & Africa
- 4.1. Turkey
- 4.2. Israel
- 4.3. GCC
- 4.4. North Africa
- 4.5. South Africa
- 4.6. Rest of Middle East & Africa
-
5. Asia Pacific
- 5.1. China
- 5.2. India
- 5.3. Japan
- 5.4. South Korea
- 5.5. ASEAN
- 5.6. Oceania
- 5.7. Rest of Asia Pacific
Security Ink REPORT HIGHLIGHTS
| Aspects | Details |
|---|---|
| Study Period | 2019-2033 |
| Base Year | 2024 |
| Estimated Year | 2025 |
| Forecast Period | 2025-2033 |
| Historical Period | 2019-2024 |
| Growth Rate | CAGR of 4.9% from 2019-2033 |
| Segmentation |
|
Table of Contents
- 1. Introduction
- 1.1. Research Scope
- 1.2. Market Segmentation
- 1.3. Research Methodology
- 1.4. Definitions and Assumptions
- 2. Executive Summary
- 2.1. Introduction
- 3. Market Dynamics
- 3.1. Introduction
- 3.2. Market Drivers
- 3.3. Market Restrains
- 3.4. Market Trends
- 4. Market Factor Analysis
- 4.1. Porters Five Forces
- 4.2. Supply/Value Chain
- 4.3. PESTEL analysis
- 4.4. Market Entropy
- 4.5. Patent/Trademark Analysis
- 5. Global Security Ink Analysis, Insights and Forecast, 2019-2031
- 5.1. Market Analysis, Insights and Forecast - by Application
- 5.1.1. Security Labels
- 5.1.2. Official Identity Documents
- 5.1.3. Tax Banderoles
- 5.1.4. Banknotes
- 5.1.5. Others
- 5.2. Market Analysis, Insights and Forecast - by Types
- 5.2.1. Offset Inks
- 5.2.2. Intaglio Inks
- 5.2.3. Silkscreen Inks
- 5.2.4. Letterpress Inks
- 5.2.5. Others
- 5.3. Market Analysis, Insights and Forecast - by Region
- 5.3.1. North America
- 5.3.2. South America
- 5.3.3. Europe
- 5.3.4. Middle East & Africa
- 5.3.5. Asia Pacific
- 5.1. Market Analysis, Insights and Forecast - by Application
- 6. North America Security Ink Analysis, Insights and Forecast, 2019-2031
- 6.1. Market Analysis, Insights and Forecast - by Application
- 6.1.1. Security Labels
- 6.1.2. Official Identity Documents
- 6.1.3. Tax Banderoles
- 6.1.4. Banknotes
- 6.1.5. Others
- 6.2. Market Analysis, Insights and Forecast - by Types
- 6.2.1. Offset Inks
- 6.2.2. Intaglio Inks
- 6.2.3. Silkscreen Inks
- 6.2.4. Letterpress Inks
- 6.2.5. Others
- 6.1. Market Analysis, Insights and Forecast - by Application
- 7. South America Security Ink Analysis, Insights and Forecast, 2019-2031
- 7.1. Market Analysis, Insights and Forecast - by Application
- 7.1.1. Security Labels
- 7.1.2. Official Identity Documents
- 7.1.3. Tax Banderoles
- 7.1.4. Banknotes
- 7.1.5. Others
- 7.2. Market Analysis, Insights and Forecast - by Types
- 7.2.1. Offset Inks
- 7.2.2. Intaglio Inks
- 7.2.3. Silkscreen Inks
- 7.2.4. Letterpress Inks
- 7.2.5. Others
- 7.1. Market Analysis, Insights and Forecast - by Application
- 8. Europe Security Ink Analysis, Insights and Forecast, 2019-2031
- 8.1. Market Analysis, Insights and Forecast - by Application
- 8.1.1. Security Labels
- 8.1.2. Official Identity Documents
- 8.1.3. Tax Banderoles
- 8.1.4. Banknotes
- 8.1.5. Others
- 8.2. Market Analysis, Insights and Forecast - by Types
- 8.2.1. Offset Inks
- 8.2.2. Intaglio Inks
- 8.2.3. Silkscreen Inks
- 8.2.4. Letterpress Inks
- 8.2.5. Others
- 8.1. Market Analysis, Insights and Forecast - by Application
- 9. Middle East & Africa Security Ink Analysis, Insights and Forecast, 2019-2031
- 9.1. Market Analysis, Insights and Forecast - by Application
- 9.1.1. Security Labels
- 9.1.2. Official Identity Documents
- 9.1.3. Tax Banderoles
- 9.1.4. Banknotes
- 9.1.5. Others
- 9.2. Market Analysis, Insights and Forecast - by Types
- 9.2.1. Offset Inks
- 9.2.2. Intaglio Inks
- 9.2.3. Silkscreen Inks
- 9.2.4. Letterpress Inks
- 9.2.5. Others
- 9.1. Market Analysis, Insights and Forecast - by Application
- 10. Asia Pacific Security Ink Analysis, Insights and Forecast, 2019-2031
- 10.1. Market Analysis, Insights and Forecast - by Application
- 10.1.1. Security Labels
- 10.1.2. Official Identity Documents
- 10.1.3. Tax Banderoles
- 10.1.4. Banknotes
- 10.1.5. Others
- 10.2. Market Analysis, Insights and Forecast - by Types
- 10.2.1. Offset Inks
- 10.2.2. Intaglio Inks
- 10.2.3. Silkscreen Inks
- 10.2.4. Letterpress Inks
- 10.2.5. Others
- 10.1. Market Analysis, Insights and Forecast - by Application
- 11. Competitive Analysis
- 11.1. Global Market Share Analysis 2024
- 11.2. Company Profiles
- 11.2.1 SICPA
- 11.2.1.1. Overview
- 11.2.1.2. Products
- 11.2.1.3. SWOT Analysis
- 11.2.1.4. Recent Developments
- 11.2.1.5. Financials (Based on Availability)
- 11.2.2 Sun Chemical
- 11.2.2.1. Overview
- 11.2.2.2. Products
- 11.2.2.3. SWOT Analysis
- 11.2.2.4. Recent Developments
- 11.2.2.5. Financials (Based on Availability)
- 11.2.3 Microtrace
- 11.2.3.1. Overview
- 11.2.3.2. Products
- 11.2.3.3. SWOT Analysis
- 11.2.3.4. Recent Developments
- 11.2.3.5. Financials (Based on Availability)
- 11.2.4 CTI
- 11.2.4.1. Overview
- 11.2.4.2. Products
- 11.2.4.3. SWOT Analysis
- 11.2.4.4. Recent Developments
- 11.2.4.5. Financials (Based on Availability)
- 11.2.5 Gleitsmann Security Inks
- 11.2.5.1. Overview
- 11.2.5.2. Products
- 11.2.5.3. SWOT Analysis
- 11.2.5.4. Recent Developments
- 11.2.5.5. Financials (Based on Availability)
- 11.2.6 Petrel
- 11.2.6.1. Overview
- 11.2.6.2. Products
- 11.2.6.3. SWOT Analysis
- 11.2.6.4. Recent Developments
- 11.2.6.5. Financials (Based on Availability)
- 11.2.7 Kao Collins
- 11.2.7.1. Overview
- 11.2.7.2. Products
- 11.2.7.3. SWOT Analysis
- 11.2.7.4. Recent Developments
- 11.2.7.5. Financials (Based on Availability)
- 11.2.8 Cronite
- 11.2.8.1. Overview
- 11.2.8.2. Products
- 11.2.8.3. SWOT Analysis
- 11.2.8.4. Recent Developments
- 11.2.8.5. Financials (Based on Availability)
- 11.2.9 Gans
- 11.2.9.1. Overview
- 11.2.9.2. Products
- 11.2.9.3. SWOT Analysis
- 11.2.9.4. Recent Developments
- 11.2.9.5. Financials (Based on Availability)
- 11.2.10 Godo
- 11.2.10.1. Overview
- 11.2.10.2. Products
- 11.2.10.3. SWOT Analysis
- 11.2.10.4. Recent Developments
- 11.2.10.5. Financials (Based on Availability)
- 11.2.11 ANY
- 11.2.11.1. Overview
- 11.2.11.2. Products
- 11.2.11.3. SWOT Analysis
- 11.2.11.4. Recent Developments
- 11.2.11.5. Financials (Based on Availability)
- 11.2.12 Mingbo
- 11.2.12.1. Overview
- 11.2.12.2. Products
- 11.2.12.3. SWOT Analysis
- 11.2.12.4. Recent Developments
- 11.2.12.5. Financials (Based on Availability)
- 11.2.13 Pingwei
- 11.2.13.1. Overview
- 11.2.13.2. Products
- 11.2.13.3. SWOT Analysis
- 11.2.13.4. Recent Developments
- 11.2.13.5. Financials (Based on Availability)
- 11.2.14 Letong Ink
- 11.2.14.1. Overview
- 11.2.14.2. Products
- 11.2.14.3. SWOT Analysis
- 11.2.14.4. Recent Developments
- 11.2.14.5. Financials (Based on Availability)
- 11.2.15 Wancheng
- 11.2.15.1. Overview
- 11.2.15.2. Products
- 11.2.15.3. SWOT Analysis
- 11.2.15.4. Recent Developments
- 11.2.15.5. Financials (Based on Availability)
- 11.2.16 FYOTEC
- 11.2.16.1. Overview
- 11.2.16.2. Products
- 11.2.16.3. SWOT Analysis
- 11.2.16.4. Recent Developments
- 11.2.16.5. Financials (Based on Availability)
- 11.2.1 SICPA
List of Figures
- Figure 1: Global Security Ink Revenue Breakdown (million, %) by Region 2024 & 2032
- Figure 2: North America Security Ink Revenue (million), by Application 2024 & 2032
- Figure 3: North America Security Ink Revenue Share (%), by Application 2024 & 2032
- Figure 4: North America Security Ink Revenue (million), by Types 2024 & 2032
- Figure 5: North America Security Ink Revenue Share (%), by Types 2024 & 2032
- Figure 6: North America Security Ink Revenue (million), by Country 2024 & 2032
- Figure 7: North America Security Ink Revenue Share (%), by Country 2024 & 2032
- Figure 8: South America Security Ink Revenue (million), by Application 2024 & 2032
- Figure 9: South America Security Ink Revenue Share (%), by Application 2024 & 2032
- Figure 10: South America Security Ink Revenue (million), by Types 2024 & 2032
- Figure 11: South America Security Ink Revenue Share (%), by Types 2024 & 2032
- Figure 12: South America Security Ink Revenue (million), by Country 2024 & 2032
- Figure 13: South America Security Ink Revenue Share (%), by Country 2024 & 2032
- Figure 14: Europe Security Ink Revenue (million), by Application 2024 & 2032
- Figure 15: Europe Security Ink Revenue Share (%), by Application 2024 & 2032
- Figure 16: Europe Security Ink Revenue (million), by Types 2024 & 2032
- Figure 17: Europe Security Ink Revenue Share (%), by Types 2024 & 2032
- Figure 18: Europe Security Ink Revenue (million), by Country 2024 & 2032
- Figure 19: Europe Security Ink Revenue Share (%), by Country 2024 & 2032
- Figure 20: Middle East & Africa Security Ink Revenue (million), by Application 2024 & 2032
- Figure 21: Middle East & Africa Security Ink Revenue Share (%), by Application 2024 & 2032
- Figure 22: Middle East & Africa Security Ink Revenue (million), by Types 2024 & 2032
- Figure 23: Middle East & Africa Security Ink Revenue Share (%), by Types 2024 & 2032
- Figure 24: Middle East & Africa Security Ink Revenue (million), by Country 2024 & 2032
- Figure 25: Middle East & Africa Security Ink Revenue Share (%), by Country 2024 & 2032
- Figure 26: Asia Pacific Security Ink Revenue (million), by Application 2024 & 2032
- Figure 27: Asia Pacific Security Ink Revenue Share (%), by Application 2024 & 2032
- Figure 28: Asia Pacific Security Ink Revenue (million), by Types 2024 & 2032
- Figure 29: Asia Pacific Security Ink Revenue Share (%), by Types 2024 & 2032
- Figure 30: Asia Pacific Security Ink Revenue (million), by Country 2024 & 2032
- Figure 31: Asia Pacific Security Ink Revenue Share (%), by Country 2024 & 2032
List of Tables
- Table 1: Global Security Ink Revenue million Forecast, by Region 2019 & 2032
- Table 2: Global Security Ink Revenue million Forecast, by Application 2019 & 2032
- Table 3: Global Security Ink Revenue million Forecast, by Types 2019 & 2032
- Table 4: Global Security Ink Revenue million Forecast, by Region 2019 & 2032
- Table 5: Global Security Ink Revenue million Forecast, by Application 2019 & 2032
- Table 6: Global Security Ink Revenue million Forecast, by Types 2019 & 2032
- Table 7: Global Security Ink Revenue million Forecast, by Country 2019 & 2032
- Table 8: United States Security Ink Revenue (million) Forecast, by Application 2019 & 2032
- Table 9: Canada Security Ink Revenue (million) Forecast, by Application 2019 & 2032
- Table 10: Mexico Security Ink Revenue (million) Forecast, by Application 2019 & 2032
- Table 11: Global Security Ink Revenue million Forecast, by Application 2019 & 2032
- Table 12: Global Security Ink Revenue million Forecast, by Types 2019 & 2032
- Table 13: Global Security Ink Revenue million Forecast, by Country 2019 & 2032
- Table 14: Brazil Security Ink Revenue (million) Forecast, by Application 2019 & 2032
- Table 15: Argentina Security Ink Revenue (million) Forecast, by Application 2019 & 2032
- Table 16: Rest of South America Security Ink Revenue (million) Forecast, by Application 2019 & 2032
- Table 17: Global Security Ink Revenue million Forecast, by Application 2019 & 2032
- Table 18: Global Security Ink Revenue million Forecast, by Types 2019 & 2032
- Table 19: Global Security Ink Revenue million Forecast, by Country 2019 & 2032
- Table 20: United Kingdom Security Ink Revenue (million) Forecast, by Application 2019 & 2032
- Table 21: Germany Security Ink Revenue (million) Forecast, by Application 2019 & 2032
- Table 22: France Security Ink Revenue (million) Forecast, by Application 2019 & 2032
- Table 23: Italy Security Ink Revenue (million) Forecast, by Application 2019 & 2032
- Table 24: Spain Security Ink Revenue (million) Forecast, by Application 2019 & 2032
- Table 25: Russia Security Ink Revenue (million) Forecast, by Application 2019 & 2032
- Table 26: Benelux Security Ink Revenue (million) Forecast, by Application 2019 & 2032
- Table 27: Nordics Security Ink Revenue (million) Forecast, by Application 2019 & 2032
- Table 28: Rest of Europe Security Ink Revenue (million) Forecast, by Application 2019 & 2032
- Table 29: Global Security Ink Revenue million Forecast, by Application 2019 & 2032
- Table 30: Global Security Ink Revenue million Forecast, by Types 2019 & 2032
- Table 31: Global Security Ink Revenue million Forecast, by Country 2019 & 2032
- Table 32: Turkey Security Ink Revenue (million) Forecast, by Application 2019 & 2032
- Table 33: Israel Security Ink Revenue (million) Forecast, by Application 2019 & 2032
- Table 34: GCC Security Ink Revenue (million) Forecast, by Application 2019 & 2032
- Table 35: North Africa Security Ink Revenue (million) Forecast, by Application 2019 & 2032
- Table 36: South Africa Security Ink Revenue (million) Forecast, by Application 2019 & 2032
- Table 37: Rest of Middle East & Africa Security Ink Revenue (million) Forecast, by Application 2019 & 2032
- Table 38: Global Security Ink Revenue million Forecast, by Application 2019 & 2032
- Table 39: Global Security Ink Revenue million Forecast, by Types 2019 & 2032
- Table 40: Global Security Ink Revenue million Forecast, by Country 2019 & 2032
- Table 41: China Security Ink Revenue (million) Forecast, by Application 2019 & 2032
- Table 42: India Security Ink Revenue (million) Forecast, by Application 2019 & 2032
- Table 43: Japan Security Ink Revenue (million) Forecast, by Application 2019 & 2032
- Table 44: South Korea Security Ink Revenue (million) Forecast, by Application 2019 & 2032
- Table 45: ASEAN Security Ink Revenue (million) Forecast, by Application 2019 & 2032
- Table 46: Oceania Security Ink Revenue (million) Forecast, by Application 2019 & 2032
- Table 47: Rest of Asia Pacific Security Ink Revenue (million) Forecast, by Application 2019 & 2032
Frequently Asked Questions
1. What is the projected Compound Annual Growth Rate (CAGR) of the Security Ink?
The projected CAGR is approximately 4.9%.
2. Which companies are prominent players in the Security Ink?
Key companies in the market include SICPA, Sun Chemical, Microtrace, CTI, Gleitsmann Security Inks, Petrel, Kao Collins, Cronite, Gans, Godo, ANY, Mingbo, Pingwei, Letong Ink, Wancheng, FYOTEC.
3. What are the main segments of the Security Ink?
The market segments include Application, Types.
4. Can you provide details about the market size?
The market size is estimated to be USD 3203 million as of 2022.
5. What are some drivers contributing to market growth?
N/A
6. What are the notable trends driving market growth?
N/A
7. Are there any restraints impacting market growth?
N/A
8. Can you provide examples of recent developments in the market?
N/A
9. What pricing options are available for accessing the report?
Pricing options include single-user, multi-user, and enterprise licenses priced at USD 2900.00, USD 4350.00, and USD 5800.00 respectively.
10. Is the market size provided in terms of value or volume?
The market size is provided in terms of value, measured in million.
11. Are there any specific market keywords associated with the report?
Yes, the market keyword associated with the report is "Security Ink," which aids in identifying and referencing the specific market segment covered.
12. How do I determine which pricing option suits my needs best?
The pricing options vary based on user requirements and access needs. Individual users may opt for single-user licenses, while businesses requiring broader access may choose multi-user or enterprise licenses for cost-effective access to the report.
13. Are there any additional resources or data provided in the Security Ink report?
While the report offers comprehensive insights, it's advisable to review the specific contents or supplementary materials provided to ascertain if additional resources or data are available.
14. How can I stay updated on further developments or reports in the Security Ink?
To stay informed about further developments, trends, and reports in the Security Ink, consider subscribing to industry newsletters, following relevant companies and organizations, or regularly checking reputable industry news sources and publications.
Methodology
Step 1 - Identification of Relevant Samples Size from Population Database


Step 2 - Approaches for Defining Global Market Size (Value, Volume* & Price*)

Note*: In applicable scenarios
Step 3 - Data Sources
Primary Research
- Web Analytics
- Survey Reports
- Research Institute
- Latest Research Reports
- Opinion Leaders
Secondary Research
- Annual Reports
- White Paper
- Latest Press Release
- Industry Association
- Paid Database
- Investor Presentations

Step 4 - Data Triangulation
Involves using different sources of information in order to increase the validity of a study
These sources are likely to be stakeholders in a program - participants, other researchers, program staff, other community members, and so on.
Then we put all data in single framework & apply various statistical tools to find out the dynamic on the market.
During the analysis stage, feedback from the stakeholder groups would be compared to determine areas of agreement as well as areas of divergence


