

Key Insights
The global seals and packing products market is experiencing robust growth, driven by increasing industrial automation, the expansion of the automotive sector, and a rising demand for energy-efficient solutions across various industries. The market's Compound Annual Growth Rate (CAGR) is estimated to be around 5-7% for the forecast period of 2025-2033, based on typical growth rates observed in related industrial sectors. This expansion is fueled by several key trends, including the adoption of advanced materials (like high-performance elastomers and PTFE) offering improved durability and chemical resistance, and the increasing demand for customized sealing solutions tailored to specific applications. Furthermore, stringent environmental regulations promoting leak prevention and reduced emissions are significantly impacting market dynamics, pushing manufacturers to develop eco-friendly seals and packing products. Major players like Mitsubishi Cable Industries Ltd., Trelleborg, and NOK Corporation are investing heavily in research and development to innovate and maintain their competitive edge.
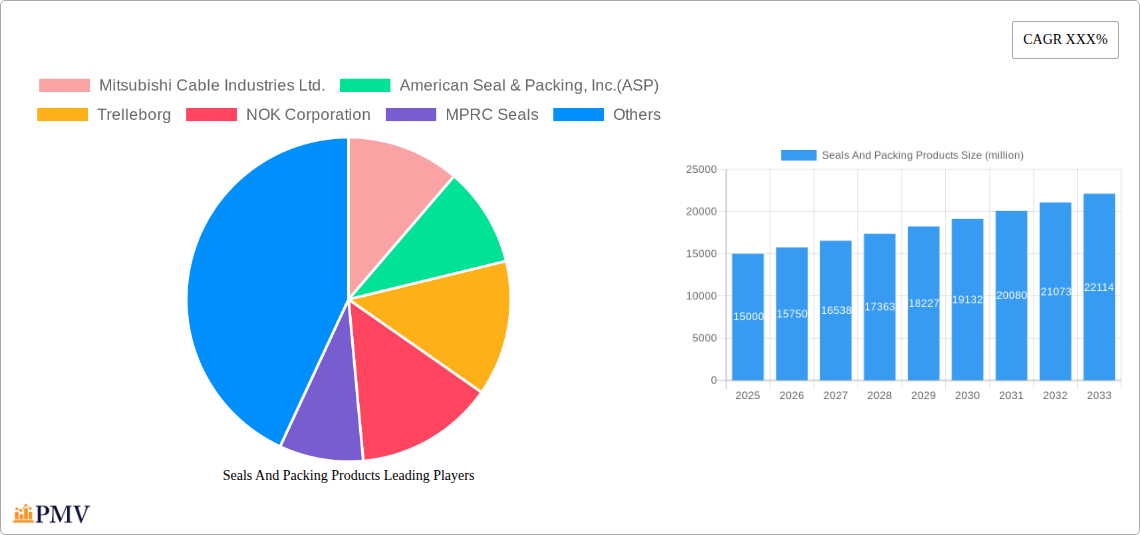
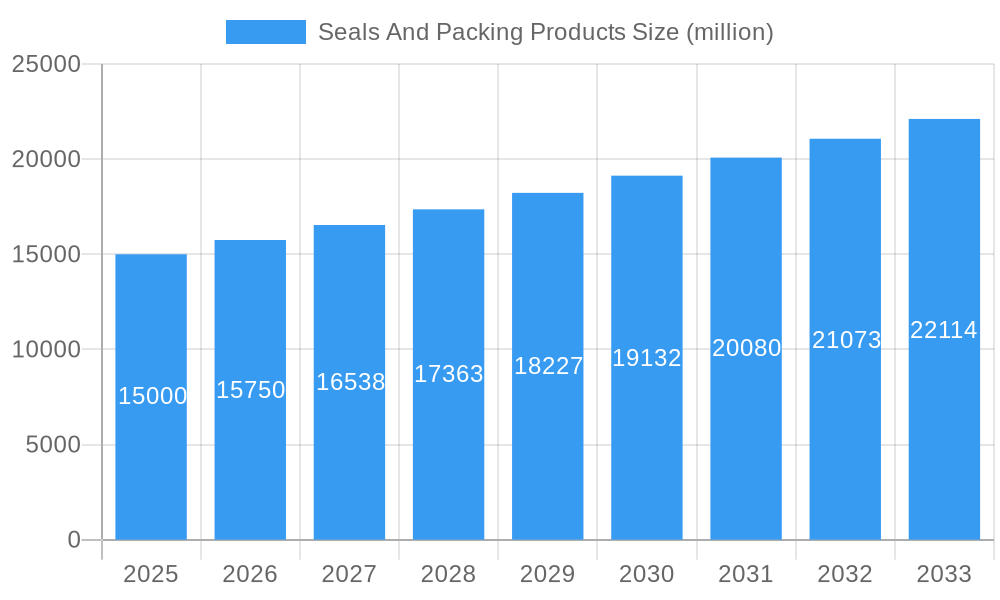
Seals And Packing Products Market Size (In Billion)
Despite the positive outlook, the market faces certain restraints. Fluctuations in raw material prices, particularly rubber and polymers, can impact profitability. Additionally, the market's competitive landscape is intense, with many established and emerging players vying for market share. The market is segmented by product type (O-rings, gaskets, seals, packing), material (rubber, PTFE, metal), application (automotive, industrial machinery, aerospace), and region. While precise regional breakdowns aren't available, North America and Europe are expected to hold significant market share due to established industrial infrastructure and high technological advancements. The projected market size in 2025 is estimated at $15 billion, and is expected to grow steadily until 2033, reaching approximately $25 billion, reflecting the projected CAGR.
Seals And Packing Products Company Market Share
Seals and Packing Products Market Report: 2019-2033
This comprehensive report provides an in-depth analysis of the global seals and packing products market, offering invaluable insights for businesses operating within this dynamic sector. With a study period spanning 2019-2033, a base year of 2025, and an estimated year of 2025, this report projects market trends up to 2033, offering actionable intelligence for strategic decision-making. The report analyzes market size (in millions), CAGR, and key market dynamics, offering critical data for navigating the competitive landscape.
Seals And Packing Products Market Structure & Competitive Dynamics
The global seals and packing products market exhibits a moderately concentrated structure, with a handful of multinational corporations holding significant market share. Mitsubishi Cable Industries Ltd., Trelleborg, NOK Corporation, and American Seal & Packing, Inc.(ASP) are key players, collectively accounting for an estimated xx million in revenue and approximately xx% of the global market share in 2025. The market is characterized by ongoing innovation, particularly in materials science and manufacturing processes, driving the development of high-performance seals for demanding applications. Regulatory frameworks, including those related to environmental sustainability and product safety, significantly influence market dynamics. The presence of substitute materials, such as advanced polymers and composites, presents a competitive challenge to traditional sealing technologies. End-user trends towards automation and miniaturization are driving demand for smaller, more efficient seals. Mergers and acquisitions (M&A) activity has been moderate in recent years, with deal values averaging xx million per transaction. Notable M&A activities include [mention specific examples if available, otherwise replace with "strategic partnerships and technology licensing agreements"].
Seals And Packing Products Industry Trends & Insights
The global seals and packing products market is projected to witness robust growth, with a Compound Annual Growth Rate (CAGR) of xx% during the forecast period (2025-2033). This growth is fueled by several factors, including the rising demand across diverse end-use sectors such as automotive, aerospace, oil and gas, and industrial machinery. Technological advancements, such as the development of advanced sealing materials with enhanced durability and performance characteristics, are significantly impacting the market. Consumer preferences are shifting towards environmentally friendly and sustainable sealing solutions, prompting manufacturers to develop biodegradable and recyclable products. Intensifying competition is driving innovation and price optimization, benefiting end-users. Market penetration of advanced sealing technologies, like elastomer seals and PTFE seals, is increasing steadily, reaching approximately xx% in 2025.
Dominant Markets & Segments in Seals And Packing Products
The North American region currently holds the dominant position in the global seals and packing products market, driven by a strong industrial base, high technological adoption rates, and significant investments in infrastructure projects. Key drivers contributing to North America's dominance include:
- Robust economic growth and industrial expansion.
- Favorable government regulations supporting industrial development.
- High investments in research and development (R&D) for advanced sealing technologies.
Within North America, the United States holds a significant market share due to its substantial manufacturing sector and presence of leading seal manufacturers. Other regions, including Europe and Asia-Pacific, are experiencing significant growth, driven by increasing industrialization and infrastructure development in emerging economies.
Seals And Packing Products Product Innovations
Recent years have witnessed significant innovations in seals and packing products, focusing on improved durability, increased efficiency, and enhanced sustainability. The development of high-performance elastomers, advanced polymer blends, and innovative designs has expanded the applicability of seals across diverse industries. This includes the emergence of smart seals, incorporating sensors for real-time monitoring and predictive maintenance, catering to the growing demand for intelligent systems. These advancements contribute to significant competitive advantages for manufacturers, enabling them to offer superior products and services to their customers.
Report Segmentation & Scope
This report segments the seals and packing products market based on material type (e.g., rubber, PTFE, metal), product type (e.g., O-rings, gaskets, seals), end-use industry (e.g., automotive, aerospace, oil & gas), and geography. Each segment is analyzed extensively, providing detailed market size estimations, growth projections, and competitive analysis. For example, the rubber segment is expected to maintain its significant market share due to its cost-effectiveness and versatility, while the PTFE segment is projected to witness substantial growth due to its superior chemical resistance and high-temperature capabilities. Growth projections vary significantly across segments based on underlying industry dynamics and technological advancements.
Key Drivers of Seals And Packing Products Growth
Growth in the seals and packing products market is largely driven by technological advancements leading to superior performance materials, increased demand from the automotive and aerospace industries, and expansion of the oil and gas sector. Stringent regulatory requirements emphasizing safety and environmental compliance are also significant drivers, stimulating innovation in eco-friendly sealing solutions. Furthermore, expanding infrastructure projects globally, particularly in emerging economies, contribute significantly to increased demand.
Challenges in the Seals And Packing Products Sector
The seals and packing products sector faces challenges such as fluctuating raw material prices, increasing competition from low-cost manufacturers, and maintaining stringent quality standards. Supply chain disruptions and geopolitical uncertainties pose additional risks, impacting production and delivery schedules. Regulatory compliance requirements can add to production costs and necessitate considerable investments in testing and certification. These factors can collectively impact profitability and market growth.
Leading Players in the Seals And Packing Products Market
- Mitsubishi Cable Industries Ltd.
- American Seal & Packing, Inc.(ASP)
- Trelleborg
- NOK Corporation
- MPRC Seals
- GMN
- Crane Engineering
- T-LON
Key Developments in Seals And Packing Products Sector
- 2022 Q4: Trelleborg launched a new range of high-performance seals for electric vehicles.
- 2023 Q1: NOK Corporation announced a strategic partnership to develop advanced sealing materials for aerospace applications.
- 2023 Q3: American Seal & Packing, Inc. acquired a smaller competitor, expanding its market reach.
- [Add more if available; otherwise, use “Further key developments are detailed within the full report.”]
Strategic Seals And Packing Products Market Outlook
The seals and packing products market presents significant growth potential in the coming years, driven by ongoing technological advancements, increased demand from diverse industrial sectors, and a focus on sustainable solutions. Strategic opportunities exist for companies to invest in R&D, expand their product portfolios, and explore new market segments. Emphasis on innovation in materials science and manufacturing processes will be crucial for maintaining a competitive edge in this dynamic market. Companies that can effectively address the challenges posed by supply chain disruptions, regulatory compliance, and competitive pressures will be best positioned to capitalize on future growth opportunities.
Seals And Packing Products Segmentation
-
1. Application
- 1.1. Vacuum and Semiconductor Equipment
- 1.2. Automotive
- 1.3. Construction Machinery and Hydraulic Equipment
- 1.4. Pneumatic Equipment
- 1.5. General Industrial Instrument
- 1.6. Others
-
2. Type
- 2.1. Oil Seals
- 2.2. Packings
- 2.3. O Rings
- 2.4. Soft Metal
- 2.5. Seal Washers
- 2.6. Mechanical Seals
- 2.7. Lip Seals
- 2.8. Segment Seals
- 2.9. Brush Seals
- 2.10. Others
Seals And Packing Products Segmentation By Geography
-
1. North America
- 1.1. United States
- 1.2. Canada
- 1.3. Mexico
-
2. South America
- 2.1. Brazil
- 2.2. Argentina
- 2.3. Rest of South America
-
3. Europe
- 3.1. United Kingdom
- 3.2. Germany
- 3.3. France
- 3.4. Italy
- 3.5. Spain
- 3.6. Russia
- 3.7. Benelux
- 3.8. Nordics
- 3.9. Rest of Europe
-
4. Middle East & Africa
- 4.1. Turkey
- 4.2. Israel
- 4.3. GCC
- 4.4. North Africa
- 4.5. South Africa
- 4.6. Rest of Middle East & Africa
-
5. Asia Pacific
- 5.1. China
- 5.2. India
- 5.3. Japan
- 5.4. South Korea
- 5.5. ASEAN
- 5.6. Oceania
- 5.7. Rest of Asia Pacific

Seals And Packing Products Regional Market Share
Geographic Coverage of Seals And Packing Products
Seals And Packing Products REPORT HIGHLIGHTS
| Aspects | Details |
|---|---|
| Study Period | 2020-2034 |
| Base Year | 2025 |
| Estimated Year | 2026 |
| Forecast Period | 2026-2034 |
| Historical Period | 2020-2025 |
| Growth Rate | CAGR of XXX% from 2020-2034 |
| Segmentation |
|
Table of Contents
- 1. Introduction
- 1.1. Research Scope
- 1.2. Market Segmentation
- 1.3. Research Methodology
- 1.4. Definitions and Assumptions
- 2. Executive Summary
- 2.1. Introduction
- 3. Market Dynamics
- 3.1. Introduction
- 3.2. Market Drivers
- 3.3. Market Restrains
- 3.4. Market Trends
- 4. Market Factor Analysis
- 4.1. Porters Five Forces
- 4.2. Supply/Value Chain
- 4.3. PESTEL analysis
- 4.4. Market Entropy
- 4.5. Patent/Trademark Analysis
- 5. Global Seals And Packing Products Analysis, Insights and Forecast, 2020-2032
- 5.1. Market Analysis, Insights and Forecast - by Application
- 5.1.1. Vacuum and Semiconductor Equipment
- 5.1.2. Automotive
- 5.1.3. Construction Machinery and Hydraulic Equipment
- 5.1.4. Pneumatic Equipment
- 5.1.5. General Industrial Instrument
- 5.1.6. Others
- 5.2. Market Analysis, Insights and Forecast - by Type
- 5.2.1. Oil Seals
- 5.2.2. Packings
- 5.2.3. O Rings
- 5.2.4. Soft Metal
- 5.2.5. Seal Washers
- 5.2.6. Mechanical Seals
- 5.2.7. Lip Seals
- 5.2.8. Segment Seals
- 5.2.9. Brush Seals
- 5.2.10. Others
- 5.3. Market Analysis, Insights and Forecast - by Region
- 5.3.1. North America
- 5.3.2. South America
- 5.3.3. Europe
- 5.3.4. Middle East & Africa
- 5.3.5. Asia Pacific
- 5.1. Market Analysis, Insights and Forecast - by Application
- 6. North America Seals And Packing Products Analysis, Insights and Forecast, 2020-2032
- 6.1. Market Analysis, Insights and Forecast - by Application
- 6.1.1. Vacuum and Semiconductor Equipment
- 6.1.2. Automotive
- 6.1.3. Construction Machinery and Hydraulic Equipment
- 6.1.4. Pneumatic Equipment
- 6.1.5. General Industrial Instrument
- 6.1.6. Others
- 6.2. Market Analysis, Insights and Forecast - by Type
- 6.2.1. Oil Seals
- 6.2.2. Packings
- 6.2.3. O Rings
- 6.2.4. Soft Metal
- 6.2.5. Seal Washers
- 6.2.6. Mechanical Seals
- 6.2.7. Lip Seals
- 6.2.8. Segment Seals
- 6.2.9. Brush Seals
- 6.2.10. Others
- 6.1. Market Analysis, Insights and Forecast - by Application
- 7. South America Seals And Packing Products Analysis, Insights and Forecast, 2020-2032
- 7.1. Market Analysis, Insights and Forecast - by Application
- 7.1.1. Vacuum and Semiconductor Equipment
- 7.1.2. Automotive
- 7.1.3. Construction Machinery and Hydraulic Equipment
- 7.1.4. Pneumatic Equipment
- 7.1.5. General Industrial Instrument
- 7.1.6. Others
- 7.2. Market Analysis, Insights and Forecast - by Type
- 7.2.1. Oil Seals
- 7.2.2. Packings
- 7.2.3. O Rings
- 7.2.4. Soft Metal
- 7.2.5. Seal Washers
- 7.2.6. Mechanical Seals
- 7.2.7. Lip Seals
- 7.2.8. Segment Seals
- 7.2.9. Brush Seals
- 7.2.10. Others
- 7.1. Market Analysis, Insights and Forecast - by Application
- 8. Europe Seals And Packing Products Analysis, Insights and Forecast, 2020-2032
- 8.1. Market Analysis, Insights and Forecast - by Application
- 8.1.1. Vacuum and Semiconductor Equipment
- 8.1.2. Automotive
- 8.1.3. Construction Machinery and Hydraulic Equipment
- 8.1.4. Pneumatic Equipment
- 8.1.5. General Industrial Instrument
- 8.1.6. Others
- 8.2. Market Analysis, Insights and Forecast - by Type
- 8.2.1. Oil Seals
- 8.2.2. Packings
- 8.2.3. O Rings
- 8.2.4. Soft Metal
- 8.2.5. Seal Washers
- 8.2.6. Mechanical Seals
- 8.2.7. Lip Seals
- 8.2.8. Segment Seals
- 8.2.9. Brush Seals
- 8.2.10. Others
- 8.1. Market Analysis, Insights and Forecast - by Application
- 9. Middle East & Africa Seals And Packing Products Analysis, Insights and Forecast, 2020-2032
- 9.1. Market Analysis, Insights and Forecast - by Application
- 9.1.1. Vacuum and Semiconductor Equipment
- 9.1.2. Automotive
- 9.1.3. Construction Machinery and Hydraulic Equipment
- 9.1.4. Pneumatic Equipment
- 9.1.5. General Industrial Instrument
- 9.1.6. Others
- 9.2. Market Analysis, Insights and Forecast - by Type
- 9.2.1. Oil Seals
- 9.2.2. Packings
- 9.2.3. O Rings
- 9.2.4. Soft Metal
- 9.2.5. Seal Washers
- 9.2.6. Mechanical Seals
- 9.2.7. Lip Seals
- 9.2.8. Segment Seals
- 9.2.9. Brush Seals
- 9.2.10. Others
- 9.1. Market Analysis, Insights and Forecast - by Application
- 10. Asia Pacific Seals And Packing Products Analysis, Insights and Forecast, 2020-2032
- 10.1. Market Analysis, Insights and Forecast - by Application
- 10.1.1. Vacuum and Semiconductor Equipment
- 10.1.2. Automotive
- 10.1.3. Construction Machinery and Hydraulic Equipment
- 10.1.4. Pneumatic Equipment
- 10.1.5. General Industrial Instrument
- 10.1.6. Others
- 10.2. Market Analysis, Insights and Forecast - by Type
- 10.2.1. Oil Seals
- 10.2.2. Packings
- 10.2.3. O Rings
- 10.2.4. Soft Metal
- 10.2.5. Seal Washers
- 10.2.6. Mechanical Seals
- 10.2.7. Lip Seals
- 10.2.8. Segment Seals
- 10.2.9. Brush Seals
- 10.2.10. Others
- 10.1. Market Analysis, Insights and Forecast - by Application
- 11. Competitive Analysis
- 11.1. Global Market Share Analysis 2025
- 11.2. Company Profiles
- 11.2.1 Mitsubishi Cable Industries Ltd.
- 11.2.1.1. Overview
- 11.2.1.2. Products
- 11.2.1.3. SWOT Analysis
- 11.2.1.4. Recent Developments
- 11.2.1.5. Financials (Based on Availability)
- 11.2.2 American Seal & Packing Inc.(ASP)
- 11.2.2.1. Overview
- 11.2.2.2. Products
- 11.2.2.3. SWOT Analysis
- 11.2.2.4. Recent Developments
- 11.2.2.5. Financials (Based on Availability)
- 11.2.3 Trelleborg
- 11.2.3.1. Overview
- 11.2.3.2. Products
- 11.2.3.3. SWOT Analysis
- 11.2.3.4. Recent Developments
- 11.2.3.5. Financials (Based on Availability)
- 11.2.4 NOK Corporation
- 11.2.4.1. Overview
- 11.2.4.2. Products
- 11.2.4.3. SWOT Analysis
- 11.2.4.4. Recent Developments
- 11.2.4.5. Financials (Based on Availability)
- 11.2.5 MPRC Seals
- 11.2.5.1. Overview
- 11.2.5.2. Products
- 11.2.5.3. SWOT Analysis
- 11.2.5.4. Recent Developments
- 11.2.5.5. Financials (Based on Availability)
- 11.2.6 GMN
- 11.2.6.1. Overview
- 11.2.6.2. Products
- 11.2.6.3. SWOT Analysis
- 11.2.6.4. Recent Developments
- 11.2.6.5. Financials (Based on Availability)
- 11.2.7 Crane Engineering
- 11.2.7.1. Overview
- 11.2.7.2. Products
- 11.2.7.3. SWOT Analysis
- 11.2.7.4. Recent Developments
- 11.2.7.5. Financials (Based on Availability)
- 11.2.8 T-LON
- 11.2.8.1. Overview
- 11.2.8.2. Products
- 11.2.8.3. SWOT Analysis
- 11.2.8.4. Recent Developments
- 11.2.8.5. Financials (Based on Availability)
- 11.2.1 Mitsubishi Cable Industries Ltd.
List of Figures
- Figure 1: Global Seals And Packing Products Revenue Breakdown (million, %) by Region 2025 & 2033
- Figure 2: North America Seals And Packing Products Revenue (million), by Application 2025 & 2033
- Figure 3: North America Seals And Packing Products Revenue Share (%), by Application 2025 & 2033
- Figure 4: North America Seals And Packing Products Revenue (million), by Type 2025 & 2033
- Figure 5: North America Seals And Packing Products Revenue Share (%), by Type 2025 & 2033
- Figure 6: North America Seals And Packing Products Revenue (million), by Country 2025 & 2033
- Figure 7: North America Seals And Packing Products Revenue Share (%), by Country 2025 & 2033
- Figure 8: South America Seals And Packing Products Revenue (million), by Application 2025 & 2033
- Figure 9: South America Seals And Packing Products Revenue Share (%), by Application 2025 & 2033
- Figure 10: South America Seals And Packing Products Revenue (million), by Type 2025 & 2033
- Figure 11: South America Seals And Packing Products Revenue Share (%), by Type 2025 & 2033
- Figure 12: South America Seals And Packing Products Revenue (million), by Country 2025 & 2033
- Figure 13: South America Seals And Packing Products Revenue Share (%), by Country 2025 & 2033
- Figure 14: Europe Seals And Packing Products Revenue (million), by Application 2025 & 2033
- Figure 15: Europe Seals And Packing Products Revenue Share (%), by Application 2025 & 2033
- Figure 16: Europe Seals And Packing Products Revenue (million), by Type 2025 & 2033
- Figure 17: Europe Seals And Packing Products Revenue Share (%), by Type 2025 & 2033
- Figure 18: Europe Seals And Packing Products Revenue (million), by Country 2025 & 2033
- Figure 19: Europe Seals And Packing Products Revenue Share (%), by Country 2025 & 2033
- Figure 20: Middle East & Africa Seals And Packing Products Revenue (million), by Application 2025 & 2033
- Figure 21: Middle East & Africa Seals And Packing Products Revenue Share (%), by Application 2025 & 2033
- Figure 22: Middle East & Africa Seals And Packing Products Revenue (million), by Type 2025 & 2033
- Figure 23: Middle East & Africa Seals And Packing Products Revenue Share (%), by Type 2025 & 2033
- Figure 24: Middle East & Africa Seals And Packing Products Revenue (million), by Country 2025 & 2033
- Figure 25: Middle East & Africa Seals And Packing Products Revenue Share (%), by Country 2025 & 2033
- Figure 26: Asia Pacific Seals And Packing Products Revenue (million), by Application 2025 & 2033
- Figure 27: Asia Pacific Seals And Packing Products Revenue Share (%), by Application 2025 & 2033
- Figure 28: Asia Pacific Seals And Packing Products Revenue (million), by Type 2025 & 2033
- Figure 29: Asia Pacific Seals And Packing Products Revenue Share (%), by Type 2025 & 2033
- Figure 30: Asia Pacific Seals And Packing Products Revenue (million), by Country 2025 & 2033
- Figure 31: Asia Pacific Seals And Packing Products Revenue Share (%), by Country 2025 & 2033
List of Tables
- Table 1: Global Seals And Packing Products Revenue million Forecast, by Application 2020 & 2033
- Table 2: Global Seals And Packing Products Revenue million Forecast, by Type 2020 & 2033
- Table 3: Global Seals And Packing Products Revenue million Forecast, by Region 2020 & 2033
- Table 4: Global Seals And Packing Products Revenue million Forecast, by Application 2020 & 2033
- Table 5: Global Seals And Packing Products Revenue million Forecast, by Type 2020 & 2033
- Table 6: Global Seals And Packing Products Revenue million Forecast, by Country 2020 & 2033
- Table 7: United States Seals And Packing Products Revenue (million) Forecast, by Application 2020 & 2033
- Table 8: Canada Seals And Packing Products Revenue (million) Forecast, by Application 2020 & 2033
- Table 9: Mexico Seals And Packing Products Revenue (million) Forecast, by Application 2020 & 2033
- Table 10: Global Seals And Packing Products Revenue million Forecast, by Application 2020 & 2033
- Table 11: Global Seals And Packing Products Revenue million Forecast, by Type 2020 & 2033
- Table 12: Global Seals And Packing Products Revenue million Forecast, by Country 2020 & 2033
- Table 13: Brazil Seals And Packing Products Revenue (million) Forecast, by Application 2020 & 2033
- Table 14: Argentina Seals And Packing Products Revenue (million) Forecast, by Application 2020 & 2033
- Table 15: Rest of South America Seals And Packing Products Revenue (million) Forecast, by Application 2020 & 2033
- Table 16: Global Seals And Packing Products Revenue million Forecast, by Application 2020 & 2033
- Table 17: Global Seals And Packing Products Revenue million Forecast, by Type 2020 & 2033
- Table 18: Global Seals And Packing Products Revenue million Forecast, by Country 2020 & 2033
- Table 19: United Kingdom Seals And Packing Products Revenue (million) Forecast, by Application 2020 & 2033
- Table 20: Germany Seals And Packing Products Revenue (million) Forecast, by Application 2020 & 2033
- Table 21: France Seals And Packing Products Revenue (million) Forecast, by Application 2020 & 2033
- Table 22: Italy Seals And Packing Products Revenue (million) Forecast, by Application 2020 & 2033
- Table 23: Spain Seals And Packing Products Revenue (million) Forecast, by Application 2020 & 2033
- Table 24: Russia Seals And Packing Products Revenue (million) Forecast, by Application 2020 & 2033
- Table 25: Benelux Seals And Packing Products Revenue (million) Forecast, by Application 2020 & 2033
- Table 26: Nordics Seals And Packing Products Revenue (million) Forecast, by Application 2020 & 2033
- Table 27: Rest of Europe Seals And Packing Products Revenue (million) Forecast, by Application 2020 & 2033
- Table 28: Global Seals And Packing Products Revenue million Forecast, by Application 2020 & 2033
- Table 29: Global Seals And Packing Products Revenue million Forecast, by Type 2020 & 2033
- Table 30: Global Seals And Packing Products Revenue million Forecast, by Country 2020 & 2033
- Table 31: Turkey Seals And Packing Products Revenue (million) Forecast, by Application 2020 & 2033
- Table 32: Israel Seals And Packing Products Revenue (million) Forecast, by Application 2020 & 2033
- Table 33: GCC Seals And Packing Products Revenue (million) Forecast, by Application 2020 & 2033
- Table 34: North Africa Seals And Packing Products Revenue (million) Forecast, by Application 2020 & 2033
- Table 35: South Africa Seals And Packing Products Revenue (million) Forecast, by Application 2020 & 2033
- Table 36: Rest of Middle East & Africa Seals And Packing Products Revenue (million) Forecast, by Application 2020 & 2033
- Table 37: Global Seals And Packing Products Revenue million Forecast, by Application 2020 & 2033
- Table 38: Global Seals And Packing Products Revenue million Forecast, by Type 2020 & 2033
- Table 39: Global Seals And Packing Products Revenue million Forecast, by Country 2020 & 2033
- Table 40: China Seals And Packing Products Revenue (million) Forecast, by Application 2020 & 2033
- Table 41: India Seals And Packing Products Revenue (million) Forecast, by Application 2020 & 2033
- Table 42: Japan Seals And Packing Products Revenue (million) Forecast, by Application 2020 & 2033
- Table 43: South Korea Seals And Packing Products Revenue (million) Forecast, by Application 2020 & 2033
- Table 44: ASEAN Seals And Packing Products Revenue (million) Forecast, by Application 2020 & 2033
- Table 45: Oceania Seals And Packing Products Revenue (million) Forecast, by Application 2020 & 2033
- Table 46: Rest of Asia Pacific Seals And Packing Products Revenue (million) Forecast, by Application 2020 & 2033
Frequently Asked Questions
1. What is the projected Compound Annual Growth Rate (CAGR) of the Seals And Packing Products?
The projected CAGR is approximately XXX%.
2. Which companies are prominent players in the Seals And Packing Products?
Key companies in the market include Mitsubishi Cable Industries Ltd., American Seal & Packing, Inc.(ASP), Trelleborg, NOK Corporation, MPRC Seals, GMN, Crane Engineering, T-LON.
3. What are the main segments of the Seals And Packing Products?
The market segments include Application, Type.
4. Can you provide details about the market size?
The market size is estimated to be USD XXX million as of 2022.
5. What are some drivers contributing to market growth?
N/A
6. What are the notable trends driving market growth?
N/A
7. Are there any restraints impacting market growth?
N/A
8. Can you provide examples of recent developments in the market?
N/A
9. What pricing options are available for accessing the report?
Pricing options include single-user, multi-user, and enterprise licenses priced at USD 3950.00, USD 5925.00, and USD 7900.00 respectively.
10. Is the market size provided in terms of value or volume?
The market size is provided in terms of value, measured in million.
11. Are there any specific market keywords associated with the report?
Yes, the market keyword associated with the report is "Seals And Packing Products," which aids in identifying and referencing the specific market segment covered.
12. How do I determine which pricing option suits my needs best?
The pricing options vary based on user requirements and access needs. Individual users may opt for single-user licenses, while businesses requiring broader access may choose multi-user or enterprise licenses for cost-effective access to the report.
13. Are there any additional resources or data provided in the Seals And Packing Products report?
While the report offers comprehensive insights, it's advisable to review the specific contents or supplementary materials provided to ascertain if additional resources or data are available.
14. How can I stay updated on further developments or reports in the Seals And Packing Products?
To stay informed about further developments, trends, and reports in the Seals And Packing Products, consider subscribing to industry newsletters, following relevant companies and organizations, or regularly checking reputable industry news sources and publications.
Methodology
Step 1 - Identification of Relevant Samples Size from Population Database


Step 2 - Approaches for Defining Global Market Size (Value, Volume* & Price*)

Note*: In applicable scenarios
Step 3 - Data Sources
Primary Research
- Web Analytics
- Survey Reports
- Research Institute
- Latest Research Reports
- Opinion Leaders
Secondary Research
- Annual Reports
- White Paper
- Latest Press Release
- Industry Association
- Paid Database
- Investor Presentations

Step 4 - Data Triangulation
Involves using different sources of information in order to increase the validity of a study
These sources are likely to be stakeholders in a program - participants, other researchers, program staff, other community members, and so on.
Then we put all data in single framework & apply various statistical tools to find out the dynamic on the market.
During the analysis stage, feedback from the stakeholder groups would be compared to determine areas of agreement as well as areas of divergence