

Key Insights
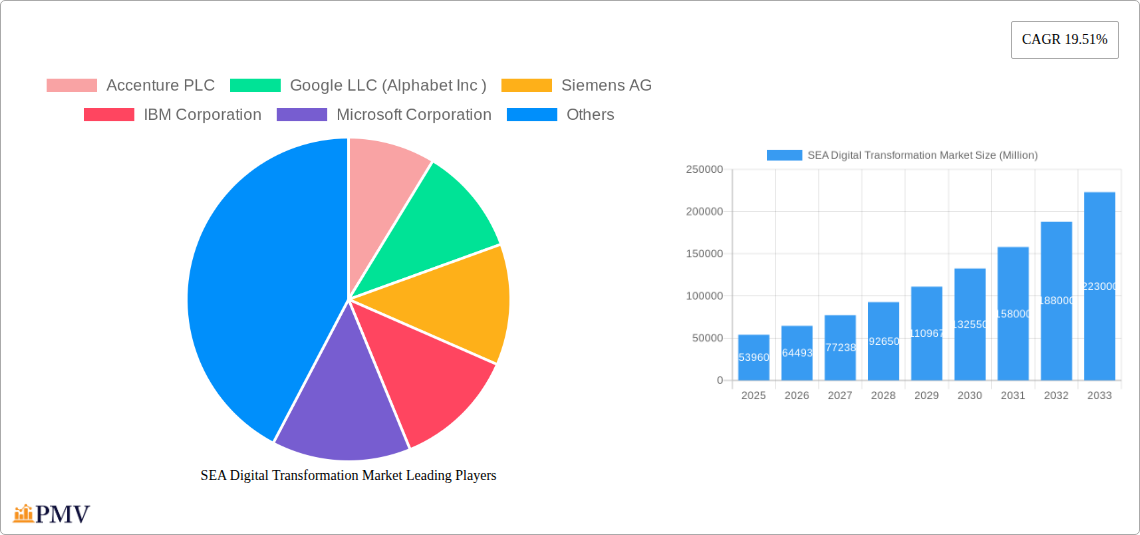
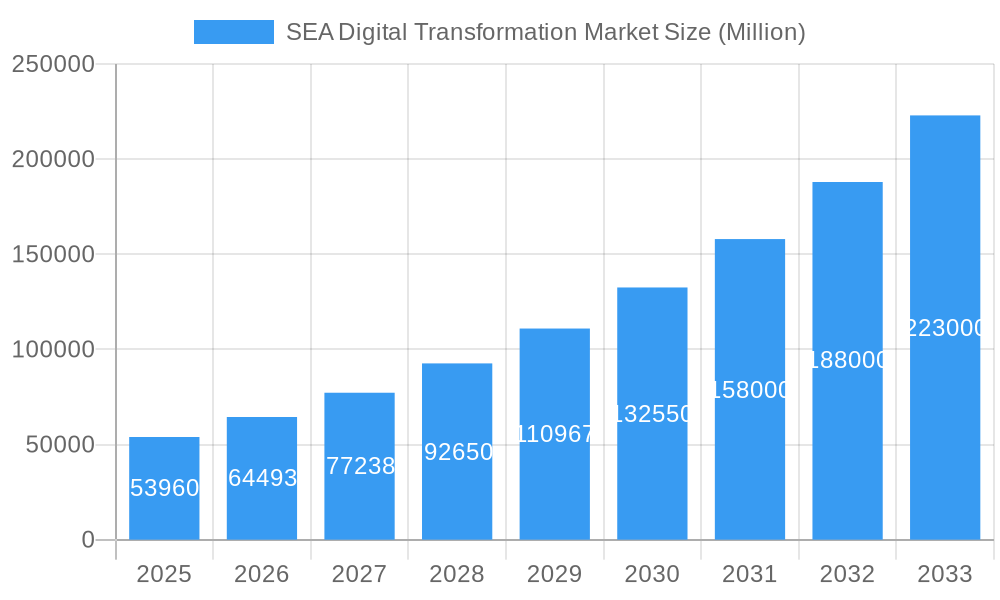
The Southeast Asia (SEA) digital transformation market is experiencing robust growth, driven by increasing digital adoption across various sectors, expanding internet and smartphone penetration, and government initiatives promoting digitalization. The market, valued at $53.96 billion in 2025, is projected to exhibit a Compound Annual Growth Rate (CAGR) of 19.51% from 2025 to 2033. This significant growth is fueled by several key factors. Businesses across SEA are increasingly investing in cloud computing, artificial intelligence (AI), and big data analytics to enhance operational efficiency, improve customer experiences, and gain a competitive edge. Furthermore, the rise of e-commerce and the expanding fintech sector are significant contributors to this market expansion. While challenges such as cybersecurity concerns and a digital skills gap exist, the overall market outlook remains highly positive. The strong growth is expected to continue, particularly in countries like Indonesia, Vietnam, and the Philippines, which boast large and rapidly growing digital economies. Major players such as Accenture, Google, IBM, Microsoft, and Salesforce are actively investing in the region, further accelerating the pace of digital transformation.
SEA Digital Transformation Market Market Size (In Billion)
The segmentation of the SEA digital transformation market is diverse, encompassing various technologies and industry verticals. Cloud computing, software as a service (SaaS), and cybersecurity solutions are expected to be leading segments, propelled by the increasing need for secure and scalable digital infrastructure. The retail, finance, and telecommunications sectors are anticipated to be significant adopters of digital technologies, leading to substantial market growth within these verticals. However, the market's progress is not without its obstacles. Challenges such as the varying levels of digital literacy across different SEA countries and the need for robust digital infrastructure development in certain regions could potentially moderate the rate of growth. Despite these challenges, the long-term prospects for the SEA digital transformation market remain exceptionally promising, fueled by continued technological advancements and sustained economic growth across the region.
SEA Digital Transformation Market Company Market Share
SEA Digital Transformation Market: A Comprehensive Report (2019-2033)
This in-depth report provides a comprehensive analysis of the Southeast Asia (SEA) Digital Transformation Market, covering the period from 2019 to 2033. It offers invaluable insights into market structure, competitive dynamics, industry trends, leading players, and future growth prospects, equipping businesses with the knowledge needed to navigate this rapidly evolving landscape. The report utilizes a robust methodology, incorporating both historical data (2019-2024) and projections (2025-2033), with 2025 serving as the base year. The market is projected to reach xx Million by 2033, demonstrating significant growth potential.
SEA Digital Transformation Market Structure & Competitive Dynamics
The SEA digital transformation market is characterized by a dynamic interplay of established technology giants and emerging local players. Market concentration is moderate, with a few dominant players holding significant market share, but a large number of smaller companies contributing to innovation. The market is further shaped by a complex regulatory landscape varying across SEA nations, the presence of substitute technologies (e.g., legacy systems), evolving end-user preferences towards cloud-based solutions, and frequent mergers and acquisitions (M&A) activity.
- Market Concentration: While precise market share data for individual players requires deeper proprietary data analysis, companies like Accenture PLC, Google LLC (Alphabet Inc), and Microsoft Corporation hold substantial shares, indicating a relatively concentrated yet competitive market. Smaller players specializing in niche segments also contribute significantly.
- Innovation Ecosystems: Strong government support for digitalization initiatives, coupled with a vibrant startup ecosystem in several SEA countries, fuels continuous innovation. Collaborative efforts between tech giants and local businesses are becoming increasingly common.
- Regulatory Frameworks: Varying regulatory environments across SEA nations present both challenges and opportunities. Some countries offer favorable policies for digital transformation, while others have more stringent regulations.
- M&A Activity: The past five years have witnessed significant M&A activity, with deals valuing xx Million in total. These acquisitions reflect consolidation trends and strategic expansions by larger players into new markets and technologies.
SEA Digital Transformation Market Industry Trends & Insights
The SEA digital transformation market is experiencing robust growth, driven by several key factors. The Compound Annual Growth Rate (CAGR) for the forecast period (2025-2033) is estimated at xx%, indicating a sustained upward trajectory. Increased government investments in digital infrastructure, rising adoption of cloud computing and AI, escalating demand for cybersecurity solutions, and growing digital literacy among consumers are pivotal growth drivers. Market penetration of digital transformation solutions is steadily increasing, exceeding xx% in several key segments by 2025. Technological disruptions such as the emergence of Web3, the metaverse, and quantum computing are shaping future trends, creating both opportunities and challenges for businesses. Consumer preferences are shifting towards personalized experiences, seamless omnichannel interactions, and increased data privacy, influencing product development and marketing strategies. Competitive dynamics are characterized by intense innovation, strategic partnerships, and a focus on providing end-to-end solutions.
Dominant Markets & Segments in SEA Digital Transformation Market
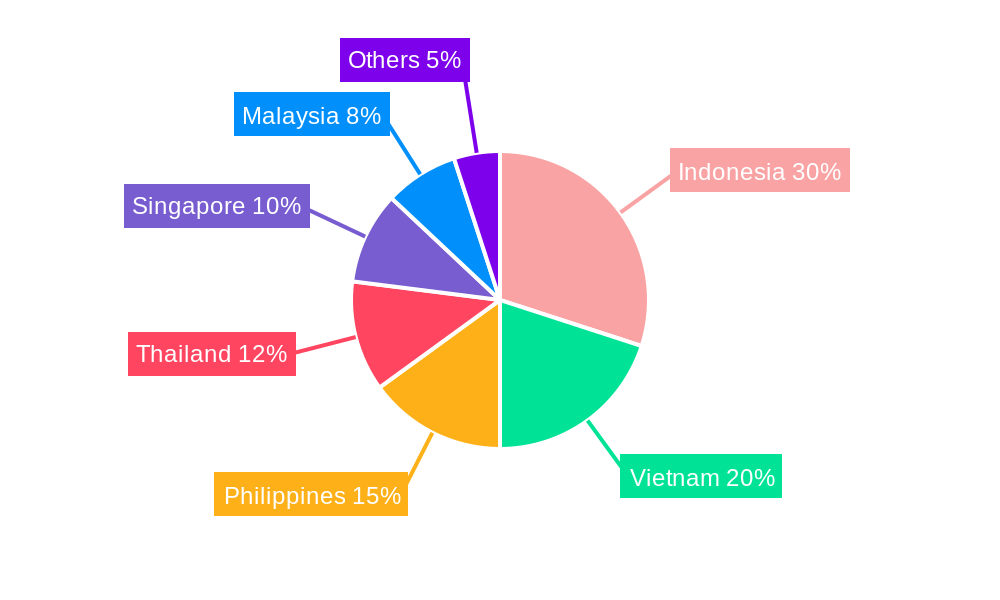
The Southeast Asian (SEA) digital transformation market is experiencing robust growth, with specific countries and segments leading the charge. At the forefront are Indonesia, Singapore, and Vietnam, each distinguished by a unique set of catalysts driving their digital evolution.
-
Indonesia: A confluence of a vast and growing population, exceptionally high smartphone penetration rates, and a burgeoning e-commerce landscape positions Indonesia as a pivotal market. The sheer scale of its digital consumer base fuels demand for innovative digital solutions.
-
Singapore: As a global innovation hub, Singapore leverages its strong government commitment to digital initiatives, world-class digital infrastructure, and a highly skilled, globally competitive workforce. This environment fosters advanced technological adoption and the development of cutting-edge digital solutions.
-
Vietnam: The nation benefits from forward-thinking government policies designed to encourage digitalization, coupled with a young, digitally native population eager to embrace new technologies. Significant foreign investment in the technology sector further accelerates its digital transformation journey.
-
Key Market Drivers Across the Region:
- Supportive Economic & Government Policies: Proactive governmental strategies and policies that champion digitalization, innovation, and the adoption of emerging technologies are instrumental in shaping the market's trajectory.
- Advanced Infrastructure Development: Continuous investment in high-speed internet connectivity, 5G deployment, and robust digital infrastructure forms the bedrock for widespread digital transformation initiatives.
- Growing Talent Pool & Digital Literacy: The increasing availability of skilled professionals in areas such as AI, data science, cloud computing, and cybersecurity, alongside a digitally literate populace, is crucial for successful implementation.
- Surge in Foreign Direct Investment (FDI): Significant inflows of foreign capital into the technology and digital sectors are providing the necessary resources for expansion, research, and development.
SEA Digital Transformation Market Product Innovations
Recent years have witnessed significant advancements in digital transformation products, including the widespread adoption of cloud-based solutions, the integration of AI and machine learning into various applications, the rise of blockchain technology, and the increasing use of IoT devices. These innovations are improving operational efficiency, enhancing customer experiences, and fostering greater business agility. Market fit is strong, with these technologies addressing key business needs across various industries.
Report Segmentation & Scope
This comprehensive report meticulously segments the SEA digital transformation market to provide deep insights into its multifaceted nature. The segmentation covers:
- By Technology: The market is analyzed across key technological pillars including Cloud Computing, Artificial Intelligence (AI), Cybersecurity, Big Data Analytics, Internet of Things (IoT), and Blockchain. Each of these technology segments possesses distinct growth trajectories, market valuations, and competitive dynamics. For instance, the Cloud Computing segment is projected for exponential growth, driven by its inherent scalability, cost-efficiency, and enabling capabilities for other digital technologies.
- By Industry Vertical: The report delves into the adoption and impact of digital transformation across critical industries such as Banking, Financial Services, and Insurance (BFSI), Healthcare, Retail, Manufacturing, and Government. The BFSI sector is anticipated to maintain its position as a leading adopter, propelled by the imperative for enhanced security, seamless customer experiences, and stringent regulatory compliance.
- By Country: A granular analysis of market dynamics and growth prospects is provided for key economies including Indonesia, Singapore, Vietnam, Malaysia, Thailand, and the Philippines, among others. Growth projections are tailored to account for country-specific economic development, existing digital infrastructure maturity, and the efficacy of government support initiatives.
Key Drivers of SEA Digital Transformation Market Growth
Several factors contribute to the growth of the SEA digital transformation market. These include:
- Technological Advancements: Rapid progress in areas like AI, cloud computing, and IoT, enabling the development of innovative solutions.
- Economic Growth: Increasing disposable incomes and rising consumer spending fuel demand for digital products and services.
- Government Initiatives: Many SEA governments are actively promoting digital transformation through various policy measures, including funding programs and digital literacy initiatives.
Challenges in the SEA Digital Transformation Market Sector
The SEA digital transformation market faces various challenges, including:
- Cybersecurity Threats: The increasing reliance on digital technologies makes businesses vulnerable to cyberattacks, requiring robust security solutions.
- Digital Divide: Unequal access to digital technologies across the region presents challenges for inclusive growth.
- Skills Gap: A shortage of skilled professionals in technology-related fields hampers the implementation of digital transformation initiatives.
Leading Players in the SEA Digital Transformation Market Market
- Accenture PLC
- Google LLC (Alphabet Inc)
- Siemens AG
- IBM Corporation
- Microsoft Corporation
- Cognex Corporation
- Hewlett Packard Enterprise
- SAP SE
- EMC Corporation (Dell EMC)
- Oracle Corporation
- Adobe Inc
- Amazon Web Services Inc (Amazon.com Inc)
- Apple Inc
- Salesforce.com Inc
- Cisco Systems Inc
Key Developments in SEA Digital Transformation Market Sector
Recent strategic initiatives and investments are significantly shaping the future of digital transformation in the SEA region:
- July 2024: The Monetary Authority of Singapore (MAS) has announced a substantial pledge of USD 134.3 Million through the Financial Sector Technology and Innovation (FTSI) 3.0 grant scheme. This funding is specifically earmarked to bolster the capabilities of financial institutions in cutting-edge areas such as Artificial Intelligence (AI) and quantum computing, thereby accelerating innovation and adoption of these transformative technologies.
- May 2024: Microsoft has unveiled a significant commitment of USD 2.2 Billion to Malaysia over the next four years. This multi-faceted investment focuses on developing cloud and AI infrastructure, providing AI training to an estimated 200,000 Malaysians, and establishing a national AI Center of Excellence. This strategic investment underscores Microsoft's dedication to fostering Malaysia's burgeoning digital ecosystem.
Strategic SEA Digital Transformation Market Outlook
The SEA digital transformation market is poised for continued strong growth, driven by sustained technological innovation, increasing government support, and rising consumer demand. Strategic opportunities exist for businesses that can adapt quickly to changing market dynamics, invest in emerging technologies, and focus on delivering innovative and user-friendly solutions. The market's future trajectory will be influenced by the successful resolution of existing challenges, such as cybersecurity threats and the digital divide. Companies that proactively address these issues and embrace a customer-centric approach will be best positioned to capture significant market share.
SEA Digital Transformation Market Segmentation
-
1. Type
-
1.1. Analytic
- 1.1.1. Current
- 1.1.2. Key Grow
- 1.1.3. Use Case Analysis
- 1.1.4. Market Outlook
- 1.2. Extended Reality (XR)
- 1.3. IoT
- 1.4. Industrial Robotics
- 1.5. Blockchain
- 1.6. Additive Manufacturing/3D Printing
- 1.7. Cybersecurity
- 1.8. Cloud and Edge Computing
-
1.9. Others (Digital Twin, Mobility, and Connectivity)
- 1.9.1. Market B
-
1.1. Analytic
-
2. End-user Industry
- 2.1. Manufacturing
- 2.2. Oil, Gas, and Utilities
- 2.3. Retail & e-commerce
- 2.4. Transportation and Logistics
- 2.5. Healthcare
- 2.6. BFSI
- 2.7. Telecom and IT
- 2.8. Government and Public Sector
- 2.9. Other En
SEA Digital Transformation Market Segmentation By Geography
-
1. North America
- 1.1. United States
- 1.2. Canada
- 1.3. Mexico
-
2. South America
- 2.1. Brazil
- 2.2. Argentina
- 2.3. Rest of South America
-
3. Europe
- 3.1. United Kingdom
- 3.2. Germany
- 3.3. France
- 3.4. Italy
- 3.5. Spain
- 3.6. Russia
- 3.7. Benelux
- 3.8. Nordics
- 3.9. Rest of Europe
-
4. Middle East & Africa
- 4.1. Turkey
- 4.2. Israel
- 4.3. GCC
- 4.4. North Africa
- 4.5. South Africa
- 4.6. Rest of Middle East & Africa
-
5. Asia Pacific
- 5.1. China
- 5.2. India
- 5.3. Japan
- 5.4. South Korea
- 5.5. ASEAN
- 5.6. Oceania
- 5.7. Rest of Asia Pacific
SEA Digital Transformation Market Regional Market Share
Geographic Coverage of SEA Digital Transformation Market
SEA Digital Transformation Market REPORT HIGHLIGHTS
| Aspects | Details |
|---|---|
| Study Period | 2020-2034 |
| Base Year | 2025 |
| Estimated Year | 2026 |
| Forecast Period | 2026-2034 |
| Historical Period | 2020-2025 |
| Growth Rate | CAGR of 19.51% from 2020-2034 |
| Segmentation |
|
Table of Contents
- 1. Introduction
- 1.1. Research Scope
- 1.2. Market Segmentation
- 1.3. Research Objective
- 1.4. Definitions and Assumptions
- 2. Executive Summary
- 2.1. Market Snapshot
- 3. Market Dynamics
- 3.1. Market Drivers
- 3.2. Market Restrains
- 3.3. Market Trends
- 3.4. Market Opportunities
- 4. Market Factor Analysis
- 4.1. Porters Five Forces
- 4.1.1. Bargaining Power of Suppliers
- 4.1.2. Bargaining Power of Buyers
- 4.1.3. Threat of New Entrants
- 4.1.4. Threat of Substitutes
- 4.1.5. Competitive Rivalry
- 4.2. PESTEL analysis
- 4.3. BCG Analysis
- 4.3.1. Stars (High Growth, High Market Share)
- 4.3.2. Cash Cows (Low Growth, High Market Share)
- 4.3.3. Question Mark (High Growth, Low Market Share)
- 4.3.4. Dogs (Low Growth, Low Market Share)
- 4.4. Ansoff Matrix Analysis
- 4.5. Supply Chain Analysis
- 4.6. Regulatory Landscape
- 4.7. Current Market Potential and Opportunity Assessment (TAM–SAM–SOM Framework)
- 4.8. PMV Analyst Note
- 4.1. Porters Five Forces
- 5. Market Analysis, Insights and Forecast 2021-2033
- 5.1. Market Analysis, Insights and Forecast - by Type
- 5.1.1. Analytic
- 5.1.1.1. Current
- 5.1.1.2. Key Grow
- 5.1.1.3. Use Case Analysis
- 5.1.1.4. Market Outlook
- 5.1.2. Extended Reality (XR)
- 5.1.3. IoT
- 5.1.4. Industrial Robotics
- 5.1.5. Blockchain
- 5.1.6. Additive Manufacturing/3D Printing
- 5.1.7. Cybersecurity
- 5.1.8. Cloud and Edge Computing
- 5.1.9. Others (Digital Twin, Mobility, and Connectivity)
- 5.1.9.1. Market B
- 5.1.1. Analytic
- 5.2. Market Analysis, Insights and Forecast - by End-user Industry
- 5.2.1. Manufacturing
- 5.2.2. Oil, Gas, and Utilities
- 5.2.3. Retail & e-commerce
- 5.2.4. Transportation and Logistics
- 5.2.5. Healthcare
- 5.2.6. BFSI
- 5.2.7. Telecom and IT
- 5.2.8. Government and Public Sector
- 5.2.9. Other En
- 5.3. Market Analysis, Insights and Forecast - by Region
- 5.3.1. North America
- 5.3.2. South America
- 5.3.3. Europe
- 5.3.4. Middle East & Africa
- 5.3.5. Asia Pacific
- 5.1. Market Analysis, Insights and Forecast - by Type
- 6. Global SEA Digital Transformation Market Analysis, Insights and Forecast, 2021-2033
- 6.1. Market Analysis, Insights and Forecast - by Type
- 6.1.1. Analytic
- 6.1.1.1. Current
- 6.1.1.2. Key Grow
- 6.1.1.3. Use Case Analysis
- 6.1.1.4. Market Outlook
- 6.1.2. Extended Reality (XR)
- 6.1.3. IoT
- 6.1.4. Industrial Robotics
- 6.1.5. Blockchain
- 6.1.6. Additive Manufacturing/3D Printing
- 6.1.7. Cybersecurity
- 6.1.8. Cloud and Edge Computing
- 6.1.9. Others (Digital Twin, Mobility, and Connectivity)
- 6.1.9.1. Market B
- 6.1.1. Analytic
- 6.2. Market Analysis, Insights and Forecast - by End-user Industry
- 6.2.1. Manufacturing
- 6.2.2. Oil, Gas, and Utilities
- 6.2.3. Retail & e-commerce
- 6.2.4. Transportation and Logistics
- 6.2.5. Healthcare
- 6.2.6. BFSI
- 6.2.7. Telecom and IT
- 6.2.8. Government and Public Sector
- 6.2.9. Other En
- 6.1. Market Analysis, Insights and Forecast - by Type
- 7. North America SEA Digital Transformation Market Analysis, Insights and Forecast, 2020-2032
- 7.1. Market Analysis, Insights and Forecast - by Type
- 7.1.1. Analytic
- 7.1.1.1. Current
- 7.1.1.2. Key Grow
- 7.1.1.3. Use Case Analysis
- 7.1.1.4. Market Outlook
- 7.1.2. Extended Reality (XR)
- 7.1.3. IoT
- 7.1.4. Industrial Robotics
- 7.1.5. Blockchain
- 7.1.6. Additive Manufacturing/3D Printing
- 7.1.7. Cybersecurity
- 7.1.8. Cloud and Edge Computing
- 7.1.9. Others (Digital Twin, Mobility, and Connectivity)
- 7.1.9.1. Market B
- 7.1.1. Analytic
- 7.2. Market Analysis, Insights and Forecast - by End-user Industry
- 7.2.1. Manufacturing
- 7.2.2. Oil, Gas, and Utilities
- 7.2.3. Retail & e-commerce
- 7.2.4. Transportation and Logistics
- 7.2.5. Healthcare
- 7.2.6. BFSI
- 7.2.7. Telecom and IT
- 7.2.8. Government and Public Sector
- 7.2.9. Other En
- 7.1. Market Analysis, Insights and Forecast - by Type
- 8. South America SEA Digital Transformation Market Analysis, Insights and Forecast, 2020-2032
- 8.1. Market Analysis, Insights and Forecast - by Type
- 8.1.1. Analytic
- 8.1.1.1. Current
- 8.1.1.2. Key Grow
- 8.1.1.3. Use Case Analysis
- 8.1.1.4. Market Outlook
- 8.1.2. Extended Reality (XR)
- 8.1.3. IoT
- 8.1.4. Industrial Robotics
- 8.1.5. Blockchain
- 8.1.6. Additive Manufacturing/3D Printing
- 8.1.7. Cybersecurity
- 8.1.8. Cloud and Edge Computing
- 8.1.9. Others (Digital Twin, Mobility, and Connectivity)
- 8.1.9.1. Market B
- 8.1.1. Analytic
- 8.2. Market Analysis, Insights and Forecast - by End-user Industry
- 8.2.1. Manufacturing
- 8.2.2. Oil, Gas, and Utilities
- 8.2.3. Retail & e-commerce
- 8.2.4. Transportation and Logistics
- 8.2.5. Healthcare
- 8.2.6. BFSI
- 8.2.7. Telecom and IT
- 8.2.8. Government and Public Sector
- 8.2.9. Other En
- 8.1. Market Analysis, Insights and Forecast - by Type
- 9. Europe SEA Digital Transformation Market Analysis, Insights and Forecast, 2020-2032
- 9.1. Market Analysis, Insights and Forecast - by Type
- 9.1.1. Analytic
- 9.1.1.1. Current
- 9.1.1.2. Key Grow
- 9.1.1.3. Use Case Analysis
- 9.1.1.4. Market Outlook
- 9.1.2. Extended Reality (XR)
- 9.1.3. IoT
- 9.1.4. Industrial Robotics
- 9.1.5. Blockchain
- 9.1.6. Additive Manufacturing/3D Printing
- 9.1.7. Cybersecurity
- 9.1.8. Cloud and Edge Computing
- 9.1.9. Others (Digital Twin, Mobility, and Connectivity)
- 9.1.9.1. Market B
- 9.1.1. Analytic
- 9.2. Market Analysis, Insights and Forecast - by End-user Industry
- 9.2.1. Manufacturing
- 9.2.2. Oil, Gas, and Utilities
- 9.2.3. Retail & e-commerce
- 9.2.4. Transportation and Logistics
- 9.2.5. Healthcare
- 9.2.6. BFSI
- 9.2.7. Telecom and IT
- 9.2.8. Government and Public Sector
- 9.2.9. Other En
- 9.1. Market Analysis, Insights and Forecast - by Type
- 10. Middle East & Africa SEA Digital Transformation Market Analysis, Insights and Forecast, 2020-2032
- 10.1. Market Analysis, Insights and Forecast - by Type
- 10.1.1. Analytic
- 10.1.1.1. Current
- 10.1.1.2. Key Grow
- 10.1.1.3. Use Case Analysis
- 10.1.1.4. Market Outlook
- 10.1.2. Extended Reality (XR)
- 10.1.3. IoT
- 10.1.4. Industrial Robotics
- 10.1.5. Blockchain
- 10.1.6. Additive Manufacturing/3D Printing
- 10.1.7. Cybersecurity
- 10.1.8. Cloud and Edge Computing
- 10.1.9. Others (Digital Twin, Mobility, and Connectivity)
- 10.1.9.1. Market B
- 10.1.1. Analytic
- 10.2. Market Analysis, Insights and Forecast - by End-user Industry
- 10.2.1. Manufacturing
- 10.2.2. Oil, Gas, and Utilities
- 10.2.3. Retail & e-commerce
- 10.2.4. Transportation and Logistics
- 10.2.5. Healthcare
- 10.2.6. BFSI
- 10.2.7. Telecom and IT
- 10.2.8. Government and Public Sector
- 10.2.9. Other En
- 10.1. Market Analysis, Insights and Forecast - by Type
- 11. Asia Pacific SEA Digital Transformation Market Analysis, Insights and Forecast, 2020-2032
- 11.1. Market Analysis, Insights and Forecast - by Type
- 11.1.1. Analytic
- 11.1.1.1. Current
- 11.1.1.2. Key Grow
- 11.1.1.3. Use Case Analysis
- 11.1.1.4. Market Outlook
- 11.1.2. Extended Reality (XR)
- 11.1.3. IoT
- 11.1.4. Industrial Robotics
- 11.1.5. Blockchain
- 11.1.6. Additive Manufacturing/3D Printing
- 11.1.7. Cybersecurity
- 11.1.8. Cloud and Edge Computing
- 11.1.9. Others (Digital Twin, Mobility, and Connectivity)
- 11.1.9.1. Market B
- 11.1.1. Analytic
- 11.2. Market Analysis, Insights and Forecast - by End-user Industry
- 11.2.1. Manufacturing
- 11.2.2. Oil, Gas, and Utilities
- 11.2.3. Retail & e-commerce
- 11.2.4. Transportation and Logistics
- 11.2.5. Healthcare
- 11.2.6. BFSI
- 11.2.7. Telecom and IT
- 11.2.8. Government and Public Sector
- 11.2.9. Other En
- 11.1. Market Analysis, Insights and Forecast - by Type
- 12. Competitive Analysis
- 12.1. Company Profiles
- 12.1.1 Accenture PLC
- 12.1.1.1. Company Overview
- 12.1.1.2. Products
- 12.1.1.3. Company Financials
- 12.1.1.4. SWOT Analysis
- 12.1.2 Google LLC (Alphabet Inc )
- 12.1.2.1. Company Overview
- 12.1.2.2. Products
- 12.1.2.3. Company Financials
- 12.1.2.4. SWOT Analysis
- 12.1.3 Siemens AG
- 12.1.3.1. Company Overview
- 12.1.3.2. Products
- 12.1.3.3. Company Financials
- 12.1.3.4. SWOT Analysis
- 12.1.4 IBM Corporation
- 12.1.4.1. Company Overview
- 12.1.4.2. Products
- 12.1.4.3. Company Financials
- 12.1.4.4. SWOT Analysis
- 12.1.5 Microsoft Corporation
- 12.1.5.1. Company Overview
- 12.1.5.2. Products
- 12.1.5.3. Company Financials
- 12.1.5.4. SWOT Analysis
- 12.1.6 Cognex Corporation
- 12.1.6.1. Company Overview
- 12.1.6.2. Products
- 12.1.6.3. Company Financials
- 12.1.6.4. SWOT Analysis
- 12.1.7 Hewlett Packard Enterprise
- 12.1.7.1. Company Overview
- 12.1.7.2. Products
- 12.1.7.3. Company Financials
- 12.1.7.4. SWOT Analysis
- 12.1.8 SAP SE
- 12.1.8.1. Company Overview
- 12.1.8.2. Products
- 12.1.8.3. Company Financials
- 12.1.8.4. SWOT Analysis
- 12.1.9 EMC Corporation (Dell EMC)
- 12.1.9.1. Company Overview
- 12.1.9.2. Products
- 12.1.9.3. Company Financials
- 12.1.9.4. SWOT Analysis
- 12.1.10 Oracle Corporation
- 12.1.10.1. Company Overview
- 12.1.10.2. Products
- 12.1.10.3. Company Financials
- 12.1.10.4. SWOT Analysis
- 12.1.11 Adobe Inc
- 12.1.11.1. Company Overview
- 12.1.11.2. Products
- 12.1.11.3. Company Financials
- 12.1.11.4. SWOT Analysis
- 12.1.12 Amazon Web Services Inc (Amazon com Inc )
- 12.1.12.1. Company Overview
- 12.1.12.2. Products
- 12.1.12.3. Company Financials
- 12.1.12.4. SWOT Analysis
- 12.1.13 Apple Inc
- 12.1.13.1. Company Overview
- 12.1.13.2. Products
- 12.1.13.3. Company Financials
- 12.1.13.4. SWOT Analysis
- 12.1.14 Salesforce com Inc
- 12.1.14.1. Company Overview
- 12.1.14.2. Products
- 12.1.14.3. Company Financials
- 12.1.14.4. SWOT Analysis
- 12.1.15 Cisco Systems Inc
- 12.1.15.1. Company Overview
- 12.1.15.2. Products
- 12.1.15.3. Company Financials
- 12.1.15.4. SWOT Analysis
- 12.1.1 Accenture PLC
- 12.2. Market Entropy
- 12.2.1 Company's Key Areas Served
- 12.2.2 Recent Developments
- 12.3. Company Market Share Analysis 2025
- 12.3.1 Top 5 Companies Market Share Analysis
- 12.3.2 Top 3 Companies Market Share Analysis
- 12.4. List of Potential Customers
- 13. Research Methodology
List of Figures
- Figure 1: Global SEA Digital Transformation Market Revenue Breakdown (Million, %) by Region 2025 & 2033
- Figure 2: Global SEA Digital Transformation Market Volume Breakdown (Billion, %) by Region 2025 & 2033
- Figure 3: North America SEA Digital Transformation Market Revenue (Million), by Type 2025 & 2033
- Figure 4: North America SEA Digital Transformation Market Volume (Billion), by Type 2025 & 2033
- Figure 5: North America SEA Digital Transformation Market Revenue Share (%), by Type 2025 & 2033
- Figure 6: North America SEA Digital Transformation Market Volume Share (%), by Type 2025 & 2033
- Figure 7: North America SEA Digital Transformation Market Revenue (Million), by End-user Industry 2025 & 2033
- Figure 8: North America SEA Digital Transformation Market Volume (Billion), by End-user Industry 2025 & 2033
- Figure 9: North America SEA Digital Transformation Market Revenue Share (%), by End-user Industry 2025 & 2033
- Figure 10: North America SEA Digital Transformation Market Volume Share (%), by End-user Industry 2025 & 2033
- Figure 11: North America SEA Digital Transformation Market Revenue (Million), by Country 2025 & 2033
- Figure 12: North America SEA Digital Transformation Market Volume (Billion), by Country 2025 & 2033
- Figure 13: North America SEA Digital Transformation Market Revenue Share (%), by Country 2025 & 2033
- Figure 14: North America SEA Digital Transformation Market Volume Share (%), by Country 2025 & 2033
- Figure 15: South America SEA Digital Transformation Market Revenue (Million), by Type 2025 & 2033
- Figure 16: South America SEA Digital Transformation Market Volume (Billion), by Type 2025 & 2033
- Figure 17: South America SEA Digital Transformation Market Revenue Share (%), by Type 2025 & 2033
- Figure 18: South America SEA Digital Transformation Market Volume Share (%), by Type 2025 & 2033
- Figure 19: South America SEA Digital Transformation Market Revenue (Million), by End-user Industry 2025 & 2033
- Figure 20: South America SEA Digital Transformation Market Volume (Billion), by End-user Industry 2025 & 2033
- Figure 21: South America SEA Digital Transformation Market Revenue Share (%), by End-user Industry 2025 & 2033
- Figure 22: South America SEA Digital Transformation Market Volume Share (%), by End-user Industry 2025 & 2033
- Figure 23: South America SEA Digital Transformation Market Revenue (Million), by Country 2025 & 2033
- Figure 24: South America SEA Digital Transformation Market Volume (Billion), by Country 2025 & 2033
- Figure 25: South America SEA Digital Transformation Market Revenue Share (%), by Country 2025 & 2033
- Figure 26: South America SEA Digital Transformation Market Volume Share (%), by Country 2025 & 2033
- Figure 27: Europe SEA Digital Transformation Market Revenue (Million), by Type 2025 & 2033
- Figure 28: Europe SEA Digital Transformation Market Volume (Billion), by Type 2025 & 2033
- Figure 29: Europe SEA Digital Transformation Market Revenue Share (%), by Type 2025 & 2033
- Figure 30: Europe SEA Digital Transformation Market Volume Share (%), by Type 2025 & 2033
- Figure 31: Europe SEA Digital Transformation Market Revenue (Million), by End-user Industry 2025 & 2033
- Figure 32: Europe SEA Digital Transformation Market Volume (Billion), by End-user Industry 2025 & 2033
- Figure 33: Europe SEA Digital Transformation Market Revenue Share (%), by End-user Industry 2025 & 2033
- Figure 34: Europe SEA Digital Transformation Market Volume Share (%), by End-user Industry 2025 & 2033
- Figure 35: Europe SEA Digital Transformation Market Revenue (Million), by Country 2025 & 2033
- Figure 36: Europe SEA Digital Transformation Market Volume (Billion), by Country 2025 & 2033
- Figure 37: Europe SEA Digital Transformation Market Revenue Share (%), by Country 2025 & 2033
- Figure 38: Europe SEA Digital Transformation Market Volume Share (%), by Country 2025 & 2033
- Figure 39: Middle East & Africa SEA Digital Transformation Market Revenue (Million), by Type 2025 & 2033
- Figure 40: Middle East & Africa SEA Digital Transformation Market Volume (Billion), by Type 2025 & 2033
- Figure 41: Middle East & Africa SEA Digital Transformation Market Revenue Share (%), by Type 2025 & 2033
- Figure 42: Middle East & Africa SEA Digital Transformation Market Volume Share (%), by Type 2025 & 2033
- Figure 43: Middle East & Africa SEA Digital Transformation Market Revenue (Million), by End-user Industry 2025 & 2033
- Figure 44: Middle East & Africa SEA Digital Transformation Market Volume (Billion), by End-user Industry 2025 & 2033
- Figure 45: Middle East & Africa SEA Digital Transformation Market Revenue Share (%), by End-user Industry 2025 & 2033
- Figure 46: Middle East & Africa SEA Digital Transformation Market Volume Share (%), by End-user Industry 2025 & 2033
- Figure 47: Middle East & Africa SEA Digital Transformation Market Revenue (Million), by Country 2025 & 2033
- Figure 48: Middle East & Africa SEA Digital Transformation Market Volume (Billion), by Country 2025 & 2033
- Figure 49: Middle East & Africa SEA Digital Transformation Market Revenue Share (%), by Country 2025 & 2033
- Figure 50: Middle East & Africa SEA Digital Transformation Market Volume Share (%), by Country 2025 & 2033
- Figure 51: Asia Pacific SEA Digital Transformation Market Revenue (Million), by Type 2025 & 2033
- Figure 52: Asia Pacific SEA Digital Transformation Market Volume (Billion), by Type 2025 & 2033
- Figure 53: Asia Pacific SEA Digital Transformation Market Revenue Share (%), by Type 2025 & 2033
- Figure 54: Asia Pacific SEA Digital Transformation Market Volume Share (%), by Type 2025 & 2033
- Figure 55: Asia Pacific SEA Digital Transformation Market Revenue (Million), by End-user Industry 2025 & 2033
- Figure 56: Asia Pacific SEA Digital Transformation Market Volume (Billion), by End-user Industry 2025 & 2033
- Figure 57: Asia Pacific SEA Digital Transformation Market Revenue Share (%), by End-user Industry 2025 & 2033
- Figure 58: Asia Pacific SEA Digital Transformation Market Volume Share (%), by End-user Industry 2025 & 2033
- Figure 59: Asia Pacific SEA Digital Transformation Market Revenue (Million), by Country 2025 & 2033
- Figure 60: Asia Pacific SEA Digital Transformation Market Volume (Billion), by Country 2025 & 2033
- Figure 61: Asia Pacific SEA Digital Transformation Market Revenue Share (%), by Country 2025 & 2033
- Figure 62: Asia Pacific SEA Digital Transformation Market Volume Share (%), by Country 2025 & 2033
List of Tables
- Table 1: Global SEA Digital Transformation Market Revenue Million Forecast, by Type 2020 & 2033
- Table 2: Global SEA Digital Transformation Market Volume Billion Forecast, by Type 2020 & 2033
- Table 3: Global SEA Digital Transformation Market Revenue Million Forecast, by End-user Industry 2020 & 2033
- Table 4: Global SEA Digital Transformation Market Volume Billion Forecast, by End-user Industry 2020 & 2033
- Table 5: Global SEA Digital Transformation Market Revenue Million Forecast, by Region 2020 & 2033
- Table 6: Global SEA Digital Transformation Market Volume Billion Forecast, by Region 2020 & 2033
- Table 7: Global SEA Digital Transformation Market Revenue Million Forecast, by Type 2020 & 2033
- Table 8: Global SEA Digital Transformation Market Volume Billion Forecast, by Type 2020 & 2033
- Table 9: Global SEA Digital Transformation Market Revenue Million Forecast, by End-user Industry 2020 & 2033
- Table 10: Global SEA Digital Transformation Market Volume Billion Forecast, by End-user Industry 2020 & 2033
- Table 11: Global SEA Digital Transformation Market Revenue Million Forecast, by Country 2020 & 2033
- Table 12: Global SEA Digital Transformation Market Volume Billion Forecast, by Country 2020 & 2033
- Table 13: United States SEA Digital Transformation Market Revenue (Million) Forecast, by Application 2020 & 2033
- Table 14: United States SEA Digital Transformation Market Volume (Billion) Forecast, by Application 2020 & 2033
- Table 15: Canada SEA Digital Transformation Market Revenue (Million) Forecast, by Application 2020 & 2033
- Table 16: Canada SEA Digital Transformation Market Volume (Billion) Forecast, by Application 2020 & 2033
- Table 17: Mexico SEA Digital Transformation Market Revenue (Million) Forecast, by Application 2020 & 2033
- Table 18: Mexico SEA Digital Transformation Market Volume (Billion) Forecast, by Application 2020 & 2033
- Table 19: Global SEA Digital Transformation Market Revenue Million Forecast, by Type 2020 & 2033
- Table 20: Global SEA Digital Transformation Market Volume Billion Forecast, by Type 2020 & 2033
- Table 21: Global SEA Digital Transformation Market Revenue Million Forecast, by End-user Industry 2020 & 2033
- Table 22: Global SEA Digital Transformation Market Volume Billion Forecast, by End-user Industry 2020 & 2033
- Table 23: Global SEA Digital Transformation Market Revenue Million Forecast, by Country 2020 & 2033
- Table 24: Global SEA Digital Transformation Market Volume Billion Forecast, by Country 2020 & 2033
- Table 25: Brazil SEA Digital Transformation Market Revenue (Million) Forecast, by Application 2020 & 2033
- Table 26: Brazil SEA Digital Transformation Market Volume (Billion) Forecast, by Application 2020 & 2033
- Table 27: Argentina SEA Digital Transformation Market Revenue (Million) Forecast, by Application 2020 & 2033
- Table 28: Argentina SEA Digital Transformation Market Volume (Billion) Forecast, by Application 2020 & 2033
- Table 29: Rest of South America SEA Digital Transformation Market Revenue (Million) Forecast, by Application 2020 & 2033
- Table 30: Rest of South America SEA Digital Transformation Market Volume (Billion) Forecast, by Application 2020 & 2033
- Table 31: Global SEA Digital Transformation Market Revenue Million Forecast, by Type 2020 & 2033
- Table 32: Global SEA Digital Transformation Market Volume Billion Forecast, by Type 2020 & 2033
- Table 33: Global SEA Digital Transformation Market Revenue Million Forecast, by End-user Industry 2020 & 2033
- Table 34: Global SEA Digital Transformation Market Volume Billion Forecast, by End-user Industry 2020 & 2033
- Table 35: Global SEA Digital Transformation Market Revenue Million Forecast, by Country 2020 & 2033
- Table 36: Global SEA Digital Transformation Market Volume Billion Forecast, by Country 2020 & 2033
- Table 37: United Kingdom SEA Digital Transformation Market Revenue (Million) Forecast, by Application 2020 & 2033
- Table 38: United Kingdom SEA Digital Transformation Market Volume (Billion) Forecast, by Application 2020 & 2033
- Table 39: Germany SEA Digital Transformation Market Revenue (Million) Forecast, by Application 2020 & 2033
- Table 40: Germany SEA Digital Transformation Market Volume (Billion) Forecast, by Application 2020 & 2033
- Table 41: France SEA Digital Transformation Market Revenue (Million) Forecast, by Application 2020 & 2033
- Table 42: France SEA Digital Transformation Market Volume (Billion) Forecast, by Application 2020 & 2033
- Table 43: Italy SEA Digital Transformation Market Revenue (Million) Forecast, by Application 2020 & 2033
- Table 44: Italy SEA Digital Transformation Market Volume (Billion) Forecast, by Application 2020 & 2033
- Table 45: Spain SEA Digital Transformation Market Revenue (Million) Forecast, by Application 2020 & 2033
- Table 46: Spain SEA Digital Transformation Market Volume (Billion) Forecast, by Application 2020 & 2033
- Table 47: Russia SEA Digital Transformation Market Revenue (Million) Forecast, by Application 2020 & 2033
- Table 48: Russia SEA Digital Transformation Market Volume (Billion) Forecast, by Application 2020 & 2033
- Table 49: Benelux SEA Digital Transformation Market Revenue (Million) Forecast, by Application 2020 & 2033
- Table 50: Benelux SEA Digital Transformation Market Volume (Billion) Forecast, by Application 2020 & 2033
- Table 51: Nordics SEA Digital Transformation Market Revenue (Million) Forecast, by Application 2020 & 2033
- Table 52: Nordics SEA Digital Transformation Market Volume (Billion) Forecast, by Application 2020 & 2033
- Table 53: Rest of Europe SEA Digital Transformation Market Revenue (Million) Forecast, by Application 2020 & 2033
- Table 54: Rest of Europe SEA Digital Transformation Market Volume (Billion) Forecast, by Application 2020 & 2033
- Table 55: Global SEA Digital Transformation Market Revenue Million Forecast, by Type 2020 & 2033
- Table 56: Global SEA Digital Transformation Market Volume Billion Forecast, by Type 2020 & 2033
- Table 57: Global SEA Digital Transformation Market Revenue Million Forecast, by End-user Industry 2020 & 2033
- Table 58: Global SEA Digital Transformation Market Volume Billion Forecast, by End-user Industry 2020 & 2033
- Table 59: Global SEA Digital Transformation Market Revenue Million Forecast, by Country 2020 & 2033
- Table 60: Global SEA Digital Transformation Market Volume Billion Forecast, by Country 2020 & 2033
- Table 61: Turkey SEA Digital Transformation Market Revenue (Million) Forecast, by Application 2020 & 2033
- Table 62: Turkey SEA Digital Transformation Market Volume (Billion) Forecast, by Application 2020 & 2033
- Table 63: Israel SEA Digital Transformation Market Revenue (Million) Forecast, by Application 2020 & 2033
- Table 64: Israel SEA Digital Transformation Market Volume (Billion) Forecast, by Application 2020 & 2033
- Table 65: GCC SEA Digital Transformation Market Revenue (Million) Forecast, by Application 2020 & 2033
- Table 66: GCC SEA Digital Transformation Market Volume (Billion) Forecast, by Application 2020 & 2033
- Table 67: North Africa SEA Digital Transformation Market Revenue (Million) Forecast, by Application 2020 & 2033
- Table 68: North Africa SEA Digital Transformation Market Volume (Billion) Forecast, by Application 2020 & 2033
- Table 69: South Africa SEA Digital Transformation Market Revenue (Million) Forecast, by Application 2020 & 2033
- Table 70: South Africa SEA Digital Transformation Market Volume (Billion) Forecast, by Application 2020 & 2033
- Table 71: Rest of Middle East & Africa SEA Digital Transformation Market Revenue (Million) Forecast, by Application 2020 & 2033
- Table 72: Rest of Middle East & Africa SEA Digital Transformation Market Volume (Billion) Forecast, by Application 2020 & 2033
- Table 73: Global SEA Digital Transformation Market Revenue Million Forecast, by Type 2020 & 2033
- Table 74: Global SEA Digital Transformation Market Volume Billion Forecast, by Type 2020 & 2033
- Table 75: Global SEA Digital Transformation Market Revenue Million Forecast, by End-user Industry 2020 & 2033
- Table 76: Global SEA Digital Transformation Market Volume Billion Forecast, by End-user Industry 2020 & 2033
- Table 77: Global SEA Digital Transformation Market Revenue Million Forecast, by Country 2020 & 2033
- Table 78: Global SEA Digital Transformation Market Volume Billion Forecast, by Country 2020 & 2033
- Table 79: China SEA Digital Transformation Market Revenue (Million) Forecast, by Application 2020 & 2033
- Table 80: China SEA Digital Transformation Market Volume (Billion) Forecast, by Application 2020 & 2033
- Table 81: India SEA Digital Transformation Market Revenue (Million) Forecast, by Application 2020 & 2033
- Table 82: India SEA Digital Transformation Market Volume (Billion) Forecast, by Application 2020 & 2033
- Table 83: Japan SEA Digital Transformation Market Revenue (Million) Forecast, by Application 2020 & 2033
- Table 84: Japan SEA Digital Transformation Market Volume (Billion) Forecast, by Application 2020 & 2033
- Table 85: South Korea SEA Digital Transformation Market Revenue (Million) Forecast, by Application 2020 & 2033
- Table 86: South Korea SEA Digital Transformation Market Volume (Billion) Forecast, by Application 2020 & 2033
- Table 87: ASEAN SEA Digital Transformation Market Revenue (Million) Forecast, by Application 2020 & 2033
- Table 88: ASEAN SEA Digital Transformation Market Volume (Billion) Forecast, by Application 2020 & 2033
- Table 89: Oceania SEA Digital Transformation Market Revenue (Million) Forecast, by Application 2020 & 2033
- Table 90: Oceania SEA Digital Transformation Market Volume (Billion) Forecast, by Application 2020 & 2033
- Table 91: Rest of Asia Pacific SEA Digital Transformation Market Revenue (Million) Forecast, by Application 2020 & 2033
- Table 92: Rest of Asia Pacific SEA Digital Transformation Market Volume (Billion) Forecast, by Application 2020 & 2033
Frequently Asked Questions
1. What is the projected Compound Annual Growth Rate (CAGR) of the SEA Digital Transformation Market?
The projected CAGR is approximately 19.51%.
2. Which companies are prominent players in the SEA Digital Transformation Market?
Key companies in the market include Accenture PLC, Google LLC (Alphabet Inc ), Siemens AG, IBM Corporation, Microsoft Corporation, Cognex Corporation, Hewlett Packard Enterprise, SAP SE, EMC Corporation (Dell EMC), Oracle Corporation, Adobe Inc, Amazon Web Services Inc (Amazon com Inc ), Apple Inc, Salesforce com Inc, Cisco Systems Inc.
3. What are the main segments of the SEA Digital Transformation Market?
The market segments include Type, End-user Industry.
4. Can you provide details about the market size?
The market size is estimated to be USD 53.96 Million as of 2022.
5. What are some drivers contributing to market growth?
Increase in the Adoption of Big Data Analytics and Other Technologies to Drive the Market; The Rapid Proliferation of Mobile Devices and Apps.
6. What are the notable trends driving market growth?
Increase in the Adoption of Big Data Analytics and Other Technologies to Drive the Market.
7. Are there any restraints impacting market growth?
Increase in the Adoption of Big Data Analytics and Other Technologies to Drive the Market; The Rapid Proliferation of Mobile Devices and Apps.
8. Can you provide examples of recent developments in the market?
July 2024: The Monetary Authority of Singapore (MAS) has pledged an extra SGD 100 million (USD 134.3 million) to bolster financial institutions' expertise in quantum and artificial intelligence (AI) technologies. This funding, part of the Financial Sector Technology and Innovation Grant Scheme (FTSI 3.0), will specifically cover both manpower expenses and technology solutions in these cutting-edge fields. MAS anticipates that this injection will enhance innovation in quantum and AI within the financial sector and accelerate their adoption.
9. What pricing options are available for accessing the report?
Pricing options include single-user, multi-user, and enterprise licenses priced at USD 3800, USD 4500, and USD 5800 respectively.
10. Is the market size provided in terms of value or volume?
The market size is provided in terms of value, measured in Million and volume, measured in Billion.
11. Are there any specific market keywords associated with the report?
Yes, the market keyword associated with the report is "SEA Digital Transformation Market," which aids in identifying and referencing the specific market segment covered.
12. How do I determine which pricing option suits my needs best?
The pricing options vary based on user requirements and access needs. Individual users may opt for single-user licenses, while businesses requiring broader access may choose multi-user or enterprise licenses for cost-effective access to the report.
13. Are there any additional resources or data provided in the SEA Digital Transformation Market report?
While the report offers comprehensive insights, it's advisable to review the specific contents or supplementary materials provided to ascertain if additional resources or data are available.
14. How can I stay updated on further developments or reports in the SEA Digital Transformation Market?
To stay informed about further developments, trends, and reports in the SEA Digital Transformation Market, consider subscribing to industry newsletters, following relevant companies and organizations, or regularly checking reputable industry news sources and publications.
Methodology
Step 1 - Identification of Relevant Samples Size from Population Database


Step 2 - Approaches for Defining Global Market Size (Value, Volume* & Price*)

Note*: In applicable scenarios
Step 3 - Data Sources
Primary Research
- Web Analytics
- Survey Reports
- Research Institute
- Latest Research Reports
- Opinion Leaders
Secondary Research
- Annual Reports
- White Paper
- Latest Press Release
- Industry Association
- Paid Database
- Investor Presentations

Step 4 - Data Triangulation
Involves using different sources of information in order to increase the validity of a study
These sources are likely to be stakeholders in a program - participants, other researchers, program staff, other community members, and so on.
Then we put all data in single framework & apply various statistical tools to find out the dynamic on the market.
During the analysis stage, feedback from the stakeholder groups would be compared to determine areas of agreement as well as areas of divergence