
Key Insights
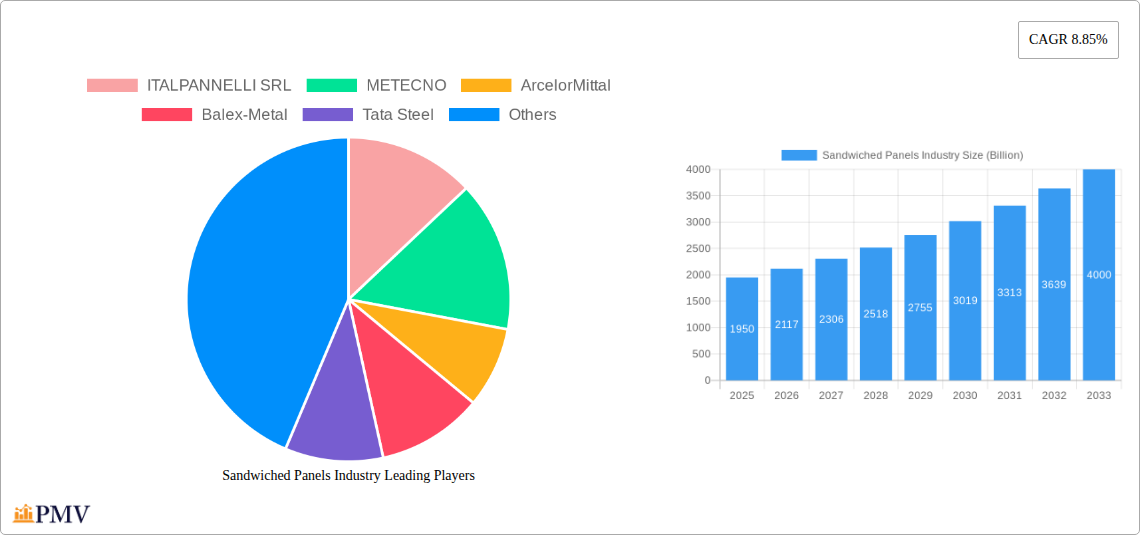
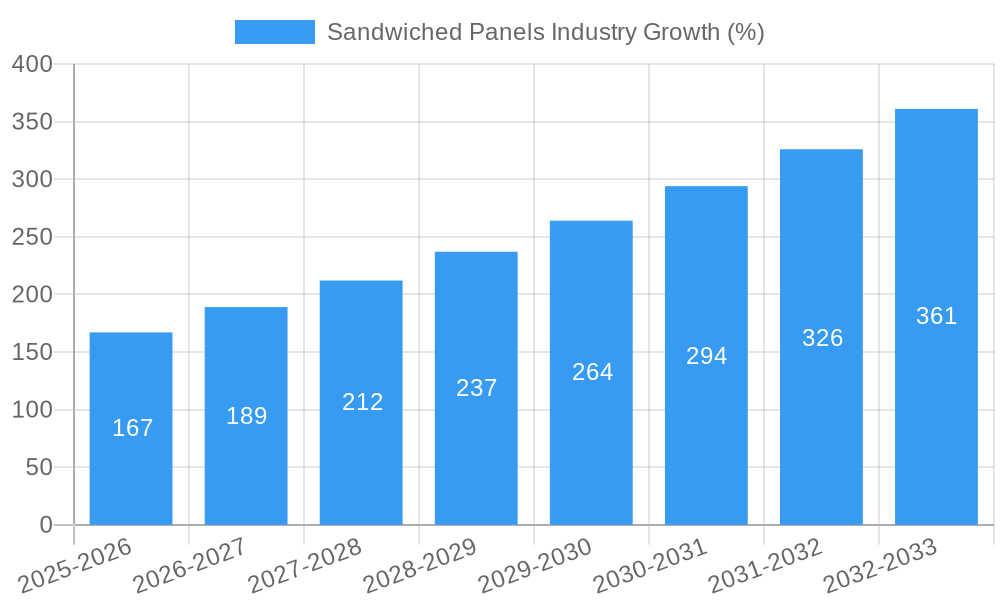
The global sandwiched panels market, valued at $1.95 billion in 2025, is projected to experience robust growth, driven by a Compound Annual Growth Rate (CAGR) of 8.85% from 2025 to 2033. This expansion is fueled by several key factors. The increasing demand for energy-efficient buildings across residential and commercial sectors is a primary driver. Sandwiched panels offer superior insulation properties compared to traditional construction materials, leading to reduced energy consumption and lower operational costs. Furthermore, the rising adoption of prefabricated construction methods, which significantly expedite project timelines and reduce labor costs, is boosting market growth. The versatility of sandwiched panels, adaptable to various building applications (walls, roofs, cold storage), and their availability in diverse materials (EPS, PUR, PIR, glass wool, OSB, plywood) further contribute to market expansion. Growth is also influenced by government initiatives promoting sustainable building practices and stricter energy efficiency regulations in several regions.
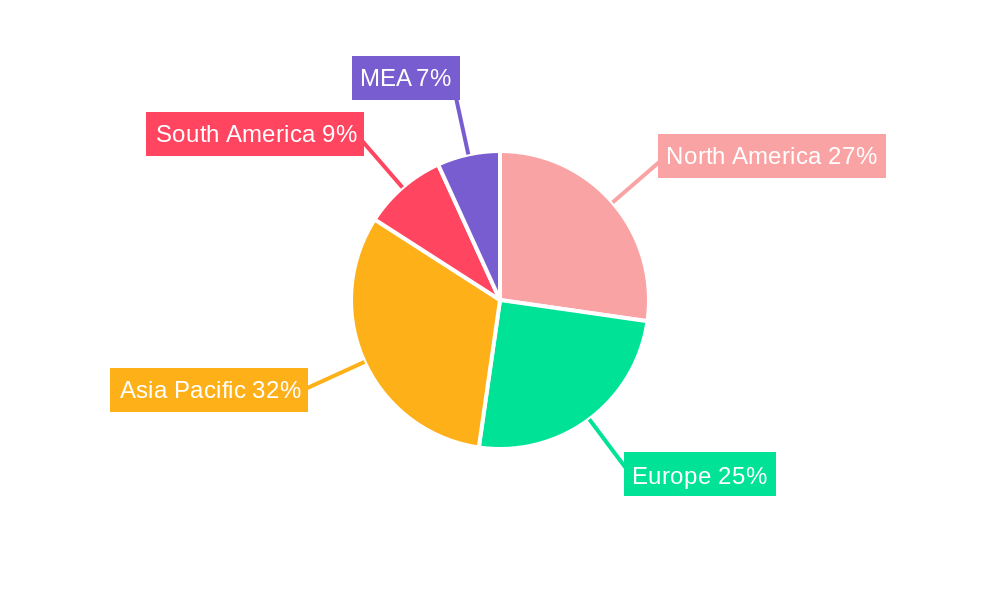
However, certain restraints could temper growth. Fluctuations in raw material prices, particularly for core materials like polyurethane and polystyrene, can impact profitability and market stability. The potential for environmental concerns related to certain panel components, along with the need for specialized installation expertise, might pose challenges. Despite these factors, the long-term outlook remains positive, particularly in rapidly developing economies with significant infrastructure investments. The market segmentation suggests that EPS panels currently hold a substantial market share, followed by PUR/PIR panels, reflecting the cost-effectiveness and widespread availability of these materials. The geographic distribution indicates strong growth potential in the Asia-Pacific region, driven by substantial infrastructure development and rising urbanization in countries like China and India. North America and Europe also contribute significantly to market revenue, reflecting mature markets with a focus on energy efficiency upgrades and sustainable construction.
This comprehensive report provides an in-depth analysis of the global sandwiched panels industry, offering invaluable insights for businesses and investors seeking to navigate this dynamic market. With a study period spanning 2019-2033, a base year of 2025, and a forecast period from 2025-2033, this report presents a detailed overview of market size, segmentation, competitive dynamics, and future growth projections. The total market value is estimated at Billions.
Sandwiched Panels Industry Market Structure & Competitive Dynamics
The global sandwiched panels market exhibits a moderately concentrated structure, with several key players holding significant market share. Market concentration is influenced by factors such as economies of scale in production, technological advancements, and the ability to secure long-term supply contracts. The industry's competitive landscape is characterized by intense rivalry, with companies focusing on product innovation, cost optimization, and strategic partnerships to gain a competitive edge. Regulatory frameworks, particularly those related to building codes and energy efficiency, significantly impact market dynamics. The increasing preference for sustainable building materials presents both opportunities and challenges. Furthermore, the presence of substitute materials, such as traditional construction methods, necessitates continuous innovation and adaptation.
Mergers and acquisitions (M&A) are frequent occurrences, reflecting the industry's consolidation trend. Recent M&A activities have involved billion-dollar deals, resulting in significant shifts in market share and competitive positioning. For instance, Owens Corning's acquisition of WearDeck in June 2022, valued at xx Billion, demonstrates the strategic importance of expanding product portfolios and expertise in related markets.
Key Metrics:
- Market concentration (using a suitable index, e.g., Herfindahl-Hirschman Index): xx
- Top 5 players' combined market share: xx%
- Average M&A deal value (2019-2024): xx Billion
Sandwiched Panels Industry Industry Trends & Insights
The sandwiched panels market is experiencing robust growth, driven by several key factors. The increasing demand for energy-efficient buildings, coupled with stringent building codes in various regions, is a significant growth driver. The construction sector's expansion across both commercial and residential segments further fuels market growth. Technological advancements, including the development of novel insulation materials and improved manufacturing processes, are contributing to the market's expansion. Consumer preferences are shifting toward sustainable and high-performance building materials, thereby increasing the demand for sandwiched panels with enhanced insulation and durability characteristics.
The market’s competitive dynamics are characterized by intense innovation, with leading players continuously introducing new products with improved performance and enhanced features. This includes the development of lighter, stronger, and more energy-efficient panels. The market is also witnessing a growing adoption of advanced manufacturing techniques, such as automated production lines and digital design tools, to increase efficiency and reduce costs.
Key Metrics:
- CAGR (2025-2033): xx%
- Market penetration in key regions: xx%
- Technological advancements driving market growth: xx
Dominant Markets & Segments in Sandwiched Panels Industry
The global sandwiched panels market is geographically diverse, with significant regional variations in demand and market size. However, North America and Europe currently hold dominant positions owing to robust construction activities and stringent energy efficiency regulations. Asia-Pacific is exhibiting rapid growth, driven by increasing urbanization and infrastructure development.
Key Drivers by Segment:
- Product:
- EPS (Expanded Polystyrene) Panel: Cost-effectiveness and ease of installation drive demand in residential construction and cold storage.
- Rigid Polyurethane (PUR) and Rigid Polyisocyanurate (PIR) Panel: Superior insulation properties fuel demand in high-performance buildings and industrial applications.
- Glass Wool Panel: Demand is driven by its fire-retardant properties and excellent sound insulation, favoring commercial applications.
- Other Products (Extruded Polystyrene Foam): niche applications with cost competitiveness being a key factor.
- Skin Material:
- Oriented Strand Board (OSB): Cost-effectiveness and strength make it a popular choice for various applications.
- Plywood: Its versatility and strength contribute to demand in higher-end construction projects.
- Other Skin Materials (Cement Board): Fire resistance and durability favor its use in specific applications.
- Application:
- Building Wall: High demand due to its thermal insulation and soundproofing capabilities.
- Building Roof: Demand is driven by its lightweight nature and energy efficiency benefits.
- Cold Storage: Excellent thermal insulation properties are essential for maintaining temperature control.
Sandwiched Panels Industry Product Innovations
Recent years have witnessed significant product innovations in the sandwiched panels industry. Manufacturers are focusing on developing panels with improved insulation properties, higher strength-to-weight ratios, and enhanced fire resistance. The introduction of eco-friendly materials and sustainable manufacturing processes is also gaining traction. These innovations are aimed at enhancing product performance, meeting stricter building codes, and addressing environmental concerns. The market is seeing the integration of smart technologies, such as sensors for monitoring structural health and energy consumption. These developments are enhancing the overall value proposition of sandwiched panels, expanding their applications across various sectors.
Report Segmentation & Scope
This report provides a detailed segmentation of the sandwiched panels market based on product type (EPS, PUR, PIR, Glass Wool, Other), skin material (OSB, Plywood, Other), and application (Building Wall, Building Roof, Cold Storage). Each segment is analyzed based on market size, growth projections, and competitive dynamics. Growth projections are provided for each segment, offering insights into the potential for future expansion and opportunities for investment. Competitive dynamics within each segment are highlighted, showing the market share of leading players and their strategic initiatives. The report offers a granular understanding of market opportunities for each category.
Key Drivers of Sandwiched Panels Industry Growth
Several factors are driving the growth of the sandwiched panels market. Increased construction activities globally, coupled with rising demand for energy-efficient buildings, are primary growth drivers. Stringent building codes and regulations in many regions are encouraging the adoption of high-performance building materials, including sandwiched panels. Technological advancements leading to improved insulation, strength, and durability further propel market expansion. Government initiatives promoting sustainable construction practices are also contributing to market growth.
Challenges in the Sandwiched Panels Industry Sector
The sandwiched panels industry faces several challenges, including fluctuating raw material prices, which impact production costs and profitability. Supply chain disruptions can lead to delays and increased costs. Intense competition among manufacturers necessitates continuous innovation and differentiation. Regulatory compliance requirements can be complex and costly. Furthermore, the industry must address environmental concerns related to the production and disposal of certain panel components.
Leading Players in the Sandwiched Panels Industry Market
- ITALPANNELLI SRL
- METECNO
- ArcelorMittal
- Balex-Metal
- Tata Steel
- Rautaruukki Corporation
- Premium Building Systems
- Owens Corning
- Kingspan Group
- Multicolor Steels (India) Pvt Ltd
- Cornerstone Building Brands
- DANA Group of Companies
- Zamil Industrial Pre-Engineered Buildings Co Ltd
- Jiangsu Jingxue Insulation Technology Co Ltd
- Alubel SpA
- Nucor Building Systems
- Manni Group SpA
- PFB Corporation(Riverside)
Key Developments in Sandwiched Panels Industry Sector
- June 2022: Owens Corning announced the acquisition of WearDeck, strengthening its portfolio and expanding its expertise in decking and lumber. This move significantly boosts their market position and product offerings.
- January 2022: Owens Corning introduced its FOAMGLAS Perinsul SIP, a thermal bridge solution for high-performance buildings, improving energy efficiency and performance. This product launch showcases technological advancements within the industry.
Strategic Sandwiched Panels Industry Market Outlook
The sandwiched panels market is poised for continued growth, driven by the increasing adoption of sustainable and energy-efficient building practices globally. Further advancements in material science and manufacturing technologies will lead to the development of lighter, stronger, and more environmentally friendly panels. Expansion into new applications, particularly in the renewable energy sector, presents significant growth opportunities. Strategic partnerships and collaborations among industry players will further shape market dynamics. The market is expected to witness a considerable expansion in the forecast period, offering lucrative opportunities for businesses to capitalize on.
Sandwiched Panels Industry Segmentation
-
1. Product
- 1.1. EPS (Expanded Polystyrene) Panel
- 1.2. Rigid Po
- 1.3. Glass Wool Panel
- 1.4. Other Products (Extruded Polystyrene Foam)
-
2. Skin Material
- 2.1. Oriented Strand Board (OSB)
- 2.2. Plywood
- 2.3. Other Skin Materials (Cement Board)
-
3. Application
- 3.1. Building Wall
- 3.2. Building Roof
- 3.3. Cold Storage
Sandwiched Panels Industry Segmentation By Geography
-
1. Asia Pacific
- 1.1. China
- 1.2. India
- 1.3. Japan
- 1.4. South Korea
- 1.5. Rest of Asia Pacific
-
2. North America
- 2.1. United States
- 2.2. Canada
- 2.3. Mexico
- 2.4. Rest of North America
-
3. Europe
- 3.1. Germany
- 3.2. United Kingdom
- 3.3. Italy
- 3.4. France
- 3.5. Rest of Europe
-
4. South America
- 4.1. Brazil
- 4.2. Argentina
- 4.3. Rest of South America
-
5. Middle East and Africa
- 5.1. Saudi Arabia
- 5.2. South Africa
- 5.3. Rest of Middle East and Africa
Sandwiched Panels Industry REPORT HIGHLIGHTS
| Aspects | Details |
|---|---|
| Study Period | 2019-2033 |
| Base Year | 2024 |
| Estimated Year | 2025 |
| Forecast Period | 2025-2033 |
| Historical Period | 2019-2024 |
| Growth Rate | CAGR of 8.85% from 2019-2033 |
| Segmentation |
|
Table of Contents
- 1. Introduction
- 1.1. Research Scope
- 1.2. Market Segmentation
- 1.3. Research Methodology
- 1.4. Definitions and Assumptions
- 2. Executive Summary
- 2.1. Introduction
- 3. Market Dynamics
- 3.1. Introduction
- 3.2. Market Drivers
- 3.2.1. Increasing Demand from Construction Sector; Increasing Cold Storage Applications
- 3.3. Market Restrains
- 3.3.1 Advancements in Building Technologies
- 3.3.2 such as Modular Construction Techniques; Other Restraints
- 3.4. Market Trends
- 3.4.1. Increasing Demand from Building Walls
- 4. Market Factor Analysis
- 4.1. Porters Five Forces
- 4.2. Supply/Value Chain
- 4.3. PESTEL analysis
- 4.4. Market Entropy
- 4.5. Patent/Trademark Analysis
- 5. Global Sandwiched Panels Industry Analysis, Insights and Forecast, 2019-2031
- 5.1. Market Analysis, Insights and Forecast - by Product
- 5.1.1. EPS (Expanded Polystyrene) Panel
- 5.1.2. Rigid Po
- 5.1.3. Glass Wool Panel
- 5.1.4. Other Products (Extruded Polystyrene Foam)
- 5.2. Market Analysis, Insights and Forecast - by Skin Material
- 5.2.1. Oriented Strand Board (OSB)
- 5.2.2. Plywood
- 5.2.3. Other Skin Materials (Cement Board)
- 5.3. Market Analysis, Insights and Forecast - by Application
- 5.3.1. Building Wall
- 5.3.2. Building Roof
- 5.3.3. Cold Storage
- 5.4. Market Analysis, Insights and Forecast - by Region
- 5.4.1. Asia Pacific
- 5.4.2. North America
- 5.4.3. Europe
- 5.4.4. South America
- 5.4.5. Middle East and Africa
- 5.1. Market Analysis, Insights and Forecast - by Product
- 6. Asia Pacific Sandwiched Panels Industry Analysis, Insights and Forecast, 2019-2031
- 6.1. Market Analysis, Insights and Forecast - by Product
- 6.1.1. EPS (Expanded Polystyrene) Panel
- 6.1.2. Rigid Po
- 6.1.3. Glass Wool Panel
- 6.1.4. Other Products (Extruded Polystyrene Foam)
- 6.2. Market Analysis, Insights and Forecast - by Skin Material
- 6.2.1. Oriented Strand Board (OSB)
- 6.2.2. Plywood
- 6.2.3. Other Skin Materials (Cement Board)
- 6.3. Market Analysis, Insights and Forecast - by Application
- 6.3.1. Building Wall
- 6.3.2. Building Roof
- 6.3.3. Cold Storage
- 6.1. Market Analysis, Insights and Forecast - by Product
- 7. North America Sandwiched Panels Industry Analysis, Insights and Forecast, 2019-2031
- 7.1. Market Analysis, Insights and Forecast - by Product
- 7.1.1. EPS (Expanded Polystyrene) Panel
- 7.1.2. Rigid Po
- 7.1.3. Glass Wool Panel
- 7.1.4. Other Products (Extruded Polystyrene Foam)
- 7.2. Market Analysis, Insights and Forecast - by Skin Material
- 7.2.1. Oriented Strand Board (OSB)
- 7.2.2. Plywood
- 7.2.3. Other Skin Materials (Cement Board)
- 7.3. Market Analysis, Insights and Forecast - by Application
- 7.3.1. Building Wall
- 7.3.2. Building Roof
- 7.3.3. Cold Storage
- 7.1. Market Analysis, Insights and Forecast - by Product
- 8. Europe Sandwiched Panels Industry Analysis, Insights and Forecast, 2019-2031
- 8.1. Market Analysis, Insights and Forecast - by Product
- 8.1.1. EPS (Expanded Polystyrene) Panel
- 8.1.2. Rigid Po
- 8.1.3. Glass Wool Panel
- 8.1.4. Other Products (Extruded Polystyrene Foam)
- 8.2. Market Analysis, Insights and Forecast - by Skin Material
- 8.2.1. Oriented Strand Board (OSB)
- 8.2.2. Plywood
- 8.2.3. Other Skin Materials (Cement Board)
- 8.3. Market Analysis, Insights and Forecast - by Application
- 8.3.1. Building Wall
- 8.3.2. Building Roof
- 8.3.3. Cold Storage
- 8.1. Market Analysis, Insights and Forecast - by Product
- 9. South America Sandwiched Panels Industry Analysis, Insights and Forecast, 2019-2031
- 9.1. Market Analysis, Insights and Forecast - by Product
- 9.1.1. EPS (Expanded Polystyrene) Panel
- 9.1.2. Rigid Po
- 9.1.3. Glass Wool Panel
- 9.1.4. Other Products (Extruded Polystyrene Foam)
- 9.2. Market Analysis, Insights and Forecast - by Skin Material
- 9.2.1. Oriented Strand Board (OSB)
- 9.2.2. Plywood
- 9.2.3. Other Skin Materials (Cement Board)
- 9.3. Market Analysis, Insights and Forecast - by Application
- 9.3.1. Building Wall
- 9.3.2. Building Roof
- 9.3.3. Cold Storage
- 9.1. Market Analysis, Insights and Forecast - by Product
- 10. Middle East and Africa Sandwiched Panels Industry Analysis, Insights and Forecast, 2019-2031
- 10.1. Market Analysis, Insights and Forecast - by Product
- 10.1.1. EPS (Expanded Polystyrene) Panel
- 10.1.2. Rigid Po
- 10.1.3. Glass Wool Panel
- 10.1.4. Other Products (Extruded Polystyrene Foam)
- 10.2. Market Analysis, Insights and Forecast - by Skin Material
- 10.2.1. Oriented Strand Board (OSB)
- 10.2.2. Plywood
- 10.2.3. Other Skin Materials (Cement Board)
- 10.3. Market Analysis, Insights and Forecast - by Application
- 10.3.1. Building Wall
- 10.3.2. Building Roof
- 10.3.3. Cold Storage
- 10.1. Market Analysis, Insights and Forecast - by Product
- 11. North America Sandwiched Panels Industry Analysis, Insights and Forecast, 2019-2031
- 11.1. Market Analysis, Insights and Forecast - By Country/Sub-region
- 11.1.1 United States
- 11.1.2 Canada
- 11.1.3 Mexic
- 12. Europe Sandwiched Panels Industry Analysis, Insights and Forecast, 2019-2031
- 12.1. Market Analysis, Insights and Forecast - By Country/Sub-region
- 12.1.1 Germany
- 12.1.2 France
- 12.1.3 Italy
- 12.1.4 United Kingdom
- 12.1.5 Netherlands
- 12.1.6 Rest of Europe
- 13. Asia Pacific Sandwiched Panels Industry Analysis, Insights and Forecast, 2019-2031
- 13.1. Market Analysis, Insights and Forecast - By Country/Sub-region
- 13.1.1 China
- 13.1.2 Japan
- 13.1.3 India
- 13.1.4 South Korea
- 13.1.5 Taiwan
- 13.1.6 Australia
- 13.1.7 Rest of Asia-Pacific
- 14. South America Sandwiched Panels Industry Analysis, Insights and Forecast, 2019-2031
- 14.1. Market Analysis, Insights and Forecast - By Country/Sub-region
- 14.1.1 Brazil
- 14.1.2 Argentina
- 14.1.3 Rest of South America
- 15. MEA Sandwiched Panels Industry Analysis, Insights and Forecast, 2019-2031
- 15.1. Market Analysis, Insights and Forecast - By Country/Sub-region
- 15.1.1 Middle East
- 15.1.2 Africa
- 16. Competitive Analysis
- 16.1. Global Market Share Analysis 2024
- 16.2. Company Profiles
- 16.2.1 ITALPANNELLI SRL
- 16.2.1.1. Overview
- 16.2.1.2. Products
- 16.2.1.3. SWOT Analysis
- 16.2.1.4. Recent Developments
- 16.2.1.5. Financials (Based on Availability)
- 16.2.2 METECNO
- 16.2.2.1. Overview
- 16.2.2.2. Products
- 16.2.2.3. SWOT Analysis
- 16.2.2.4. Recent Developments
- 16.2.2.5. Financials (Based on Availability)
- 16.2.3 ArcelorMittal
- 16.2.3.1. Overview
- 16.2.3.2. Products
- 16.2.3.3. SWOT Analysis
- 16.2.3.4. Recent Developments
- 16.2.3.5. Financials (Based on Availability)
- 16.2.4 Balex-Metal
- 16.2.4.1. Overview
- 16.2.4.2. Products
- 16.2.4.3. SWOT Analysis
- 16.2.4.4. Recent Developments
- 16.2.4.5. Financials (Based on Availability)
- 16.2.5 Tata Steel
- 16.2.5.1. Overview
- 16.2.5.2. Products
- 16.2.5.3. SWOT Analysis
- 16.2.5.4. Recent Developments
- 16.2.5.5. Financials (Based on Availability)
- 16.2.6 Rautaruukki Corporation
- 16.2.6.1. Overview
- 16.2.6.2. Products
- 16.2.6.3. SWOT Analysis
- 16.2.6.4. Recent Developments
- 16.2.6.5. Financials (Based on Availability)
- 16.2.7 Premium Building Systems
- 16.2.7.1. Overview
- 16.2.7.2. Products
- 16.2.7.3. SWOT Analysis
- 16.2.7.4. Recent Developments
- 16.2.7.5. Financials (Based on Availability)
- 16.2.8 Owens Corning
- 16.2.8.1. Overview
- 16.2.8.2. Products
- 16.2.8.3. SWOT Analysis
- 16.2.8.4. Recent Developments
- 16.2.8.5. Financials (Based on Availability)
- 16.2.9 Kingspan Group
- 16.2.9.1. Overview
- 16.2.9.2. Products
- 16.2.9.3. SWOT Analysis
- 16.2.9.4. Recent Developments
- 16.2.9.5. Financials (Based on Availability)
- 16.2.10 Multicolor Steels (India) Pvt Ltd
- 16.2.10.1. Overview
- 16.2.10.2. Products
- 16.2.10.3. SWOT Analysis
- 16.2.10.4. Recent Developments
- 16.2.10.5. Financials (Based on Availability)
- 16.2.11 Cornerstone Building Brands
- 16.2.11.1. Overview
- 16.2.11.2. Products
- 16.2.11.3. SWOT Analysis
- 16.2.11.4. Recent Developments
- 16.2.11.5. Financials (Based on Availability)
- 16.2.12 DANA Group of Companies
- 16.2.12.1. Overview
- 16.2.12.2. Products
- 16.2.12.3. SWOT Analysis
- 16.2.12.4. Recent Developments
- 16.2.12.5. Financials (Based on Availability)
- 16.2.13 Zamil Industrial Pre-Engineered Buildings Co Ltd
- 16.2.13.1. Overview
- 16.2.13.2. Products
- 16.2.13.3. SWOT Analysis
- 16.2.13.4. Recent Developments
- 16.2.13.5. Financials (Based on Availability)
- 16.2.14 Jiangsu Jingxue Insulation Technology Co Ltd
- 16.2.14.1. Overview
- 16.2.14.2. Products
- 16.2.14.3. SWOT Analysis
- 16.2.14.4. Recent Developments
- 16.2.14.5. Financials (Based on Availability)
- 16.2.15 Alubel SpA
- 16.2.15.1. Overview
- 16.2.15.2. Products
- 16.2.15.3. SWOT Analysis
- 16.2.15.4. Recent Developments
- 16.2.15.5. Financials (Based on Availability)
- 16.2.16 Nucor Building Systems
- 16.2.16.1. Overview
- 16.2.16.2. Products
- 16.2.16.3. SWOT Analysis
- 16.2.16.4. Recent Developments
- 16.2.16.5. Financials (Based on Availability)
- 16.2.17 Manni Group SpA
- 16.2.17.1. Overview
- 16.2.17.2. Products
- 16.2.17.3. SWOT Analysis
- 16.2.17.4. Recent Developments
- 16.2.17.5. Financials (Based on Availability)
- 16.2.18 PFB Corporation(Riverside)
- 16.2.18.1. Overview
- 16.2.18.2. Products
- 16.2.18.3. SWOT Analysis
- 16.2.18.4. Recent Developments
- 16.2.18.5. Financials (Based on Availability)
- 16.2.1 ITALPANNELLI SRL
List of Figures
- Figure 1: Global Sandwiched Panels Industry Revenue Breakdown (Billion, %) by Region 2024 & 2032
- Figure 2: Global Sandwiched Panels Industry Volume Breakdown (Square Meters, %) by Region 2024 & 2032
- Figure 3: North America Sandwiched Panels Industry Revenue (Billion), by Country 2024 & 2032
- Figure 4: North America Sandwiched Panels Industry Volume (Square Meters), by Country 2024 & 2032
- Figure 5: North America Sandwiched Panels Industry Revenue Share (%), by Country 2024 & 2032
- Figure 6: North America Sandwiched Panels Industry Volume Share (%), by Country 2024 & 2032
- Figure 7: Europe Sandwiched Panels Industry Revenue (Billion), by Country 2024 & 2032
- Figure 8: Europe Sandwiched Panels Industry Volume (Square Meters), by Country 2024 & 2032
- Figure 9: Europe Sandwiched Panels Industry Revenue Share (%), by Country 2024 & 2032
- Figure 10: Europe Sandwiched Panels Industry Volume Share (%), by Country 2024 & 2032
- Figure 11: Asia Pacific Sandwiched Panels Industry Revenue (Billion), by Country 2024 & 2032
- Figure 12: Asia Pacific Sandwiched Panels Industry Volume (Square Meters), by Country 2024 & 2032
- Figure 13: Asia Pacific Sandwiched Panels Industry Revenue Share (%), by Country 2024 & 2032
- Figure 14: Asia Pacific Sandwiched Panels Industry Volume Share (%), by Country 2024 & 2032
- Figure 15: South America Sandwiched Panels Industry Revenue (Billion), by Country 2024 & 2032
- Figure 16: South America Sandwiched Panels Industry Volume (Square Meters), by Country 2024 & 2032
- Figure 17: South America Sandwiched Panels Industry Revenue Share (%), by Country 2024 & 2032
- Figure 18: South America Sandwiched Panels Industry Volume Share (%), by Country 2024 & 2032
- Figure 19: MEA Sandwiched Panels Industry Revenue (Billion), by Country 2024 & 2032
- Figure 20: MEA Sandwiched Panels Industry Volume (Square Meters), by Country 2024 & 2032
- Figure 21: MEA Sandwiched Panels Industry Revenue Share (%), by Country 2024 & 2032
- Figure 22: MEA Sandwiched Panels Industry Volume Share (%), by Country 2024 & 2032
- Figure 23: Asia Pacific Sandwiched Panels Industry Revenue (Billion), by Product 2024 & 2032
- Figure 24: Asia Pacific Sandwiched Panels Industry Volume (Square Meters), by Product 2024 & 2032
- Figure 25: Asia Pacific Sandwiched Panels Industry Revenue Share (%), by Product 2024 & 2032
- Figure 26: Asia Pacific Sandwiched Panels Industry Volume Share (%), by Product 2024 & 2032
- Figure 27: Asia Pacific Sandwiched Panels Industry Revenue (Billion), by Skin Material 2024 & 2032
- Figure 28: Asia Pacific Sandwiched Panels Industry Volume (Square Meters), by Skin Material 2024 & 2032
- Figure 29: Asia Pacific Sandwiched Panels Industry Revenue Share (%), by Skin Material 2024 & 2032
- Figure 30: Asia Pacific Sandwiched Panels Industry Volume Share (%), by Skin Material 2024 & 2032
- Figure 31: Asia Pacific Sandwiched Panels Industry Revenue (Billion), by Application 2024 & 2032
- Figure 32: Asia Pacific Sandwiched Panels Industry Volume (Square Meters), by Application 2024 & 2032
- Figure 33: Asia Pacific Sandwiched Panels Industry Revenue Share (%), by Application 2024 & 2032
- Figure 34: Asia Pacific Sandwiched Panels Industry Volume Share (%), by Application 2024 & 2032
- Figure 35: Asia Pacific Sandwiched Panels Industry Revenue (Billion), by Country 2024 & 2032
- Figure 36: Asia Pacific Sandwiched Panels Industry Volume (Square Meters), by Country 2024 & 2032
- Figure 37: Asia Pacific Sandwiched Panels Industry Revenue Share (%), by Country 2024 & 2032
- Figure 38: Asia Pacific Sandwiched Panels Industry Volume Share (%), by Country 2024 & 2032
- Figure 39: North America Sandwiched Panels Industry Revenue (Billion), by Product 2024 & 2032
- Figure 40: North America Sandwiched Panels Industry Volume (Square Meters), by Product 2024 & 2032
- Figure 41: North America Sandwiched Panels Industry Revenue Share (%), by Product 2024 & 2032
- Figure 42: North America Sandwiched Panels Industry Volume Share (%), by Product 2024 & 2032
- Figure 43: North America Sandwiched Panels Industry Revenue (Billion), by Skin Material 2024 & 2032
- Figure 44: North America Sandwiched Panels Industry Volume (Square Meters), by Skin Material 2024 & 2032
- Figure 45: North America Sandwiched Panels Industry Revenue Share (%), by Skin Material 2024 & 2032
- Figure 46: North America Sandwiched Panels Industry Volume Share (%), by Skin Material 2024 & 2032
- Figure 47: North America Sandwiched Panels Industry Revenue (Billion), by Application 2024 & 2032
- Figure 48: North America Sandwiched Panels Industry Volume (Square Meters), by Application 2024 & 2032
- Figure 49: North America Sandwiched Panels Industry Revenue Share (%), by Application 2024 & 2032
- Figure 50: North America Sandwiched Panels Industry Volume Share (%), by Application 2024 & 2032
- Figure 51: North America Sandwiched Panels Industry Revenue (Billion), by Country 2024 & 2032
- Figure 52: North America Sandwiched Panels Industry Volume (Square Meters), by Country 2024 & 2032
- Figure 53: North America Sandwiched Panels Industry Revenue Share (%), by Country 2024 & 2032
- Figure 54: North America Sandwiched Panels Industry Volume Share (%), by Country 2024 & 2032
- Figure 55: Europe Sandwiched Panels Industry Revenue (Billion), by Product 2024 & 2032
- Figure 56: Europe Sandwiched Panels Industry Volume (Square Meters), by Product 2024 & 2032
- Figure 57: Europe Sandwiched Panels Industry Revenue Share (%), by Product 2024 & 2032
- Figure 58: Europe Sandwiched Panels Industry Volume Share (%), by Product 2024 & 2032
- Figure 59: Europe Sandwiched Panels Industry Revenue (Billion), by Skin Material 2024 & 2032
- Figure 60: Europe Sandwiched Panels Industry Volume (Square Meters), by Skin Material 2024 & 2032
- Figure 61: Europe Sandwiched Panels Industry Revenue Share (%), by Skin Material 2024 & 2032
- Figure 62: Europe Sandwiched Panels Industry Volume Share (%), by Skin Material 2024 & 2032
- Figure 63: Europe Sandwiched Panels Industry Revenue (Billion), by Application 2024 & 2032
- Figure 64: Europe Sandwiched Panels Industry Volume (Square Meters), by Application 2024 & 2032
- Figure 65: Europe Sandwiched Panels Industry Revenue Share (%), by Application 2024 & 2032
- Figure 66: Europe Sandwiched Panels Industry Volume Share (%), by Application 2024 & 2032
- Figure 67: Europe Sandwiched Panels Industry Revenue (Billion), by Country 2024 & 2032
- Figure 68: Europe Sandwiched Panels Industry Volume (Square Meters), by Country 2024 & 2032
- Figure 69: Europe Sandwiched Panels Industry Revenue Share (%), by Country 2024 & 2032
- Figure 70: Europe Sandwiched Panels Industry Volume Share (%), by Country 2024 & 2032
- Figure 71: South America Sandwiched Panels Industry Revenue (Billion), by Product 2024 & 2032
- Figure 72: South America Sandwiched Panels Industry Volume (Square Meters), by Product 2024 & 2032
- Figure 73: South America Sandwiched Panels Industry Revenue Share (%), by Product 2024 & 2032
- Figure 74: South America Sandwiched Panels Industry Volume Share (%), by Product 2024 & 2032
- Figure 75: South America Sandwiched Panels Industry Revenue (Billion), by Skin Material 2024 & 2032
- Figure 76: South America Sandwiched Panels Industry Volume (Square Meters), by Skin Material 2024 & 2032
- Figure 77: South America Sandwiched Panels Industry Revenue Share (%), by Skin Material 2024 & 2032
- Figure 78: South America Sandwiched Panels Industry Volume Share (%), by Skin Material 2024 & 2032
- Figure 79: South America Sandwiched Panels Industry Revenue (Billion), by Application 2024 & 2032
- Figure 80: South America Sandwiched Panels Industry Volume (Square Meters), by Application 2024 & 2032
- Figure 81: South America Sandwiched Panels Industry Revenue Share (%), by Application 2024 & 2032
- Figure 82: South America Sandwiched Panels Industry Volume Share (%), by Application 2024 & 2032
- Figure 83: South America Sandwiched Panels Industry Revenue (Billion), by Country 2024 & 2032
- Figure 84: South America Sandwiched Panels Industry Volume (Square Meters), by Country 2024 & 2032
- Figure 85: South America Sandwiched Panels Industry Revenue Share (%), by Country 2024 & 2032
- Figure 86: South America Sandwiched Panels Industry Volume Share (%), by Country 2024 & 2032
- Figure 87: Middle East and Africa Sandwiched Panels Industry Revenue (Billion), by Product 2024 & 2032
- Figure 88: Middle East and Africa Sandwiched Panels Industry Volume (Square Meters), by Product 2024 & 2032
- Figure 89: Middle East and Africa Sandwiched Panels Industry Revenue Share (%), by Product 2024 & 2032
- Figure 90: Middle East and Africa Sandwiched Panels Industry Volume Share (%), by Product 2024 & 2032
- Figure 91: Middle East and Africa Sandwiched Panels Industry Revenue (Billion), by Skin Material 2024 & 2032
- Figure 92: Middle East and Africa Sandwiched Panels Industry Volume (Square Meters), by Skin Material 2024 & 2032
- Figure 93: Middle East and Africa Sandwiched Panels Industry Revenue Share (%), by Skin Material 2024 & 2032
- Figure 94: Middle East and Africa Sandwiched Panels Industry Volume Share (%), by Skin Material 2024 & 2032
- Figure 95: Middle East and Africa Sandwiched Panels Industry Revenue (Billion), by Application 2024 & 2032
- Figure 96: Middle East and Africa Sandwiched Panels Industry Volume (Square Meters), by Application 2024 & 2032
- Figure 97: Middle East and Africa Sandwiched Panels Industry Revenue Share (%), by Application 2024 & 2032
- Figure 98: Middle East and Africa Sandwiched Panels Industry Volume Share (%), by Application 2024 & 2032
- Figure 99: Middle East and Africa Sandwiched Panels Industry Revenue (Billion), by Country 2024 & 2032
- Figure 100: Middle East and Africa Sandwiched Panels Industry Volume (Square Meters), by Country 2024 & 2032
- Figure 101: Middle East and Africa Sandwiched Panels Industry Revenue Share (%), by Country 2024 & 2032
- Figure 102: Middle East and Africa Sandwiched Panels Industry Volume Share (%), by Country 2024 & 2032
List of Tables
- Table 1: Global Sandwiched Panels Industry Revenue Billion Forecast, by Region 2019 & 2032
- Table 2: Global Sandwiched Panels Industry Volume Square Meters Forecast, by Region 2019 & 2032
- Table 3: Global Sandwiched Panels Industry Revenue Billion Forecast, by Product 2019 & 2032
- Table 4: Global Sandwiched Panels Industry Volume Square Meters Forecast, by Product 2019 & 2032
- Table 5: Global Sandwiched Panels Industry Revenue Billion Forecast, by Skin Material 2019 & 2032
- Table 6: Global Sandwiched Panels Industry Volume Square Meters Forecast, by Skin Material 2019 & 2032
- Table 7: Global Sandwiched Panels Industry Revenue Billion Forecast, by Application 2019 & 2032
- Table 8: Global Sandwiched Panels Industry Volume Square Meters Forecast, by Application 2019 & 2032
- Table 9: Global Sandwiched Panels Industry Revenue Billion Forecast, by Region 2019 & 2032
- Table 10: Global Sandwiched Panels Industry Volume Square Meters Forecast, by Region 2019 & 2032
- Table 11: Global Sandwiched Panels Industry Revenue Billion Forecast, by Country 2019 & 2032
- Table 12: Global Sandwiched Panels Industry Volume Square Meters Forecast, by Country 2019 & 2032
- Table 13: United States Sandwiched Panels Industry Revenue (Billion) Forecast, by Application 2019 & 2032
- Table 14: United States Sandwiched Panels Industry Volume (Square Meters) Forecast, by Application 2019 & 2032
- Table 15: Canada Sandwiched Panels Industry Revenue (Billion) Forecast, by Application 2019 & 2032
- Table 16: Canada Sandwiched Panels Industry Volume (Square Meters) Forecast, by Application 2019 & 2032
- Table 17: Mexic Sandwiched Panels Industry Revenue (Billion) Forecast, by Application 2019 & 2032
- Table 18: Mexic Sandwiched Panels Industry Volume (Square Meters) Forecast, by Application 2019 & 2032
- Table 19: Global Sandwiched Panels Industry Revenue Billion Forecast, by Country 2019 & 2032
- Table 20: Global Sandwiched Panels Industry Volume Square Meters Forecast, by Country 2019 & 2032
- Table 21: Germany Sandwiched Panels Industry Revenue (Billion) Forecast, by Application 2019 & 2032
- Table 22: Germany Sandwiched Panels Industry Volume (Square Meters) Forecast, by Application 2019 & 2032
- Table 23: France Sandwiched Panels Industry Revenue (Billion) Forecast, by Application 2019 & 2032
- Table 24: France Sandwiched Panels Industry Volume (Square Meters) Forecast, by Application 2019 & 2032
- Table 25: Italy Sandwiched Panels Industry Revenue (Billion) Forecast, by Application 2019 & 2032
- Table 26: Italy Sandwiched Panels Industry Volume (Square Meters) Forecast, by Application 2019 & 2032
- Table 27: United Kingdom Sandwiched Panels Industry Revenue (Billion) Forecast, by Application 2019 & 2032
- Table 28: United Kingdom Sandwiched Panels Industry Volume (Square Meters) Forecast, by Application 2019 & 2032
- Table 29: Netherlands Sandwiched Panels Industry Revenue (Billion) Forecast, by Application 2019 & 2032
- Table 30: Netherlands Sandwiched Panels Industry Volume (Square Meters) Forecast, by Application 2019 & 2032
- Table 31: Rest of Europe Sandwiched Panels Industry Revenue (Billion) Forecast, by Application 2019 & 2032
- Table 32: Rest of Europe Sandwiched Panels Industry Volume (Square Meters) Forecast, by Application 2019 & 2032
- Table 33: Global Sandwiched Panels Industry Revenue Billion Forecast, by Country 2019 & 2032
- Table 34: Global Sandwiched Panels Industry Volume Square Meters Forecast, by Country 2019 & 2032
- Table 35: China Sandwiched Panels Industry Revenue (Billion) Forecast, by Application 2019 & 2032
- Table 36: China Sandwiched Panels Industry Volume (Square Meters) Forecast, by Application 2019 & 2032
- Table 37: Japan Sandwiched Panels Industry Revenue (Billion) Forecast, by Application 2019 & 2032
- Table 38: Japan Sandwiched Panels Industry Volume (Square Meters) Forecast, by Application 2019 & 2032
- Table 39: India Sandwiched Panels Industry Revenue (Billion) Forecast, by Application 2019 & 2032
- Table 40: India Sandwiched Panels Industry Volume (Square Meters) Forecast, by Application 2019 & 2032
- Table 41: South Korea Sandwiched Panels Industry Revenue (Billion) Forecast, by Application 2019 & 2032
- Table 42: South Korea Sandwiched Panels Industry Volume (Square Meters) Forecast, by Application 2019 & 2032
- Table 43: Taiwan Sandwiched Panels Industry Revenue (Billion) Forecast, by Application 2019 & 2032
- Table 44: Taiwan Sandwiched Panels Industry Volume (Square Meters) Forecast, by Application 2019 & 2032
- Table 45: Australia Sandwiched Panels Industry Revenue (Billion) Forecast, by Application 2019 & 2032
- Table 46: Australia Sandwiched Panels Industry Volume (Square Meters) Forecast, by Application 2019 & 2032
- Table 47: Rest of Asia-Pacific Sandwiched Panels Industry Revenue (Billion) Forecast, by Application 2019 & 2032
- Table 48: Rest of Asia-Pacific Sandwiched Panels Industry Volume (Square Meters) Forecast, by Application 2019 & 2032
- Table 49: Global Sandwiched Panels Industry Revenue Billion Forecast, by Country 2019 & 2032
- Table 50: Global Sandwiched Panels Industry Volume Square Meters Forecast, by Country 2019 & 2032
- Table 51: Brazil Sandwiched Panels Industry Revenue (Billion) Forecast, by Application 2019 & 2032
- Table 52: Brazil Sandwiched Panels Industry Volume (Square Meters) Forecast, by Application 2019 & 2032
- Table 53: Argentina Sandwiched Panels Industry Revenue (Billion) Forecast, by Application 2019 & 2032
- Table 54: Argentina Sandwiched Panels Industry Volume (Square Meters) Forecast, by Application 2019 & 2032
- Table 55: Rest of South America Sandwiched Panels Industry Revenue (Billion) Forecast, by Application 2019 & 2032
- Table 56: Rest of South America Sandwiched Panels Industry Volume (Square Meters) Forecast, by Application 2019 & 2032
- Table 57: Global Sandwiched Panels Industry Revenue Billion Forecast, by Country 2019 & 2032
- Table 58: Global Sandwiched Panels Industry Volume Square Meters Forecast, by Country 2019 & 2032
- Table 59: Middle East Sandwiched Panels Industry Revenue (Billion) Forecast, by Application 2019 & 2032
- Table 60: Middle East Sandwiched Panels Industry Volume (Square Meters) Forecast, by Application 2019 & 2032
- Table 61: Africa Sandwiched Panels Industry Revenue (Billion) Forecast, by Application 2019 & 2032
- Table 62: Africa Sandwiched Panels Industry Volume (Square Meters) Forecast, by Application 2019 & 2032
- Table 63: Global Sandwiched Panels Industry Revenue Billion Forecast, by Product 2019 & 2032
- Table 64: Global Sandwiched Panels Industry Volume Square Meters Forecast, by Product 2019 & 2032
- Table 65: Global Sandwiched Panels Industry Revenue Billion Forecast, by Skin Material 2019 & 2032
- Table 66: Global Sandwiched Panels Industry Volume Square Meters Forecast, by Skin Material 2019 & 2032
- Table 67: Global Sandwiched Panels Industry Revenue Billion Forecast, by Application 2019 & 2032
- Table 68: Global Sandwiched Panels Industry Volume Square Meters Forecast, by Application 2019 & 2032
- Table 69: Global Sandwiched Panels Industry Revenue Billion Forecast, by Country 2019 & 2032
- Table 70: Global Sandwiched Panels Industry Volume Square Meters Forecast, by Country 2019 & 2032
- Table 71: China Sandwiched Panels Industry Revenue (Billion) Forecast, by Application 2019 & 2032
- Table 72: China Sandwiched Panels Industry Volume (Square Meters) Forecast, by Application 2019 & 2032
- Table 73: India Sandwiched Panels Industry Revenue (Billion) Forecast, by Application 2019 & 2032
- Table 74: India Sandwiched Panels Industry Volume (Square Meters) Forecast, by Application 2019 & 2032
- Table 75: Japan Sandwiched Panels Industry Revenue (Billion) Forecast, by Application 2019 & 2032
- Table 76: Japan Sandwiched Panels Industry Volume (Square Meters) Forecast, by Application 2019 & 2032
- Table 77: South Korea Sandwiched Panels Industry Revenue (Billion) Forecast, by Application 2019 & 2032
- Table 78: South Korea Sandwiched Panels Industry Volume (Square Meters) Forecast, by Application 2019 & 2032
- Table 79: Rest of Asia Pacific Sandwiched Panels Industry Revenue (Billion) Forecast, by Application 2019 & 2032
- Table 80: Rest of Asia Pacific Sandwiched Panels Industry Volume (Square Meters) Forecast, by Application 2019 & 2032
- Table 81: Global Sandwiched Panels Industry Revenue Billion Forecast, by Product 2019 & 2032
- Table 82: Global Sandwiched Panels Industry Volume Square Meters Forecast, by Product 2019 & 2032
- Table 83: Global Sandwiched Panels Industry Revenue Billion Forecast, by Skin Material 2019 & 2032
- Table 84: Global Sandwiched Panels Industry Volume Square Meters Forecast, by Skin Material 2019 & 2032
- Table 85: Global Sandwiched Panels Industry Revenue Billion Forecast, by Application 2019 & 2032
- Table 86: Global Sandwiched Panels Industry Volume Square Meters Forecast, by Application 2019 & 2032
- Table 87: Global Sandwiched Panels Industry Revenue Billion Forecast, by Country 2019 & 2032
- Table 88: Global Sandwiched Panels Industry Volume Square Meters Forecast, by Country 2019 & 2032
- Table 89: United States Sandwiched Panels Industry Revenue (Billion) Forecast, by Application 2019 & 2032
- Table 90: United States Sandwiched Panels Industry Volume (Square Meters) Forecast, by Application 2019 & 2032
- Table 91: Canada Sandwiched Panels Industry Revenue (Billion) Forecast, by Application 2019 & 2032
- Table 92: Canada Sandwiched Panels Industry Volume (Square Meters) Forecast, by Application 2019 & 2032
- Table 93: Mexico Sandwiched Panels Industry Revenue (Billion) Forecast, by Application 2019 & 2032
- Table 94: Mexico Sandwiched Panels Industry Volume (Square Meters) Forecast, by Application 2019 & 2032
- Table 95: Rest of North America Sandwiched Panels Industry Revenue (Billion) Forecast, by Application 2019 & 2032
- Table 96: Rest of North America Sandwiched Panels Industry Volume (Square Meters) Forecast, by Application 2019 & 2032
- Table 97: Global Sandwiched Panels Industry Revenue Billion Forecast, by Product 2019 & 2032
- Table 98: Global Sandwiched Panels Industry Volume Square Meters Forecast, by Product 2019 & 2032
- Table 99: Global Sandwiched Panels Industry Revenue Billion Forecast, by Skin Material 2019 & 2032
- Table 100: Global Sandwiched Panels Industry Volume Square Meters Forecast, by Skin Material 2019 & 2032
- Table 101: Global Sandwiched Panels Industry Revenue Billion Forecast, by Application 2019 & 2032
- Table 102: Global Sandwiched Panels Industry Volume Square Meters Forecast, by Application 2019 & 2032
- Table 103: Global Sandwiched Panels Industry Revenue Billion Forecast, by Country 2019 & 2032
- Table 104: Global Sandwiched Panels Industry Volume Square Meters Forecast, by Country 2019 & 2032
- Table 105: Germany Sandwiched Panels Industry Revenue (Billion) Forecast, by Application 2019 & 2032
- Table 106: Germany Sandwiched Panels Industry Volume (Square Meters) Forecast, by Application 2019 & 2032
- Table 107: United Kingdom Sandwiched Panels Industry Revenue (Billion) Forecast, by Application 2019 & 2032
- Table 108: United Kingdom Sandwiched Panels Industry Volume (Square Meters) Forecast, by Application 2019 & 2032
- Table 109: Italy Sandwiched Panels Industry Revenue (Billion) Forecast, by Application 2019 & 2032
- Table 110: Italy Sandwiched Panels Industry Volume (Square Meters) Forecast, by Application 2019 & 2032
- Table 111: France Sandwiched Panels Industry Revenue (Billion) Forecast, by Application 2019 & 2032
- Table 112: France Sandwiched Panels Industry Volume (Square Meters) Forecast, by Application 2019 & 2032
- Table 113: Rest of Europe Sandwiched Panels Industry Revenue (Billion) Forecast, by Application 2019 & 2032
- Table 114: Rest of Europe Sandwiched Panels Industry Volume (Square Meters) Forecast, by Application 2019 & 2032
- Table 115: Global Sandwiched Panels Industry Revenue Billion Forecast, by Product 2019 & 2032
- Table 116: Global Sandwiched Panels Industry Volume Square Meters Forecast, by Product 2019 & 2032
- Table 117: Global Sandwiched Panels Industry Revenue Billion Forecast, by Skin Material 2019 & 2032
- Table 118: Global Sandwiched Panels Industry Volume Square Meters Forecast, by Skin Material 2019 & 2032
- Table 119: Global Sandwiched Panels Industry Revenue Billion Forecast, by Application 2019 & 2032
- Table 120: Global Sandwiched Panels Industry Volume Square Meters Forecast, by Application 2019 & 2032
- Table 121: Global Sandwiched Panels Industry Revenue Billion Forecast, by Country 2019 & 2032
- Table 122: Global Sandwiched Panels Industry Volume Square Meters Forecast, by Country 2019 & 2032
- Table 123: Brazil Sandwiched Panels Industry Revenue (Billion) Forecast, by Application 2019 & 2032
- Table 124: Brazil Sandwiched Panels Industry Volume (Square Meters) Forecast, by Application 2019 & 2032
- Table 125: Argentina Sandwiched Panels Industry Revenue (Billion) Forecast, by Application 2019 & 2032
- Table 126: Argentina Sandwiched Panels Industry Volume (Square Meters) Forecast, by Application 2019 & 2032
- Table 127: Rest of South America Sandwiched Panels Industry Revenue (Billion) Forecast, by Application 2019 & 2032
- Table 128: Rest of South America Sandwiched Panels Industry Volume (Square Meters) Forecast, by Application 2019 & 2032
- Table 129: Global Sandwiched Panels Industry Revenue Billion Forecast, by Product 2019 & 2032
- Table 130: Global Sandwiched Panels Industry Volume Square Meters Forecast, by Product 2019 & 2032
- Table 131: Global Sandwiched Panels Industry Revenue Billion Forecast, by Skin Material 2019 & 2032
- Table 132: Global Sandwiched Panels Industry Volume Square Meters Forecast, by Skin Material 2019 & 2032
- Table 133: Global Sandwiched Panels Industry Revenue Billion Forecast, by Application 2019 & 2032
- Table 134: Global Sandwiched Panels Industry Volume Square Meters Forecast, by Application 2019 & 2032
- Table 135: Global Sandwiched Panels Industry Revenue Billion Forecast, by Country 2019 & 2032
- Table 136: Global Sandwiched Panels Industry Volume Square Meters Forecast, by Country 2019 & 2032
- Table 137: Saudi Arabia Sandwiched Panels Industry Revenue (Billion) Forecast, by Application 2019 & 2032
- Table 138: Saudi Arabia Sandwiched Panels Industry Volume (Square Meters) Forecast, by Application 2019 & 2032
- Table 139: South Africa Sandwiched Panels Industry Revenue (Billion) Forecast, by Application 2019 & 2032
- Table 140: South Africa Sandwiched Panels Industry Volume (Square Meters) Forecast, by Application 2019 & 2032
- Table 141: Rest of Middle East and Africa Sandwiched Panels Industry Revenue (Billion) Forecast, by Application 2019 & 2032
- Table 142: Rest of Middle East and Africa Sandwiched Panels Industry Volume (Square Meters) Forecast, by Application 2019 & 2032
Frequently Asked Questions
1. What is the projected Compound Annual Growth Rate (CAGR) of the Sandwiched Panels Industry?
The projected CAGR is approximately 8.85%.
2. Which companies are prominent players in the Sandwiched Panels Industry?
Key companies in the market include ITALPANNELLI SRL, METECNO, ArcelorMittal, Balex-Metal, Tata Steel, Rautaruukki Corporation, Premium Building Systems, Owens Corning, Kingspan Group, Multicolor Steels (India) Pvt Ltd, Cornerstone Building Brands, DANA Group of Companies, Zamil Industrial Pre-Engineered Buildings Co Ltd, Jiangsu Jingxue Insulation Technology Co Ltd, Alubel SpA, Nucor Building Systems, Manni Group SpA, PFB Corporation(Riverside).
3. What are the main segments of the Sandwiched Panels Industry?
The market segments include Product, Skin Material, Application.
4. Can you provide details about the market size?
The market size is estimated to be USD 1.95 Billion as of 2022.
5. What are some drivers contributing to market growth?
Increasing Demand from Construction Sector; Increasing Cold Storage Applications.
6. What are the notable trends driving market growth?
Increasing Demand from Building Walls.
7. Are there any restraints impacting market growth?
Advancements in Building Technologies. such as Modular Construction Techniques; Other Restraints.
8. Can you provide examples of recent developments in the market?
June 2022: Owens Corning announced the acquisition of a Florida-based composite decking and structural lumber manufacturer, WearDeck. With the acquisition, Owens Corning would strengthen its portfolio of weather-resistant decking and structural lumber and expand its expertise in both commercial and residential applications.
9. What pricing options are available for accessing the report?
Pricing options include single-user, multi-user, and enterprise licenses priced at USD 4750, USD 5250, and USD 8750 respectively.
10. Is the market size provided in terms of value or volume?
The market size is provided in terms of value, measured in Billion and volume, measured in Square Meters.
11. Are there any specific market keywords associated with the report?
Yes, the market keyword associated with the report is "Sandwiched Panels Industry," which aids in identifying and referencing the specific market segment covered.
12. How do I determine which pricing option suits my needs best?
The pricing options vary based on user requirements and access needs. Individual users may opt for single-user licenses, while businesses requiring broader access may choose multi-user or enterprise licenses for cost-effective access to the report.
13. Are there any additional resources or data provided in the Sandwiched Panels Industry report?
While the report offers comprehensive insights, it's advisable to review the specific contents or supplementary materials provided to ascertain if additional resources or data are available.
14. How can I stay updated on further developments or reports in the Sandwiched Panels Industry?
To stay informed about further developments, trends, and reports in the Sandwiched Panels Industry, consider subscribing to industry newsletters, following relevant companies and organizations, or regularly checking reputable industry news sources and publications.
Methodology
Step 1 - Identification of Relevant Samples Size from Population Database


Step 2 - Approaches for Defining Global Market Size (Value, Volume* & Price*)

Note*: In applicable scenarios
Step 3 - Data Sources
Primary Research
- Web Analytics
- Survey Reports
- Research Institute
- Latest Research Reports
- Opinion Leaders
Secondary Research
- Annual Reports
- White Paper
- Latest Press Release
- Industry Association
- Paid Database
- Investor Presentations

Step 4 - Data Triangulation
Involves using different sources of information in order to increase the validity of a study
These sources are likely to be stakeholders in a program - participants, other researchers, program staff, other community members, and so on.
Then we put all data in single framework & apply various statistical tools to find out the dynamic on the market.
During the analysis stage, feedback from the stakeholder groups would be compared to determine areas of agreement as well as areas of divergence


