
Key Insights
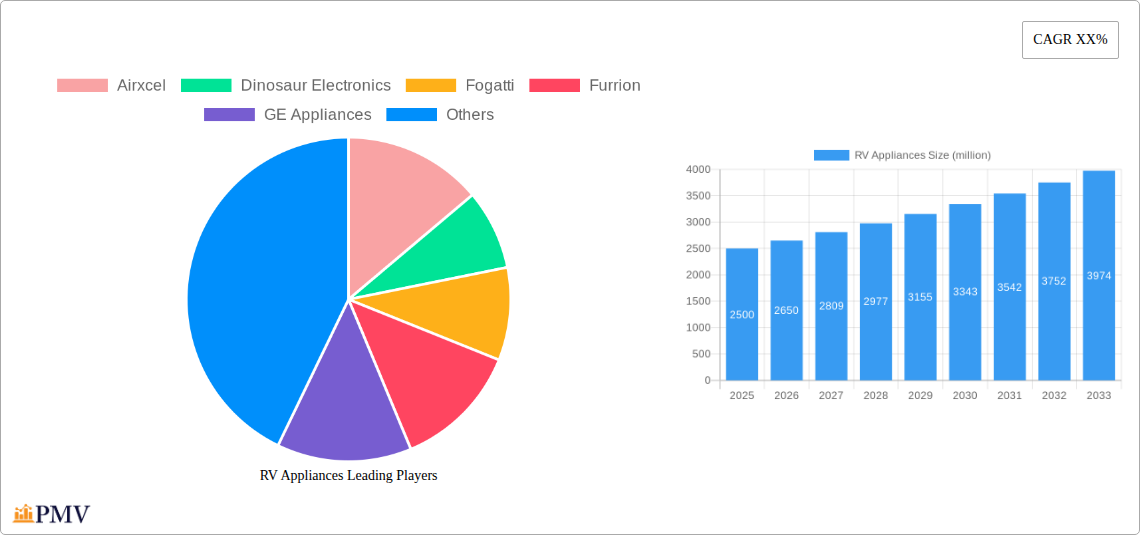
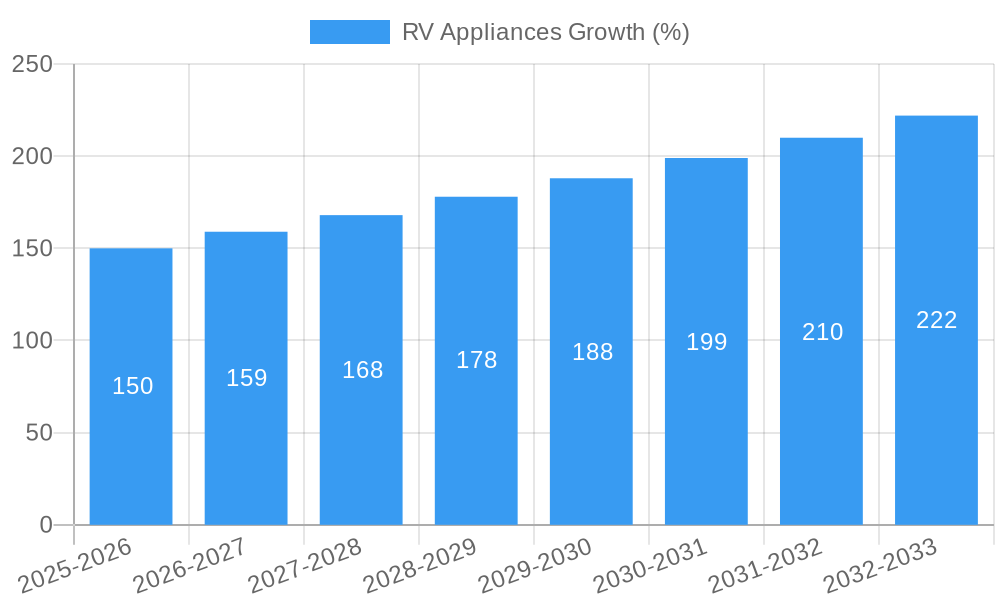
The RV appliance market is experiencing robust growth, driven by increasing demand for recreational vehicles and a preference for enhanced comfort and convenience during RV travel. The market, estimated at $2.5 billion in 2025, is projected to exhibit a Compound Annual Growth Rate (CAGR) of 6% from 2025 to 2033, reaching approximately $4 billion by the end of the forecast period. Several factors contribute to this expansion. Firstly, the rising popularity of RVing as a travel and leisure activity, particularly among millennials and Gen X, fuels demand for high-quality, efficient appliances. Secondly, technological advancements, such as the integration of smart features and energy-efficient designs, are driving product innovation and consumer adoption. Furthermore, the expansion of RV parks and campgrounds, coupled with improved infrastructure, supports the growth of the market. Leading manufacturers like Airxcel, Suburban, and Dometic are continuously investing in research and development to cater to the evolving consumer preferences, leading to a wide array of choices in terms of functionality and aesthetics.
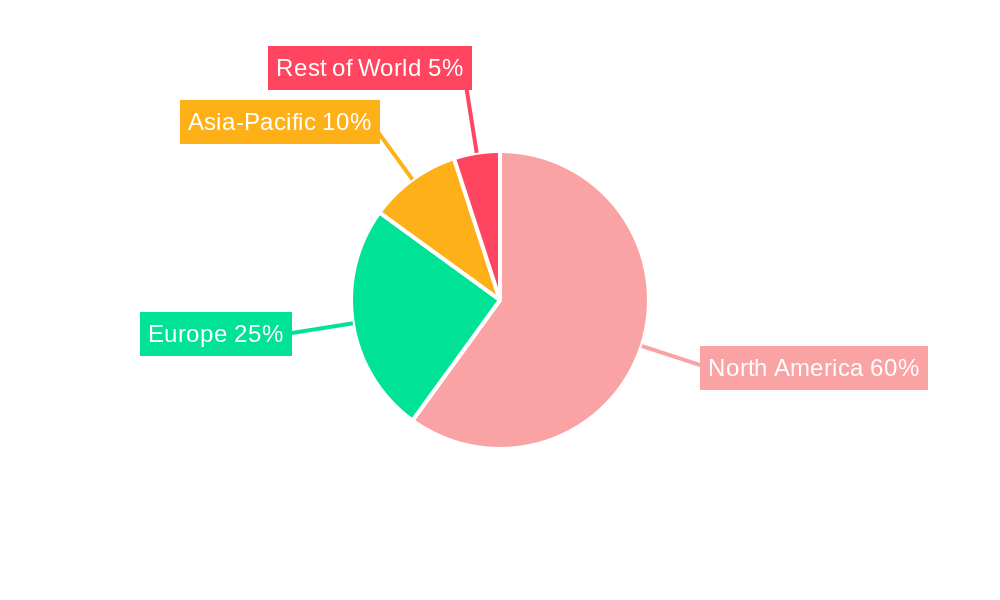
However, the market also faces some challenges. The high initial cost of RVs and appliances can be a barrier for some potential buyers. Fluctuations in raw material prices and supply chain disruptions can impact manufacturing costs and product availability. Nevertheless, the long-term outlook for the RV appliance market remains positive, particularly as manufacturers explore sustainable and eco-friendly options to address growing environmental concerns. Segmentation within the market includes refrigerators, ovens, microwaves, air conditioners, and other essential appliances, each with its own growth trajectory influenced by specific technological advancements and consumer preferences. The North American market currently dominates global RV appliance sales, but growing interest in RV travel in Europe and Asia-Pacific regions presents significant opportunities for future expansion.
RV Appliances Market Report: A Comprehensive Analysis (2019-2033)
This comprehensive report provides an in-depth analysis of the global RV appliances market, offering invaluable insights for industry stakeholders, investors, and strategic decision-makers. With a study period spanning 2019-2033, a base year of 2025, and an estimated and forecast period of 2025-2033, this report unveils the market's historical performance, current status, and future trajectory. The report leverages extensive data analysis to project a market size exceeding $XX million by 2033, revealing significant growth opportunities. This report covers key players including Airxcel, Dinosaur Electronics, Fogatti, Furrion, GE Appliances, Indel B, JR Products, Sawafuji, Shoreline, Suburban, Thetford, U-Line, Valterra, Veco SpA, Vitrifrigo, and Westland, providing a granular understanding of the competitive landscape.
RV Appliances Market Structure & Competitive Dynamics
The RV appliances market is characterized by a moderately consolidated structure, with several key players commanding significant market share. The top five players—Suburban, Dometic (including brands like Waeco and Indel B), Thetford, Airxcel, and Furrion—collectively account for approximately XX% of the global market in 2025. The market exhibits a dynamic competitive landscape influenced by innovation ecosystems and regulatory frameworks governing appliance safety and energy efficiency. Product substitution, particularly with the increasing adoption of energy-efficient and smart appliances, is a significant factor. End-user trends toward luxury and convenience in RV travel drive demand for high-end appliances. M&A activity in the sector has been relatively moderate over the historical period (2019-2024), with a total deal value estimated at $XX million. However, future consolidation is expected as larger players seek to expand their market reach and product portfolios.
- Market Concentration: Moderately consolidated, with top 5 players holding approximately XX% market share in 2025.
- Innovation Ecosystems: Strong focus on energy efficiency, smart technology integration, and compact design innovations.
- Regulatory Frameworks: Stringent safety and emission standards influence product development and market access.
- Product Substitutes: Growth of energy-efficient alternatives and smart home technology integration poses a potential competitive threat.
- End-User Trends: Growing preference for luxury and convenience features within RVs drives demand for higher-priced appliances.
- M&A Activity: Total deal value estimated at $XX million (2019-2024), with potential for increased consolidation in the forecast period.
RV Appliances Industry Trends & Insights
The RV appliances market is experiencing robust growth, driven by several key factors. The rising popularity of recreational vehicle travel, fueled by increased disposable incomes and a desire for experiential travel, is a primary driver. Technological advancements, such as the integration of smart technology and energy-efficient components, are enhancing the appeal of RV appliances. Consumer preferences are shifting towards premium features, compact designs, and durable materials. Competitive dynamics are characterized by continuous innovation, product differentiation, and strategic partnerships. The CAGR for the market during the forecast period (2025-2033) is projected to be XX%, with a market penetration rate of XX% by 2033. This robust growth is further fueled by the expansion of the RV park and campground infrastructure which significantly enhances the overall RV experience.
Dominant Markets & Segments in RV Appliances
North America currently dominates the global RV appliances market, holding the largest market share, followed by Europe. This dominance is primarily attributed to higher RV ownership rates, robust RV tourism infrastructure, and strong consumer spending in these regions. The Class A RV segment currently holds a significant market share, owing to its higher appliance capacity and consumer preference for larger, more luxurious RVs. The strong presence of major RV manufacturers in these regions and supportive government policies fostering tourism contribute to the dominance.
- Key Drivers in North America: High RV ownership rates, well-established RV parks, robust tourism industry, and high consumer disposable income.
- Key Drivers in Europe: Growing popularity of RV travel, development of RV-friendly infrastructure, and increasing investment in the sector.
- Class A RV Segment Dominance: Higher appliance capacity, luxury features, and consumer preference for larger RVs.
RV Appliances Product Innovations
Recent product innovations focus on energy efficiency, smart technology integration, and compact designs. Manufacturers are increasingly incorporating features like solar-powered appliances, smart controls, and improved insulation to reduce energy consumption and enhance user experience. These innovations cater to the growing consumer demand for sustainable and convenient RV appliances while enhancing the overall comfort and functionality of the RV living experience.
Report Segmentation & Scope
This report segments the RV appliances market by type (refrigerators, ovens, microwaves, air conditioners, water heaters, etc.), RV type (Class A, Class B, Class C, travel trailers, fifth wheels), fuel type (gas, electric, propane), and region (North America, Europe, Asia-Pacific, etc.). Each segment provides detailed market size estimations, growth projections, and competitive landscape analysis. For instance, the refrigerator segment is anticipated to experience strong growth due to advancements in energy efficiency and compact designs.
Key Drivers of RV Appliances Growth
The growth of the RV appliances market is primarily fueled by the increasing popularity of RV travel, rising disposable incomes, and technological advancements leading to more efficient and feature-rich appliances. Furthermore, government initiatives promoting sustainable tourism and infrastructure development in RV parks are contributing to market expansion. Improved energy efficiency and smart home technology integration are also key factors driving consumer demand.
Challenges in the RV Appliances Sector
The RV appliances sector faces challenges such as fluctuating raw material prices, supply chain disruptions, and intense competition. Stricter regulatory requirements regarding energy efficiency and safety standards can also increase production costs. These factors can impact profitability and market growth, necessitating strategic adaptations by manufacturers.
Leading Players in the RV Appliances Market
- Airxcel
- Dinosaur Electronics
- Fogatti
- Furrion
- GE Appliances
- Indel B
- JR Products
- Sawafuji
- Shoreline
- Suburban
- Thetford
- U-Line
- Valterra
- Veco SpA
- Vitrifrigo
- Westland
Key Developments in RV Appliances Sector
- 2022-Q4: Suburban launches a new line of energy-efficient RV refrigerators.
- 2023-Q1: Airxcel introduces a smart air conditioning system with remote control capabilities.
- 2023-Q3: Furrion announces a strategic partnership to integrate smart home technology into their RV appliances.
Strategic RV Appliances Market Outlook
The future of the RV appliances market looks promising, with continued growth driven by technological innovation, consumer preference for enhanced features, and expanding RV tourism. Strategic opportunities lie in developing sustainable and smart appliances, catering to the growing demand for environmentally friendly and technologically advanced RV solutions. Focusing on product differentiation, strategic partnerships, and efficient supply chain management will be crucial for success in this dynamic market.
RV Appliances Segmentation
-
1. Application
- 1.1. RVs
- 1.2. Trailer RVs
- 1.3. Others
-
2. Types
- 2.1. Built-In Type
- 2.2. Portable Type
- 2.3. Others
RV Appliances Segmentation By Geography
-
1. North America
- 1.1. United States
- 1.2. Canada
- 1.3. Mexico
-
2. South America
- 2.1. Brazil
- 2.2. Argentina
- 2.3. Rest of South America
-
3. Europe
- 3.1. United Kingdom
- 3.2. Germany
- 3.3. France
- 3.4. Italy
- 3.5. Spain
- 3.6. Russia
- 3.7. Benelux
- 3.8. Nordics
- 3.9. Rest of Europe
-
4. Middle East & Africa
- 4.1. Turkey
- 4.2. Israel
- 4.3. GCC
- 4.4. North Africa
- 4.5. South Africa
- 4.6. Rest of Middle East & Africa
-
5. Asia Pacific
- 5.1. China
- 5.2. India
- 5.3. Japan
- 5.4. South Korea
- 5.5. ASEAN
- 5.6. Oceania
- 5.7. Rest of Asia Pacific
RV Appliances REPORT HIGHLIGHTS
| Aspects | Details |
|---|---|
| Study Period | 2019-2033 |
| Base Year | 2024 |
| Estimated Year | 2025 |
| Forecast Period | 2025-2033 |
| Historical Period | 2019-2024 |
| Growth Rate | CAGR of XX% from 2019-2033 |
| Segmentation |
|
Table of Contents
- 1. Introduction
- 1.1. Research Scope
- 1.2. Market Segmentation
- 1.3. Research Methodology
- 1.4. Definitions and Assumptions
- 2. Executive Summary
- 2.1. Introduction
- 3. Market Dynamics
- 3.1. Introduction
- 3.2. Market Drivers
- 3.3. Market Restrains
- 3.4. Market Trends
- 4. Market Factor Analysis
- 4.1. Porters Five Forces
- 4.2. Supply/Value Chain
- 4.3. PESTEL analysis
- 4.4. Market Entropy
- 4.5. Patent/Trademark Analysis
- 5. Global RV Appliances Analysis, Insights and Forecast, 2019-2031
- 5.1. Market Analysis, Insights and Forecast - by Application
- 5.1.1. RVs
- 5.1.2. Trailer RVs
- 5.1.3. Others
- 5.2. Market Analysis, Insights and Forecast - by Types
- 5.2.1. Built-In Type
- 5.2.2. Portable Type
- 5.2.3. Others
- 5.3. Market Analysis, Insights and Forecast - by Region
- 5.3.1. North America
- 5.3.2. South America
- 5.3.3. Europe
- 5.3.4. Middle East & Africa
- 5.3.5. Asia Pacific
- 5.1. Market Analysis, Insights and Forecast - by Application
- 6. North America RV Appliances Analysis, Insights and Forecast, 2019-2031
- 6.1. Market Analysis, Insights and Forecast - by Application
- 6.1.1. RVs
- 6.1.2. Trailer RVs
- 6.1.3. Others
- 6.2. Market Analysis, Insights and Forecast - by Types
- 6.2.1. Built-In Type
- 6.2.2. Portable Type
- 6.2.3. Others
- 6.1. Market Analysis, Insights and Forecast - by Application
- 7. South America RV Appliances Analysis, Insights and Forecast, 2019-2031
- 7.1. Market Analysis, Insights and Forecast - by Application
- 7.1.1. RVs
- 7.1.2. Trailer RVs
- 7.1.3. Others
- 7.2. Market Analysis, Insights and Forecast - by Types
- 7.2.1. Built-In Type
- 7.2.2. Portable Type
- 7.2.3. Others
- 7.1. Market Analysis, Insights and Forecast - by Application
- 8. Europe RV Appliances Analysis, Insights and Forecast, 2019-2031
- 8.1. Market Analysis, Insights and Forecast - by Application
- 8.1.1. RVs
- 8.1.2. Trailer RVs
- 8.1.3. Others
- 8.2. Market Analysis, Insights and Forecast - by Types
- 8.2.1. Built-In Type
- 8.2.2. Portable Type
- 8.2.3. Others
- 8.1. Market Analysis, Insights and Forecast - by Application
- 9. Middle East & Africa RV Appliances Analysis, Insights and Forecast, 2019-2031
- 9.1. Market Analysis, Insights and Forecast - by Application
- 9.1.1. RVs
- 9.1.2. Trailer RVs
- 9.1.3. Others
- 9.2. Market Analysis, Insights and Forecast - by Types
- 9.2.1. Built-In Type
- 9.2.2. Portable Type
- 9.2.3. Others
- 9.1. Market Analysis, Insights and Forecast - by Application
- 10. Asia Pacific RV Appliances Analysis, Insights and Forecast, 2019-2031
- 10.1. Market Analysis, Insights and Forecast - by Application
- 10.1.1. RVs
- 10.1.2. Trailer RVs
- 10.1.3. Others
- 10.2. Market Analysis, Insights and Forecast - by Types
- 10.2.1. Built-In Type
- 10.2.2. Portable Type
- 10.2.3. Others
- 10.1. Market Analysis, Insights and Forecast - by Application
- 11. Competitive Analysis
- 11.1. Global Market Share Analysis 2024
- 11.2. Company Profiles
- 11.2.1 Airxcel
- 11.2.1.1. Overview
- 11.2.1.2. Products
- 11.2.1.3. SWOT Analysis
- 11.2.1.4. Recent Developments
- 11.2.1.5. Financials (Based on Availability)
- 11.2.2 Dinosaur Electronics
- 11.2.2.1. Overview
- 11.2.2.2. Products
- 11.2.2.3. SWOT Analysis
- 11.2.2.4. Recent Developments
- 11.2.2.5. Financials (Based on Availability)
- 11.2.3 Fogatti
- 11.2.3.1. Overview
- 11.2.3.2. Products
- 11.2.3.3. SWOT Analysis
- 11.2.3.4. Recent Developments
- 11.2.3.5. Financials (Based on Availability)
- 11.2.4 Furrion
- 11.2.4.1. Overview
- 11.2.4.2. Products
- 11.2.4.3. SWOT Analysis
- 11.2.4.4. Recent Developments
- 11.2.4.5. Financials (Based on Availability)
- 11.2.5 GE Appliances
- 11.2.5.1. Overview
- 11.2.5.2. Products
- 11.2.5.3. SWOT Analysis
- 11.2.5.4. Recent Developments
- 11.2.5.5. Financials (Based on Availability)
- 11.2.6 Indel B
- 11.2.6.1. Overview
- 11.2.6.2. Products
- 11.2.6.3. SWOT Analysis
- 11.2.6.4. Recent Developments
- 11.2.6.5. Financials (Based on Availability)
- 11.2.7 JR Products
- 11.2.7.1. Overview
- 11.2.7.2. Products
- 11.2.7.3. SWOT Analysis
- 11.2.7.4. Recent Developments
- 11.2.7.5. Financials (Based on Availability)
- 11.2.8 Sawafuji
- 11.2.8.1. Overview
- 11.2.8.2. Products
- 11.2.8.3. SWOT Analysis
- 11.2.8.4. Recent Developments
- 11.2.8.5. Financials (Based on Availability)
- 11.2.9 Shoreline
- 11.2.9.1. Overview
- 11.2.9.2. Products
- 11.2.9.3. SWOT Analysis
- 11.2.9.4. Recent Developments
- 11.2.9.5. Financials (Based on Availability)
- 11.2.10 Suburban
- 11.2.10.1. Overview
- 11.2.10.2. Products
- 11.2.10.3. SWOT Analysis
- 11.2.10.4. Recent Developments
- 11.2.10.5. Financials (Based on Availability)
- 11.2.11 Thetford
- 11.2.11.1. Overview
- 11.2.11.2. Products
- 11.2.11.3. SWOT Analysis
- 11.2.11.4. Recent Developments
- 11.2.11.5. Financials (Based on Availability)
- 11.2.12 U-Line
- 11.2.12.1. Overview
- 11.2.12.2. Products
- 11.2.12.3. SWOT Analysis
- 11.2.12.4. Recent Developments
- 11.2.12.5. Financials (Based on Availability)
- 11.2.13 Valterra
- 11.2.13.1. Overview
- 11.2.13.2. Products
- 11.2.13.3. SWOT Analysis
- 11.2.13.4. Recent Developments
- 11.2.13.5. Financials (Based on Availability)
- 11.2.14 Veco SpA
- 11.2.14.1. Overview
- 11.2.14.2. Products
- 11.2.14.3. SWOT Analysis
- 11.2.14.4. Recent Developments
- 11.2.14.5. Financials (Based on Availability)
- 11.2.15 Vitrifrigo
- 11.2.15.1. Overview
- 11.2.15.2. Products
- 11.2.15.3. SWOT Analysis
- 11.2.15.4. Recent Developments
- 11.2.15.5. Financials (Based on Availability)
- 11.2.16 Westland
- 11.2.16.1. Overview
- 11.2.16.2. Products
- 11.2.16.3. SWOT Analysis
- 11.2.16.4. Recent Developments
- 11.2.16.5. Financials (Based on Availability)
- 11.2.1 Airxcel
List of Figures
- Figure 1: Global RV Appliances Revenue Breakdown (million, %) by Region 2024 & 2032
- Figure 2: North America RV Appliances Revenue (million), by Application 2024 & 2032
- Figure 3: North America RV Appliances Revenue Share (%), by Application 2024 & 2032
- Figure 4: North America RV Appliances Revenue (million), by Types 2024 & 2032
- Figure 5: North America RV Appliances Revenue Share (%), by Types 2024 & 2032
- Figure 6: North America RV Appliances Revenue (million), by Country 2024 & 2032
- Figure 7: North America RV Appliances Revenue Share (%), by Country 2024 & 2032
- Figure 8: South America RV Appliances Revenue (million), by Application 2024 & 2032
- Figure 9: South America RV Appliances Revenue Share (%), by Application 2024 & 2032
- Figure 10: South America RV Appliances Revenue (million), by Types 2024 & 2032
- Figure 11: South America RV Appliances Revenue Share (%), by Types 2024 & 2032
- Figure 12: South America RV Appliances Revenue (million), by Country 2024 & 2032
- Figure 13: South America RV Appliances Revenue Share (%), by Country 2024 & 2032
- Figure 14: Europe RV Appliances Revenue (million), by Application 2024 & 2032
- Figure 15: Europe RV Appliances Revenue Share (%), by Application 2024 & 2032
- Figure 16: Europe RV Appliances Revenue (million), by Types 2024 & 2032
- Figure 17: Europe RV Appliances Revenue Share (%), by Types 2024 & 2032
- Figure 18: Europe RV Appliances Revenue (million), by Country 2024 & 2032
- Figure 19: Europe RV Appliances Revenue Share (%), by Country 2024 & 2032
- Figure 20: Middle East & Africa RV Appliances Revenue (million), by Application 2024 & 2032
- Figure 21: Middle East & Africa RV Appliances Revenue Share (%), by Application 2024 & 2032
- Figure 22: Middle East & Africa RV Appliances Revenue (million), by Types 2024 & 2032
- Figure 23: Middle East & Africa RV Appliances Revenue Share (%), by Types 2024 & 2032
- Figure 24: Middle East & Africa RV Appliances Revenue (million), by Country 2024 & 2032
- Figure 25: Middle East & Africa RV Appliances Revenue Share (%), by Country 2024 & 2032
- Figure 26: Asia Pacific RV Appliances Revenue (million), by Application 2024 & 2032
- Figure 27: Asia Pacific RV Appliances Revenue Share (%), by Application 2024 & 2032
- Figure 28: Asia Pacific RV Appliances Revenue (million), by Types 2024 & 2032
- Figure 29: Asia Pacific RV Appliances Revenue Share (%), by Types 2024 & 2032
- Figure 30: Asia Pacific RV Appliances Revenue (million), by Country 2024 & 2032
- Figure 31: Asia Pacific RV Appliances Revenue Share (%), by Country 2024 & 2032
List of Tables
- Table 1: Global RV Appliances Revenue million Forecast, by Region 2019 & 2032
- Table 2: Global RV Appliances Revenue million Forecast, by Application 2019 & 2032
- Table 3: Global RV Appliances Revenue million Forecast, by Types 2019 & 2032
- Table 4: Global RV Appliances Revenue million Forecast, by Region 2019 & 2032
- Table 5: Global RV Appliances Revenue million Forecast, by Application 2019 & 2032
- Table 6: Global RV Appliances Revenue million Forecast, by Types 2019 & 2032
- Table 7: Global RV Appliances Revenue million Forecast, by Country 2019 & 2032
- Table 8: United States RV Appliances Revenue (million) Forecast, by Application 2019 & 2032
- Table 9: Canada RV Appliances Revenue (million) Forecast, by Application 2019 & 2032
- Table 10: Mexico RV Appliances Revenue (million) Forecast, by Application 2019 & 2032
- Table 11: Global RV Appliances Revenue million Forecast, by Application 2019 & 2032
- Table 12: Global RV Appliances Revenue million Forecast, by Types 2019 & 2032
- Table 13: Global RV Appliances Revenue million Forecast, by Country 2019 & 2032
- Table 14: Brazil RV Appliances Revenue (million) Forecast, by Application 2019 & 2032
- Table 15: Argentina RV Appliances Revenue (million) Forecast, by Application 2019 & 2032
- Table 16: Rest of South America RV Appliances Revenue (million) Forecast, by Application 2019 & 2032
- Table 17: Global RV Appliances Revenue million Forecast, by Application 2019 & 2032
- Table 18: Global RV Appliances Revenue million Forecast, by Types 2019 & 2032
- Table 19: Global RV Appliances Revenue million Forecast, by Country 2019 & 2032
- Table 20: United Kingdom RV Appliances Revenue (million) Forecast, by Application 2019 & 2032
- Table 21: Germany RV Appliances Revenue (million) Forecast, by Application 2019 & 2032
- Table 22: France RV Appliances Revenue (million) Forecast, by Application 2019 & 2032
- Table 23: Italy RV Appliances Revenue (million) Forecast, by Application 2019 & 2032
- Table 24: Spain RV Appliances Revenue (million) Forecast, by Application 2019 & 2032
- Table 25: Russia RV Appliances Revenue (million) Forecast, by Application 2019 & 2032
- Table 26: Benelux RV Appliances Revenue (million) Forecast, by Application 2019 & 2032
- Table 27: Nordics RV Appliances Revenue (million) Forecast, by Application 2019 & 2032
- Table 28: Rest of Europe RV Appliances Revenue (million) Forecast, by Application 2019 & 2032
- Table 29: Global RV Appliances Revenue million Forecast, by Application 2019 & 2032
- Table 30: Global RV Appliances Revenue million Forecast, by Types 2019 & 2032
- Table 31: Global RV Appliances Revenue million Forecast, by Country 2019 & 2032
- Table 32: Turkey RV Appliances Revenue (million) Forecast, by Application 2019 & 2032
- Table 33: Israel RV Appliances Revenue (million) Forecast, by Application 2019 & 2032
- Table 34: GCC RV Appliances Revenue (million) Forecast, by Application 2019 & 2032
- Table 35: North Africa RV Appliances Revenue (million) Forecast, by Application 2019 & 2032
- Table 36: South Africa RV Appliances Revenue (million) Forecast, by Application 2019 & 2032
- Table 37: Rest of Middle East & Africa RV Appliances Revenue (million) Forecast, by Application 2019 & 2032
- Table 38: Global RV Appliances Revenue million Forecast, by Application 2019 & 2032
- Table 39: Global RV Appliances Revenue million Forecast, by Types 2019 & 2032
- Table 40: Global RV Appliances Revenue million Forecast, by Country 2019 & 2032
- Table 41: China RV Appliances Revenue (million) Forecast, by Application 2019 & 2032
- Table 42: India RV Appliances Revenue (million) Forecast, by Application 2019 & 2032
- Table 43: Japan RV Appliances Revenue (million) Forecast, by Application 2019 & 2032
- Table 44: South Korea RV Appliances Revenue (million) Forecast, by Application 2019 & 2032
- Table 45: ASEAN RV Appliances Revenue (million) Forecast, by Application 2019 & 2032
- Table 46: Oceania RV Appliances Revenue (million) Forecast, by Application 2019 & 2032
- Table 47: Rest of Asia Pacific RV Appliances Revenue (million) Forecast, by Application 2019 & 2032
Frequently Asked Questions
1. What is the projected Compound Annual Growth Rate (CAGR) of the RV Appliances?
The projected CAGR is approximately XX%.
2. Which companies are prominent players in the RV Appliances?
Key companies in the market include Airxcel, Dinosaur Electronics, Fogatti, Furrion, GE Appliances, Indel B, JR Products, Sawafuji, Shoreline, Suburban, Thetford, U-Line, Valterra, Veco SpA, Vitrifrigo, Westland.
3. What are the main segments of the RV Appliances?
The market segments include Application, Types.
4. Can you provide details about the market size?
The market size is estimated to be USD XXX million as of 2022.
5. What are some drivers contributing to market growth?
N/A
6. What are the notable trends driving market growth?
N/A
7. Are there any restraints impacting market growth?
N/A
8. Can you provide examples of recent developments in the market?
N/A
9. What pricing options are available for accessing the report?
Pricing options include single-user, multi-user, and enterprise licenses priced at USD 2900.00, USD 4350.00, and USD 5800.00 respectively.
10. Is the market size provided in terms of value or volume?
The market size is provided in terms of value, measured in million.
11. Are there any specific market keywords associated with the report?
Yes, the market keyword associated with the report is "RV Appliances," which aids in identifying and referencing the specific market segment covered.
12. How do I determine which pricing option suits my needs best?
The pricing options vary based on user requirements and access needs. Individual users may opt for single-user licenses, while businesses requiring broader access may choose multi-user or enterprise licenses for cost-effective access to the report.
13. Are there any additional resources or data provided in the RV Appliances report?
While the report offers comprehensive insights, it's advisable to review the specific contents or supplementary materials provided to ascertain if additional resources or data are available.
14. How can I stay updated on further developments or reports in the RV Appliances?
To stay informed about further developments, trends, and reports in the RV Appliances, consider subscribing to industry newsletters, following relevant companies and organizations, or regularly checking reputable industry news sources and publications.
Methodology
Step 1 - Identification of Relevant Samples Size from Population Database


Step 2 - Approaches for Defining Global Market Size (Value, Volume* & Price*)

Note*: In applicable scenarios
Step 3 - Data Sources
Primary Research
- Web Analytics
- Survey Reports
- Research Institute
- Latest Research Reports
- Opinion Leaders
Secondary Research
- Annual Reports
- White Paper
- Latest Press Release
- Industry Association
- Paid Database
- Investor Presentations

Step 4 - Data Triangulation
Involves using different sources of information in order to increase the validity of a study
These sources are likely to be stakeholders in a program - participants, other researchers, program staff, other community members, and so on.
Then we put all data in single framework & apply various statistical tools to find out the dynamic on the market.
During the analysis stage, feedback from the stakeholder groups would be compared to determine areas of agreement as well as areas of divergence


