
Key Insights
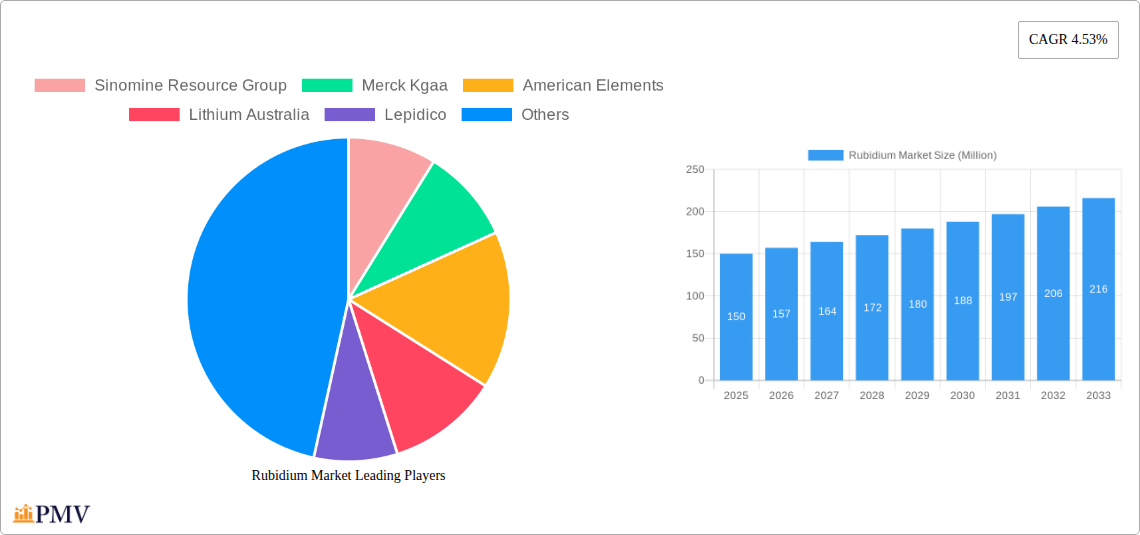
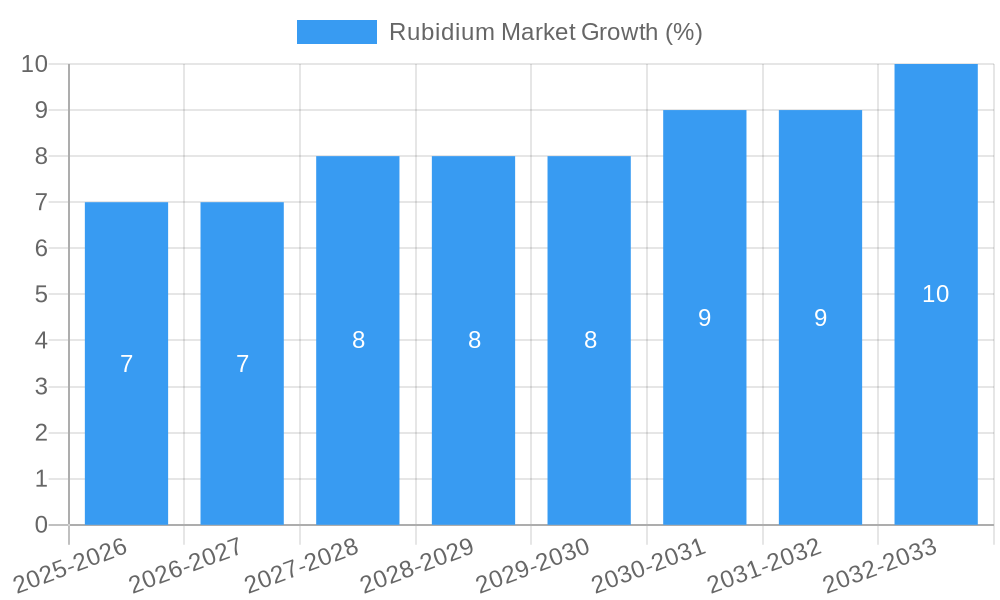
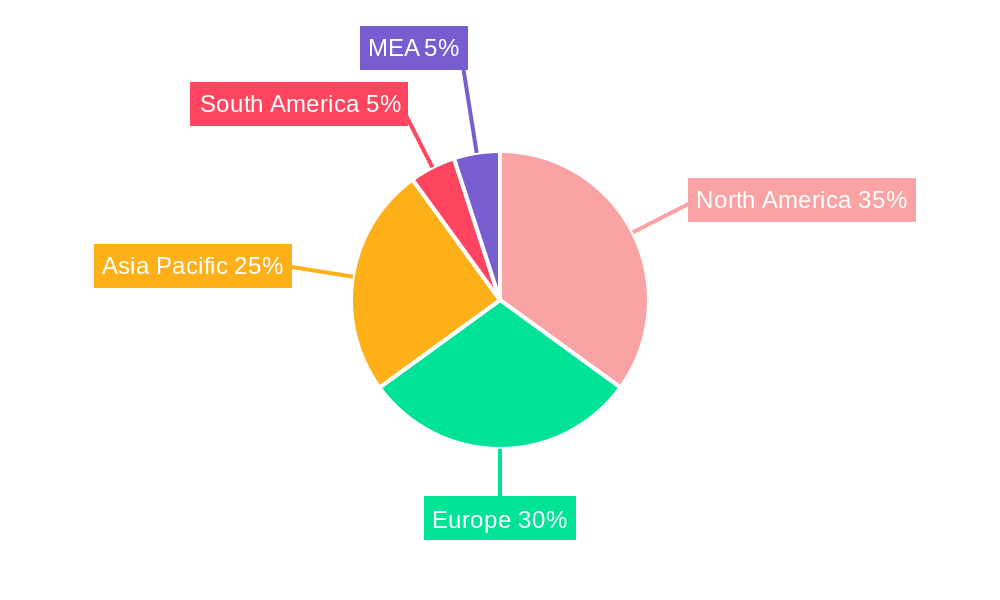
The rubidium market, valued at approximately $150 million in 2025, is projected to experience steady growth, driven by increasing demand from key application sectors. A compound annual growth rate (CAGR) of 4.53% is anticipated from 2025 to 2033, indicating a market size exceeding $230 million by the end of the forecast period. This growth is primarily fueled by the expanding biomedical research sector, leveraging rubidium's unique properties for medical imaging and diagnostics. The electronics industry also contributes significantly, with rubidium finding applications in specialized atomic clocks and other high-precision instruments. While the specialty glass and pyrotechnics sectors contribute to market demand, their growth rates are expected to be slightly lower than those of biomedical and electronics. The production of rubidium is dominated by the processing of lepidolite and pollucite ores, with other processes representing a smaller, albeit growing, segment. Geographic distribution shows a concentration of demand in North America and Europe initially, but the Asia-Pacific region is poised for significant growth as technological advancements and infrastructure developments create new opportunities. Competitive dynamics are shaped by key players like Sinomine Resource Group, Merck Kgaa, and Ganfeng Lithium, amongst others, who are actively involved in production, refinement, and distribution. While supply chain constraints and price volatility of raw materials could pose challenges, the overall outlook for the rubidium market remains positive, driven by continuous technological advancements and the diverse application landscape.
The major players are actively investing in research and development to improve production efficiency and explore new applications for rubidium. This, coupled with strategic partnerships and acquisitions, is expected to further consolidate the market and drive innovation. However, potential regulatory hurdles related to the use of rubidium in certain applications, and fluctuations in global economic conditions, could influence market growth in the coming years. Despite these factors, the inherent properties of rubidium and its increasing importance in high-tech sectors ensure a sustained demand, contributing to the market's anticipated positive trajectory. The market segmentation based on production processes and application sectors provides valuable insights into the specific drivers and growth opportunities within each segment, allowing for targeted strategies by market participants.
Rubidium Market: A Comprehensive Report (2019-2033)
This in-depth report provides a comprehensive analysis of the global rubidium market, offering invaluable insights for industry stakeholders, investors, and researchers. Covering the period from 2019 to 2033, with a base year of 2025 and a forecast period of 2025-2033, this report meticulously examines market structure, competitive dynamics, key segments, and future growth prospects. The report leverages robust data and expert analysis to offer actionable intelligence for informed decision-making in this dynamic market. The global rubidium market is estimated to reach xx Million by 2033.
Rubidium Market Structure & Competitive Dynamics
The rubidium market exhibits a moderately concentrated structure, with a few major players holding significant market share. Key players like Sinomine Resource Group, Merck Kgaa, American Elements, Lithium Australia, Lepidico, Ganfeng Lithium, Thermo Fisher Scientific, Jiangxi Special Electric Motor, and International Lithium Corp. dominate the landscape, although the level of concentration varies across different segments and geographic regions. Innovation ecosystems are currently developing, largely driven by advancements in extraction technologies and applications. Regulatory frameworks, while varying across countries, generally focus on responsible sourcing and environmental impact. Product substitutes are limited due to rubidium's unique properties. M&A activity, as evidenced by recent acquisitions like International Lithium Corp.'s expansion of its Raleigh Lake project, indicates a growing interest in securing rubidium resources and consolidating market position. Market share is expected to shift slightly in the forecast period, with projected M&A deal values reaching approximately xx Million by 2033.
- Market Concentration: Moderately concentrated, with significant regional variations.
- Innovation Ecosystems: Emerging, driven by technological advancements in extraction and application.
- Regulatory Frameworks: Vary by region, emphasizing sustainable practices and environmental compliance.
- Product Substitutes: Limited due to rubidium's unique chemical properties.
- End-User Trends: Increasing demand driven by technological advancements in electronics and biomedical research.
- M&A Activity: Growing interest in securing resources and consolidating market share.
Rubidium Market Industry Trends & Insights
The rubidium market is experiencing robust growth, driven primarily by the increasing demand from the electronics and biomedical research sectors. Technological advancements in extraction and purification techniques are also contributing to market expansion. Consumer preferences are increasingly aligned with sustainable and ethically sourced materials, impacting supply chain management. Competitive dynamics are marked by ongoing innovation, strategic partnerships, and M&A activity. The Compound Annual Growth Rate (CAGR) is projected at xx% from 2025 to 2033, with market penetration expected to increase significantly in developing economies. This growth is further fueled by the rising adoption of rubidium in specialty glass manufacturing and pyrotechnics. The increasing demand for high-purity rubidium for specialized applications is driving the development of advanced purification technologies. The market is also influenced by fluctuations in raw material prices and global economic conditions.
Dominant Markets & Segments in Rubidium Market
The electronics sector is the dominant application segment for rubidium, driven by its use in atomic clocks and other precision instruments. Within production processes, lepidolite remains a significant source, although advancements in pollucite processing are gaining traction. Geographically, [insert dominant region/country – e.g., China or North America] holds a leading position, fueled by robust industrial activity and resource availability.
- Leading Application Sector: Electronics (driven by high-precision instruments and atomic clocks)
- Leading Production Process: Lepidolite (currently dominant, with Pollucite gaining market share).
- Key Drivers in Dominant Region/Country: (Provide examples specific to the region/country selected above, focusing on economic policies, robust industrial activity, and resource availability).
Detailed Dominance Analysis: [Insert a detailed paragraph explaining the reasons behind the dominance of the chosen region, application sector, and production process. Include factors like resource availability, manufacturing capabilities, technological advancements, government policies, and market demand.]
Rubidium Market Product Innovations
Recent innovations focus on enhancing rubidium extraction efficiency from lepidolite and pollucite ores. New purification methods are being developed to achieve higher purity levels needed for advanced applications. These advancements are leading to improved cost-effectiveness and expanded market reach. The development of novel applications in fields such as energy storage and medical imaging is also driving product innovation within the rubidium market.
Report Segmentation & Scope
This report segments the rubidium market based on Production Process (Lepidolite, Pollucite, Other Production Processes) and Application Sector (Biomedical Research, Electronics, Specialty Glass, Pyrotechnics, Other Application Sectors). Each segment's growth projections, market sizes, and competitive dynamics are thoroughly analyzed. The report presents detailed market sizing and forecasts for each segment over the forecast period (2025-2033).
Production Process Segmentation: This section details the market share and growth projections for each production method, along with an analysis of the advantages and disadvantages of each.
Application Sector Segmentation: This section provides a breakdown of market size and growth forecasts for each application area, discussing the factors driving demand in each sector.
Key Drivers of Rubidium Market Growth
The rubidium market's growth is propelled by several key factors: the rising demand for high-precision instruments in electronics, expanding biomedical research applications, and the increasing use of rubidium in specialty glass and pyrotechnics. Government initiatives promoting technological advancements further stimulate market growth. Additionally, the exploration of new rubidium resources and improved extraction techniques are contributing to market expansion.
Challenges in the Rubidium Market Sector
The rubidium market faces several challenges, including the relatively low abundance of rubidium in nature, potentially limiting supply. Fluctuations in raw material prices and the complexity of extraction and purification processes can also impact market stability. Furthermore, ensuring sustainable and ethical sourcing practices poses a significant challenge for market players. The geopolitical landscape and potential trade restrictions may also affect the supply chain. These factors can affect the overall market growth and profitability.
Leading Players in the Rubidium Market Market
- Sinomine Resource Group
- Merck Kgaa (Merck Kgaa)
- American Elements (American Elements)
- Lithium Australia
- Lepidico
- Ganfeng Lithium
- Thermo Fisher Scientific (Thermo Fisher Scientific)
- Jiangxi Special Electric Motor
- International Lithium Corp
Key Developments in Rubidium Market Sector
- August 2021: International Lithium Corp. expanded its Raleigh Lake lithium and rubidium project in Ontario, Canada, significantly increasing its resource base. This acquisition indicates growing interest in securing rubidium resources.
- December 2022: Aldoro Resources secured rubidium and lithium prospective tenements near Mt Magnet, Western Australia, signifying potential for new rubidium production capacity.
Strategic Rubidium Market Outlook
The rubidium market is poised for continued growth, driven by technological advancements, expanding applications, and increasing investments in exploration and extraction. Strategic opportunities exist for companies focusing on sustainable sourcing, innovative extraction technologies, and the development of high-purity rubidium products. The market is expected to witness further consolidation and strategic partnerships, shaping a competitive yet promising future.
Rubidium Market Segmentation
-
1. Production Process
- 1.1. Lepidolite
- 1.2. Pollucite
- 1.3. Other Production Processes
-
2. Application Sector
- 2.1. Biomedical Research
- 2.2. Electronics
- 2.3. Specialty Glass
- 2.4. Pyrotechnics
- 2.5. Other Application Sectors
Rubidium Market Segmentation By Geography
- 1. Asia Pacific
- 2. North America
- 3. Europe
- 4. Rest of the World
Rubidium Market REPORT HIGHLIGHTS
| Aspects | Details |
|---|---|
| Study Period | 2019-2033 |
| Base Year | 2024 |
| Estimated Year | 2025 |
| Forecast Period | 2025-2033 |
| Historical Period | 2019-2024 |
| Growth Rate | CAGR of 4.53% from 2019-2033 |
| Segmentation |
|
Table of Contents
- 1. Introduction
- 1.1. Research Scope
- 1.2. Market Segmentation
- 1.3. Research Methodology
- 1.4. Definitions and Assumptions
- 2. Executive Summary
- 2.1. Introduction
- 3. Market Dynamics
- 3.1. Introduction
- 3.2. Market Drivers
- 3.2.1. Growing Biomedical Applications; Applications in Specialty Glass
- 3.3. Market Restrains
- 3.3.1. Availability and High Cost of Rubidium; Transportation and Storage-Related Safety Difficulties
- 3.4. Market Trends
- 3.4.1. Specialty Glass to Dominate the Market
- 4. Market Factor Analysis
- 4.1. Porters Five Forces
- 4.2. Supply/Value Chain
- 4.3. PESTEL analysis
- 4.4. Market Entropy
- 4.5. Patent/Trademark Analysis
- 5. Global Rubidium Market Analysis, Insights and Forecast, 2019-2031
- 5.1. Market Analysis, Insights and Forecast - by Production Process
- 5.1.1. Lepidolite
- 5.1.2. Pollucite
- 5.1.3. Other Production Processes
- 5.2. Market Analysis, Insights and Forecast - by Application Sector
- 5.2.1. Biomedical Research
- 5.2.2. Electronics
- 5.2.3. Specialty Glass
- 5.2.4. Pyrotechnics
- 5.2.5. Other Application Sectors
- 5.3. Market Analysis, Insights and Forecast - by Region
- 5.3.1. Asia Pacific
- 5.3.2. North America
- 5.3.3. Europe
- 5.3.4. Rest of the World
- 5.1. Market Analysis, Insights and Forecast - by Production Process
- 6. Asia Pacific Rubidium Market Analysis, Insights and Forecast, 2019-2031
- 6.1. Market Analysis, Insights and Forecast - by Production Process
- 6.1.1. Lepidolite
- 6.1.2. Pollucite
- 6.1.3. Other Production Processes
- 6.2. Market Analysis, Insights and Forecast - by Application Sector
- 6.2.1. Biomedical Research
- 6.2.2. Electronics
- 6.2.3. Specialty Glass
- 6.2.4. Pyrotechnics
- 6.2.5. Other Application Sectors
- 6.1. Market Analysis, Insights and Forecast - by Production Process
- 7. North America Rubidium Market Analysis, Insights and Forecast, 2019-2031
- 7.1. Market Analysis, Insights and Forecast - by Production Process
- 7.1.1. Lepidolite
- 7.1.2. Pollucite
- 7.1.3. Other Production Processes
- 7.2. Market Analysis, Insights and Forecast - by Application Sector
- 7.2.1. Biomedical Research
- 7.2.2. Electronics
- 7.2.3. Specialty Glass
- 7.2.4. Pyrotechnics
- 7.2.5. Other Application Sectors
- 7.1. Market Analysis, Insights and Forecast - by Production Process
- 8. Europe Rubidium Market Analysis, Insights and Forecast, 2019-2031
- 8.1. Market Analysis, Insights and Forecast - by Production Process
- 8.1.1. Lepidolite
- 8.1.2. Pollucite
- 8.1.3. Other Production Processes
- 8.2. Market Analysis, Insights and Forecast - by Application Sector
- 8.2.1. Biomedical Research
- 8.2.2. Electronics
- 8.2.3. Specialty Glass
- 8.2.4. Pyrotechnics
- 8.2.5. Other Application Sectors
- 8.1. Market Analysis, Insights and Forecast - by Production Process
- 9. Rest of the World Rubidium Market Analysis, Insights and Forecast, 2019-2031
- 9.1. Market Analysis, Insights and Forecast - by Production Process
- 9.1.1. Lepidolite
- 9.1.2. Pollucite
- 9.1.3. Other Production Processes
- 9.2. Market Analysis, Insights and Forecast - by Application Sector
- 9.2.1. Biomedical Research
- 9.2.2. Electronics
- 9.2.3. Specialty Glass
- 9.2.4. Pyrotechnics
- 9.2.5. Other Application Sectors
- 9.1. Market Analysis, Insights and Forecast - by Production Process
- 10. North America Rubidium Market Analysis, Insights and Forecast, 2019-2031
- 10.1. Market Analysis, Insights and Forecast - By Country/Sub-region
- 10.1.1 United States
- 10.1.2 Canada
- 10.1.3 Mexico
- 11. Europe Rubidium Market Analysis, Insights and Forecast, 2019-2031
- 11.1. Market Analysis, Insights and Forecast - By Country/Sub-region
- 11.1.1 Germany
- 11.1.2 France
- 11.1.3 Italy
- 11.1.4 United Kingdom
- 11.1.5 Netherlands
- 11.1.6 Rest of Europe
- 12. Asia Pacific Rubidium Market Analysis, Insights and Forecast, 2019-2031
- 12.1. Market Analysis, Insights and Forecast - By Country/Sub-region
- 12.1.1 China
- 12.1.2 Japan
- 12.1.3 India
- 12.1.4 South Korea
- 12.1.5 Taiwan
- 12.1.6 Australia
- 12.1.7 Rest of Asia-Pacific
- 13. South America Rubidium Market Analysis, Insights and Forecast, 2019-2031
- 13.1. Market Analysis, Insights and Forecast - By Country/Sub-region
- 13.1.1 Brazil
- 13.1.2 Argentina
- 13.1.3 Rest of South America
- 14. MEA Rubidium Market Analysis, Insights and Forecast, 2019-2031
- 14.1. Market Analysis, Insights and Forecast - By Country/Sub-region
- 14.1.1 Middle East
- 14.1.2 Africa
- 15. Competitive Analysis
- 15.1. Global Market Share Analysis 2024
- 15.2. Company Profiles
- 15.2.1 Sinomine Resource Group
- 15.2.1.1. Overview
- 15.2.1.2. Products
- 15.2.1.3. SWOT Analysis
- 15.2.1.4. Recent Developments
- 15.2.1.5. Financials (Based on Availability)
- 15.2.2 Merck Kgaa
- 15.2.2.1. Overview
- 15.2.2.2. Products
- 15.2.2.3. SWOT Analysis
- 15.2.2.4. Recent Developments
- 15.2.2.5. Financials (Based on Availability)
- 15.2.3 American Elements
- 15.2.3.1. Overview
- 15.2.3.2. Products
- 15.2.3.3. SWOT Analysis
- 15.2.3.4. Recent Developments
- 15.2.3.5. Financials (Based on Availability)
- 15.2.4 Lithium Australia
- 15.2.4.1. Overview
- 15.2.4.2. Products
- 15.2.4.3. SWOT Analysis
- 15.2.4.4. Recent Developments
- 15.2.4.5. Financials (Based on Availability)
- 15.2.5 Lepidico
- 15.2.5.1. Overview
- 15.2.5.2. Products
- 15.2.5.3. SWOT Analysis
- 15.2.5.4. Recent Developments
- 15.2.5.5. Financials (Based on Availability)
- 15.2.6 Ganfeng Lithium
- 15.2.6.1. Overview
- 15.2.6.2. Products
- 15.2.6.3. SWOT Analysis
- 15.2.6.4. Recent Developments
- 15.2.6.5. Financials (Based on Availability)
- 15.2.7 Thermo Fisher Scientific
- 15.2.7.1. Overview
- 15.2.7.2. Products
- 15.2.7.3. SWOT Analysis
- 15.2.7.4. Recent Developments
- 15.2.7.5. Financials (Based on Availability)
- 15.2.8 Jiangxi Special Electric Motor
- 15.2.8.1. Overview
- 15.2.8.2. Products
- 15.2.8.3. SWOT Analysis
- 15.2.8.4. Recent Developments
- 15.2.8.5. Financials (Based on Availability)
- 15.2.9 International Lithium Corp
- 15.2.9.1. Overview
- 15.2.9.2. Products
- 15.2.9.3. SWOT Analysis
- 15.2.9.4. Recent Developments
- 15.2.9.5. Financials (Based on Availability)
- 15.2.1 Sinomine Resource Group
List of Figures
- Figure 1: Global Rubidium Market Revenue Breakdown (Million, %) by Region 2024 & 2032
- Figure 2: Global Rubidium Market Volume Breakdown (K Tons, %) by Region 2024 & 2032
- Figure 3: North America Rubidium Market Revenue (Million), by Country 2024 & 2032
- Figure 4: North America Rubidium Market Volume (K Tons), by Country 2024 & 2032
- Figure 5: North America Rubidium Market Revenue Share (%), by Country 2024 & 2032
- Figure 6: North America Rubidium Market Volume Share (%), by Country 2024 & 2032
- Figure 7: Europe Rubidium Market Revenue (Million), by Country 2024 & 2032
- Figure 8: Europe Rubidium Market Volume (K Tons), by Country 2024 & 2032
- Figure 9: Europe Rubidium Market Revenue Share (%), by Country 2024 & 2032
- Figure 10: Europe Rubidium Market Volume Share (%), by Country 2024 & 2032
- Figure 11: Asia Pacific Rubidium Market Revenue (Million), by Country 2024 & 2032
- Figure 12: Asia Pacific Rubidium Market Volume (K Tons), by Country 2024 & 2032
- Figure 13: Asia Pacific Rubidium Market Revenue Share (%), by Country 2024 & 2032
- Figure 14: Asia Pacific Rubidium Market Volume Share (%), by Country 2024 & 2032
- Figure 15: South America Rubidium Market Revenue (Million), by Country 2024 & 2032
- Figure 16: South America Rubidium Market Volume (K Tons), by Country 2024 & 2032
- Figure 17: South America Rubidium Market Revenue Share (%), by Country 2024 & 2032
- Figure 18: South America Rubidium Market Volume Share (%), by Country 2024 & 2032
- Figure 19: MEA Rubidium Market Revenue (Million), by Country 2024 & 2032
- Figure 20: MEA Rubidium Market Volume (K Tons), by Country 2024 & 2032
- Figure 21: MEA Rubidium Market Revenue Share (%), by Country 2024 & 2032
- Figure 22: MEA Rubidium Market Volume Share (%), by Country 2024 & 2032
- Figure 23: Asia Pacific Rubidium Market Revenue (Million), by Production Process 2024 & 2032
- Figure 24: Asia Pacific Rubidium Market Volume (K Tons), by Production Process 2024 & 2032
- Figure 25: Asia Pacific Rubidium Market Revenue Share (%), by Production Process 2024 & 2032
- Figure 26: Asia Pacific Rubidium Market Volume Share (%), by Production Process 2024 & 2032
- Figure 27: Asia Pacific Rubidium Market Revenue (Million), by Application Sector 2024 & 2032
- Figure 28: Asia Pacific Rubidium Market Volume (K Tons), by Application Sector 2024 & 2032
- Figure 29: Asia Pacific Rubidium Market Revenue Share (%), by Application Sector 2024 & 2032
- Figure 30: Asia Pacific Rubidium Market Volume Share (%), by Application Sector 2024 & 2032
- Figure 31: Asia Pacific Rubidium Market Revenue (Million), by Country 2024 & 2032
- Figure 32: Asia Pacific Rubidium Market Volume (K Tons), by Country 2024 & 2032
- Figure 33: Asia Pacific Rubidium Market Revenue Share (%), by Country 2024 & 2032
- Figure 34: Asia Pacific Rubidium Market Volume Share (%), by Country 2024 & 2032
- Figure 35: North America Rubidium Market Revenue (Million), by Production Process 2024 & 2032
- Figure 36: North America Rubidium Market Volume (K Tons), by Production Process 2024 & 2032
- Figure 37: North America Rubidium Market Revenue Share (%), by Production Process 2024 & 2032
- Figure 38: North America Rubidium Market Volume Share (%), by Production Process 2024 & 2032
- Figure 39: North America Rubidium Market Revenue (Million), by Application Sector 2024 & 2032
- Figure 40: North America Rubidium Market Volume (K Tons), by Application Sector 2024 & 2032
- Figure 41: North America Rubidium Market Revenue Share (%), by Application Sector 2024 & 2032
- Figure 42: North America Rubidium Market Volume Share (%), by Application Sector 2024 & 2032
- Figure 43: North America Rubidium Market Revenue (Million), by Country 2024 & 2032
- Figure 44: North America Rubidium Market Volume (K Tons), by Country 2024 & 2032
- Figure 45: North America Rubidium Market Revenue Share (%), by Country 2024 & 2032
- Figure 46: North America Rubidium Market Volume Share (%), by Country 2024 & 2032
- Figure 47: Europe Rubidium Market Revenue (Million), by Production Process 2024 & 2032
- Figure 48: Europe Rubidium Market Volume (K Tons), by Production Process 2024 & 2032
- Figure 49: Europe Rubidium Market Revenue Share (%), by Production Process 2024 & 2032
- Figure 50: Europe Rubidium Market Volume Share (%), by Production Process 2024 & 2032
- Figure 51: Europe Rubidium Market Revenue (Million), by Application Sector 2024 & 2032
- Figure 52: Europe Rubidium Market Volume (K Tons), by Application Sector 2024 & 2032
- Figure 53: Europe Rubidium Market Revenue Share (%), by Application Sector 2024 & 2032
- Figure 54: Europe Rubidium Market Volume Share (%), by Application Sector 2024 & 2032
- Figure 55: Europe Rubidium Market Revenue (Million), by Country 2024 & 2032
- Figure 56: Europe Rubidium Market Volume (K Tons), by Country 2024 & 2032
- Figure 57: Europe Rubidium Market Revenue Share (%), by Country 2024 & 2032
- Figure 58: Europe Rubidium Market Volume Share (%), by Country 2024 & 2032
- Figure 59: Rest of the World Rubidium Market Revenue (Million), by Production Process 2024 & 2032
- Figure 60: Rest of the World Rubidium Market Volume (K Tons), by Production Process 2024 & 2032
- Figure 61: Rest of the World Rubidium Market Revenue Share (%), by Production Process 2024 & 2032
- Figure 62: Rest of the World Rubidium Market Volume Share (%), by Production Process 2024 & 2032
- Figure 63: Rest of the World Rubidium Market Revenue (Million), by Application Sector 2024 & 2032
- Figure 64: Rest of the World Rubidium Market Volume (K Tons), by Application Sector 2024 & 2032
- Figure 65: Rest of the World Rubidium Market Revenue Share (%), by Application Sector 2024 & 2032
- Figure 66: Rest of the World Rubidium Market Volume Share (%), by Application Sector 2024 & 2032
- Figure 67: Rest of the World Rubidium Market Revenue (Million), by Country 2024 & 2032
- Figure 68: Rest of the World Rubidium Market Volume (K Tons), by Country 2024 & 2032
- Figure 69: Rest of the World Rubidium Market Revenue Share (%), by Country 2024 & 2032
- Figure 70: Rest of the World Rubidium Market Volume Share (%), by Country 2024 & 2032
List of Tables
- Table 1: Global Rubidium Market Revenue Million Forecast, by Region 2019 & 2032
- Table 2: Global Rubidium Market Volume K Tons Forecast, by Region 2019 & 2032
- Table 3: Global Rubidium Market Revenue Million Forecast, by Production Process 2019 & 2032
- Table 4: Global Rubidium Market Volume K Tons Forecast, by Production Process 2019 & 2032
- Table 5: Global Rubidium Market Revenue Million Forecast, by Application Sector 2019 & 2032
- Table 6: Global Rubidium Market Volume K Tons Forecast, by Application Sector 2019 & 2032
- Table 7: Global Rubidium Market Revenue Million Forecast, by Region 2019 & 2032
- Table 8: Global Rubidium Market Volume K Tons Forecast, by Region 2019 & 2032
- Table 9: Global Rubidium Market Revenue Million Forecast, by Country 2019 & 2032
- Table 10: Global Rubidium Market Volume K Tons Forecast, by Country 2019 & 2032
- Table 11: United States Rubidium Market Revenue (Million) Forecast, by Application 2019 & 2032
- Table 12: United States Rubidium Market Volume (K Tons) Forecast, by Application 2019 & 2032
- Table 13: Canada Rubidium Market Revenue (Million) Forecast, by Application 2019 & 2032
- Table 14: Canada Rubidium Market Volume (K Tons) Forecast, by Application 2019 & 2032
- Table 15: Mexico Rubidium Market Revenue (Million) Forecast, by Application 2019 & 2032
- Table 16: Mexico Rubidium Market Volume (K Tons) Forecast, by Application 2019 & 2032
- Table 17: Global Rubidium Market Revenue Million Forecast, by Country 2019 & 2032
- Table 18: Global Rubidium Market Volume K Tons Forecast, by Country 2019 & 2032
- Table 19: Germany Rubidium Market Revenue (Million) Forecast, by Application 2019 & 2032
- Table 20: Germany Rubidium Market Volume (K Tons) Forecast, by Application 2019 & 2032
- Table 21: France Rubidium Market Revenue (Million) Forecast, by Application 2019 & 2032
- Table 22: France Rubidium Market Volume (K Tons) Forecast, by Application 2019 & 2032
- Table 23: Italy Rubidium Market Revenue (Million) Forecast, by Application 2019 & 2032
- Table 24: Italy Rubidium Market Volume (K Tons) Forecast, by Application 2019 & 2032
- Table 25: United Kingdom Rubidium Market Revenue (Million) Forecast, by Application 2019 & 2032
- Table 26: United Kingdom Rubidium Market Volume (K Tons) Forecast, by Application 2019 & 2032
- Table 27: Netherlands Rubidium Market Revenue (Million) Forecast, by Application 2019 & 2032
- Table 28: Netherlands Rubidium Market Volume (K Tons) Forecast, by Application 2019 & 2032
- Table 29: Rest of Europe Rubidium Market Revenue (Million) Forecast, by Application 2019 & 2032
- Table 30: Rest of Europe Rubidium Market Volume (K Tons) Forecast, by Application 2019 & 2032
- Table 31: Global Rubidium Market Revenue Million Forecast, by Country 2019 & 2032
- Table 32: Global Rubidium Market Volume K Tons Forecast, by Country 2019 & 2032
- Table 33: China Rubidium Market Revenue (Million) Forecast, by Application 2019 & 2032
- Table 34: China Rubidium Market Volume (K Tons) Forecast, by Application 2019 & 2032
- Table 35: Japan Rubidium Market Revenue (Million) Forecast, by Application 2019 & 2032
- Table 36: Japan Rubidium Market Volume (K Tons) Forecast, by Application 2019 & 2032
- Table 37: India Rubidium Market Revenue (Million) Forecast, by Application 2019 & 2032
- Table 38: India Rubidium Market Volume (K Tons) Forecast, by Application 2019 & 2032
- Table 39: South Korea Rubidium Market Revenue (Million) Forecast, by Application 2019 & 2032
- Table 40: South Korea Rubidium Market Volume (K Tons) Forecast, by Application 2019 & 2032
- Table 41: Taiwan Rubidium Market Revenue (Million) Forecast, by Application 2019 & 2032
- Table 42: Taiwan Rubidium Market Volume (K Tons) Forecast, by Application 2019 & 2032
- Table 43: Australia Rubidium Market Revenue (Million) Forecast, by Application 2019 & 2032
- Table 44: Australia Rubidium Market Volume (K Tons) Forecast, by Application 2019 & 2032
- Table 45: Rest of Asia-Pacific Rubidium Market Revenue (Million) Forecast, by Application 2019 & 2032
- Table 46: Rest of Asia-Pacific Rubidium Market Volume (K Tons) Forecast, by Application 2019 & 2032
- Table 47: Global Rubidium Market Revenue Million Forecast, by Country 2019 & 2032
- Table 48: Global Rubidium Market Volume K Tons Forecast, by Country 2019 & 2032
- Table 49: Brazil Rubidium Market Revenue (Million) Forecast, by Application 2019 & 2032
- Table 50: Brazil Rubidium Market Volume (K Tons) Forecast, by Application 2019 & 2032
- Table 51: Argentina Rubidium Market Revenue (Million) Forecast, by Application 2019 & 2032
- Table 52: Argentina Rubidium Market Volume (K Tons) Forecast, by Application 2019 & 2032
- Table 53: Rest of South America Rubidium Market Revenue (Million) Forecast, by Application 2019 & 2032
- Table 54: Rest of South America Rubidium Market Volume (K Tons) Forecast, by Application 2019 & 2032
- Table 55: Global Rubidium Market Revenue Million Forecast, by Country 2019 & 2032
- Table 56: Global Rubidium Market Volume K Tons Forecast, by Country 2019 & 2032
- Table 57: Middle East Rubidium Market Revenue (Million) Forecast, by Application 2019 & 2032
- Table 58: Middle East Rubidium Market Volume (K Tons) Forecast, by Application 2019 & 2032
- Table 59: Africa Rubidium Market Revenue (Million) Forecast, by Application 2019 & 2032
- Table 60: Africa Rubidium Market Volume (K Tons) Forecast, by Application 2019 & 2032
- Table 61: Global Rubidium Market Revenue Million Forecast, by Production Process 2019 & 2032
- Table 62: Global Rubidium Market Volume K Tons Forecast, by Production Process 2019 & 2032
- Table 63: Global Rubidium Market Revenue Million Forecast, by Application Sector 2019 & 2032
- Table 64: Global Rubidium Market Volume K Tons Forecast, by Application Sector 2019 & 2032
- Table 65: Global Rubidium Market Revenue Million Forecast, by Country 2019 & 2032
- Table 66: Global Rubidium Market Volume K Tons Forecast, by Country 2019 & 2032
- Table 67: Global Rubidium Market Revenue Million Forecast, by Production Process 2019 & 2032
- Table 68: Global Rubidium Market Volume K Tons Forecast, by Production Process 2019 & 2032
- Table 69: Global Rubidium Market Revenue Million Forecast, by Application Sector 2019 & 2032
- Table 70: Global Rubidium Market Volume K Tons Forecast, by Application Sector 2019 & 2032
- Table 71: Global Rubidium Market Revenue Million Forecast, by Country 2019 & 2032
- Table 72: Global Rubidium Market Volume K Tons Forecast, by Country 2019 & 2032
- Table 73: Global Rubidium Market Revenue Million Forecast, by Production Process 2019 & 2032
- Table 74: Global Rubidium Market Volume K Tons Forecast, by Production Process 2019 & 2032
- Table 75: Global Rubidium Market Revenue Million Forecast, by Application Sector 2019 & 2032
- Table 76: Global Rubidium Market Volume K Tons Forecast, by Application Sector 2019 & 2032
- Table 77: Global Rubidium Market Revenue Million Forecast, by Country 2019 & 2032
- Table 78: Global Rubidium Market Volume K Tons Forecast, by Country 2019 & 2032
- Table 79: Global Rubidium Market Revenue Million Forecast, by Production Process 2019 & 2032
- Table 80: Global Rubidium Market Volume K Tons Forecast, by Production Process 2019 & 2032
- Table 81: Global Rubidium Market Revenue Million Forecast, by Application Sector 2019 & 2032
- Table 82: Global Rubidium Market Volume K Tons Forecast, by Application Sector 2019 & 2032
- Table 83: Global Rubidium Market Revenue Million Forecast, by Country 2019 & 2032
- Table 84: Global Rubidium Market Volume K Tons Forecast, by Country 2019 & 2032
Frequently Asked Questions
1. What is the projected Compound Annual Growth Rate (CAGR) of the Rubidium Market?
The projected CAGR is approximately 4.53%.
2. Which companies are prominent players in the Rubidium Market?
Key companies in the market include Sinomine Resource Group, Merck Kgaa, American Elements, Lithium Australia, Lepidico, Ganfeng Lithium, Thermo Fisher Scientific, Jiangxi Special Electric Motor, International Lithium Corp.
3. What are the main segments of the Rubidium Market?
The market segments include Production Process, Application Sector.
4. Can you provide details about the market size?
The market size is estimated to be USD XX Million as of 2022.
5. What are some drivers contributing to market growth?
Growing Biomedical Applications; Applications in Specialty Glass.
6. What are the notable trends driving market growth?
Specialty Glass to Dominate the Market.
7. Are there any restraints impacting market growth?
Availability and High Cost of Rubidium; Transportation and Storage-Related Safety Difficulties.
8. Can you provide examples of recent developments in the market?
December 2022: Aldoro Resources granted rubidium and lithium prospective tenement near Mt Magnet in Western Australia.
9. What pricing options are available for accessing the report?
Pricing options include single-user, multi-user, and enterprise licenses priced at USD 4750, USD 5250, and USD 8750 respectively.
10. Is the market size provided in terms of value or volume?
The market size is provided in terms of value, measured in Million and volume, measured in K Tons.
11. Are there any specific market keywords associated with the report?
Yes, the market keyword associated with the report is "Rubidium Market," which aids in identifying and referencing the specific market segment covered.
12. How do I determine which pricing option suits my needs best?
The pricing options vary based on user requirements and access needs. Individual users may opt for single-user licenses, while businesses requiring broader access may choose multi-user or enterprise licenses for cost-effective access to the report.
13. Are there any additional resources or data provided in the Rubidium Market report?
While the report offers comprehensive insights, it's advisable to review the specific contents or supplementary materials provided to ascertain if additional resources or data are available.
14. How can I stay updated on further developments or reports in the Rubidium Market?
To stay informed about further developments, trends, and reports in the Rubidium Market, consider subscribing to industry newsletters, following relevant companies and organizations, or regularly checking reputable industry news sources and publications.
Methodology
Step 1 - Identification of Relevant Samples Size from Population Database


Step 2 - Approaches for Defining Global Market Size (Value, Volume* & Price*)

Note*: In applicable scenarios
Step 3 - Data Sources
Primary Research
- Web Analytics
- Survey Reports
- Research Institute
- Latest Research Reports
- Opinion Leaders
Secondary Research
- Annual Reports
- White Paper
- Latest Press Release
- Industry Association
- Paid Database
- Investor Presentations

Step 4 - Data Triangulation
Involves using different sources of information in order to increase the validity of a study
These sources are likely to be stakeholders in a program - participants, other researchers, program staff, other community members, and so on.
Then we put all data in single framework & apply various statistical tools to find out the dynamic on the market.
During the analysis stage, feedback from the stakeholder groups would be compared to determine areas of agreement as well as areas of divergence


