Key Insights
The Ready-to-Drink (RTD) coffee market is experiencing robust expansion, driven by escalating consumer demand for convenient, on-the-go beverage solutions. Key growth drivers include coffee's growing prominence as a daily beverage, a rising preference for premium and specialty RTD coffee, and increased adoption of healthier, functional beverage options. Consumers are seeking convenient alternatives to home brewing, with RTD coffee offering a quick and accessible solution, particularly appealing to younger demographics and busy professionals. Product innovation, including cold brew, nitrogen-infused coffee, and functional ingredient additions (vitamins, adaptogens), is expanding market appeal and catering to evolving consumer tastes. Leading companies such as Nestlé, Coca-Cola, and Danone are significantly investing in this sector, accelerating growth through strategic marketing, partnerships, and product diversification. While pricing pressures and raw material cost fluctuations pose challenges, the market exhibits a positive trajectory, projecting a compound annual growth rate (CAGR) of 7.2%. The current market size stands at $26.2 billion as of the base year 2024, with projections indicating substantial future value increases.
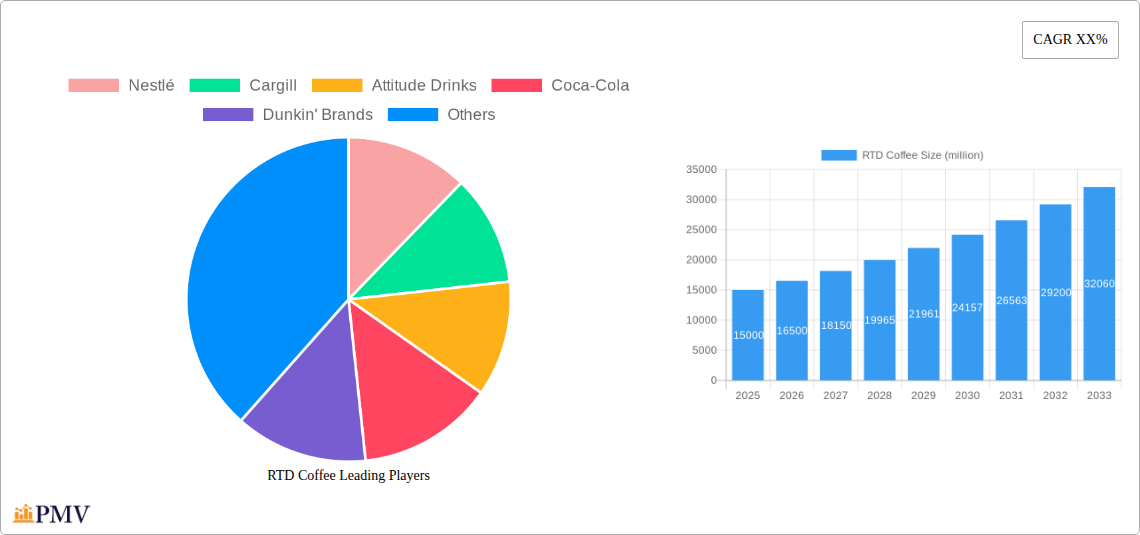
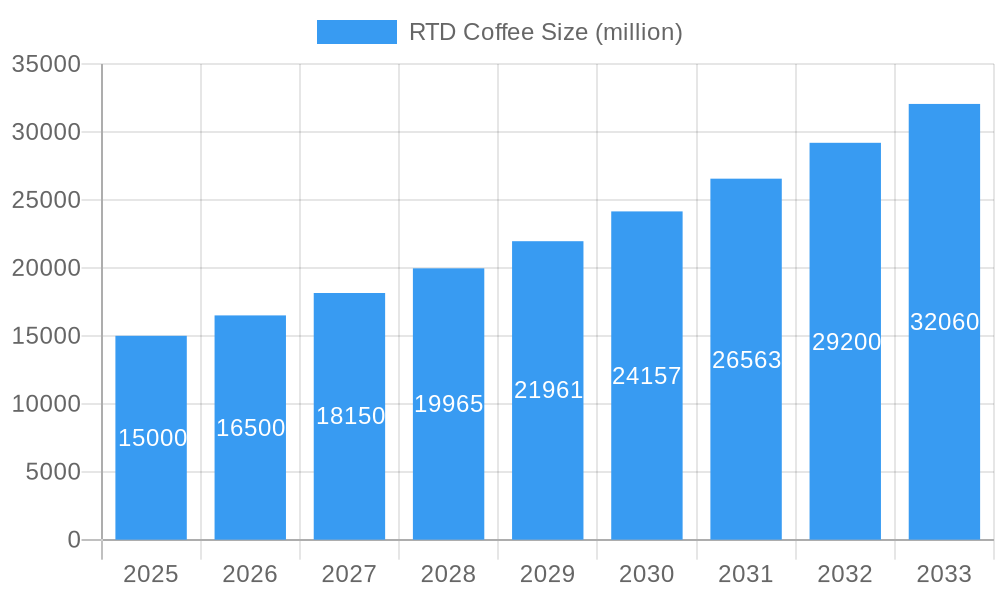
RTD Coffee Market Size (In Billion)
Despite a positive outlook, the RTD coffee market faces considerable competition from established and emerging brands. Maintaining consistent product quality and efficient supply chain management are critical for sustained success. Environmental concerns regarding packaging are driving a focus on sustainable solutions. Shifting consumer preferences and emerging beverage trends could also influence market dynamics. However, ongoing innovation, strategic acquisitions, and targeted marketing by key players position the RTD coffee market for continued growth and increased market value in the coming years.
RTD Coffee Company Market Share
Ready-to-Drink (RTD) Coffee Market Report: 2019-2033
This comprehensive report provides an in-depth analysis of the global Ready-to-Drink (RTD) Coffee market, offering invaluable insights for industry stakeholders, investors, and strategic decision-makers. The study covers the period from 2019 to 2033, with a focus on the 2025-2033 forecast period. This report leverages extensive primary and secondary research to deliver an accurate and insightful assessment of the market’s size, growth trajectory, and key trends. The base year for this report is 2025, and the estimated year is 2025. The total market size is projected to reach xx million by 2033.
RTD Coffee Market Structure & Competitive Dynamics
The global RTD coffee market exhibits a moderately consolidated structure, with several multinational giants like Nestlé, Coca-Cola, and Dunkin' Brands holding significant market share. However, smaller, agile companies like Attitude Drinks and regional players like Dydo Drinco and Pokka Group are also contributing significantly to market dynamism. The market exhibits a high level of innovation, with continuous product launches focusing on diverse flavors, functional ingredients, and sustainable packaging. Regulatory frameworks, particularly regarding labeling and ingredient standards, play a significant role. The market is witnessing increasing consolidation through mergers and acquisitions (M&A), with deal values exceeding xx million in recent years. Key factors driving M&A activity include expanding market reach, accessing new technologies, and acquiring established brands. Substitutes such as traditional brewed coffee, tea, and energy drinks exert competitive pressure, but RTD coffee's convenience and diverse offerings contribute to its continued growth. Consumer trends toward healthier options and premium experiences are further shaping market dynamics.
- Market Concentration: Moderate, with major players holding significant but not dominant shares.
- Innovation Ecosystems: Highly active, with continuous product innovation and technological advancements.
- Regulatory Frameworks: Varying across regions, impacting product labeling and ingredient requirements.
- Product Substitutes: Traditional brewed coffee, tea, and energy drinks.
- M&A Activity: Significant, with deal values exceeding xx million annually in the historical period. Examples include [Insert specific M&A examples if available, otherwise use "several significant acquisitions by major players aimed at expanding market reach and product portfolios."]
- Market Share: Nestle holds an estimated xx% market share, followed by Coca-Cola at xx%, and Dunkin' Brands at xx%.
RTD Coffee Industry Trends & Insights
The RTD coffee market is experiencing robust growth, driven by several key factors. The rising demand for convenient and on-the-go beverage options is a major catalyst. Technological advancements in brewing and packaging are enhancing product quality and shelf life, fueling market expansion. Changing consumer preferences towards premiumization, including organic and ethically sourced coffee, present new opportunities for growth. The market’s CAGR during the historical period (2019-2024) is estimated at xx%, reflecting strong growth momentum. The increasing market penetration of RTD coffee, particularly in developing economies, indicates significant future growth potential. Competition is intensifying with new entrants and existing players expanding their product portfolios. The report provides a detailed analysis of these trends and their implications for market players. The estimated market penetration rate in 2025 is xx%, projected to increase to xx% by 2033.
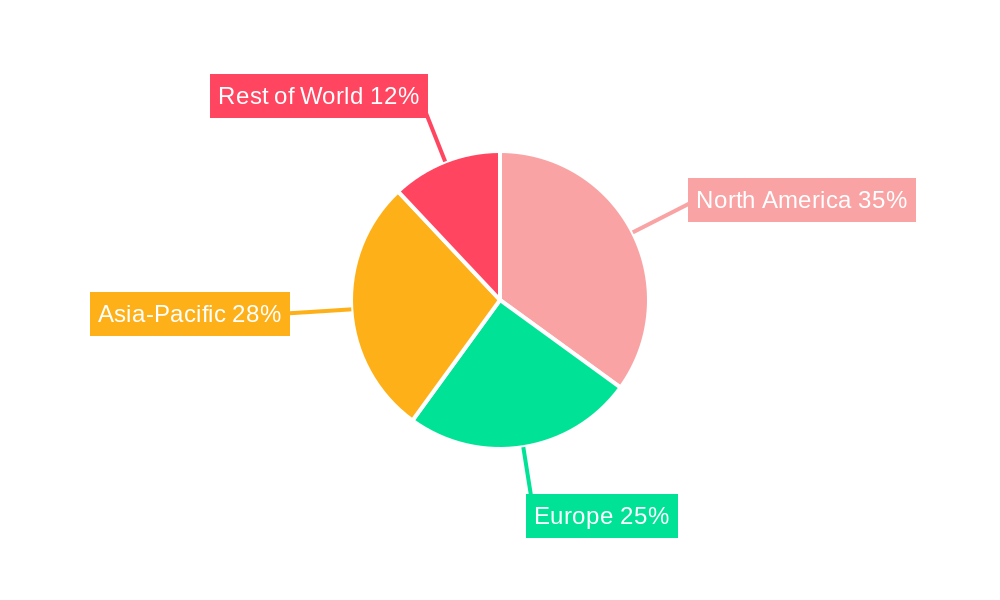
Dominant Markets & Segments in RTD Coffee
The North American RTD coffee market holds a dominant position globally, driven by high per capita coffee consumption, established distribution networks, and a preference for convenience. Key drivers include strong disposable incomes, busy lifestyles promoting on-the-go consumption, and a high prevalence of coffee culture.
- Key Drivers in North America:
- Strong consumer spending power
- High coffee consumption rates
- Well-developed retail infrastructure
- Established distribution networks
- Strong marketing and branding efforts by key players
The dominance of North America is further solidified by factors such as robust economic growth, a strong coffee culture, and extensive distribution channels. Other regions, including Asia-Pacific and Europe, also exhibit significant growth potential, fueled by rising disposable incomes and changing lifestyles.
RTD Coffee Product Innovations
Recent product innovations in the RTD coffee market have focused on enhancing flavor profiles, adding functional ingredients (e.g., vitamins, adaptogens), and using sustainable packaging materials. The incorporation of plant-based milks, cold-brew techniques, and unique flavor combinations are key trends. These innovations cater to evolving consumer preferences for healthier, more convenient, and environmentally friendly options, creating competitive advantages for brands that adopt them.
Report Segmentation & Scope
This report segments the RTD coffee market based on product type (e.g., hot, cold, canned, bottled), distribution channel (e.g., supermarkets, convenience stores, online), and geography (e.g., North America, Europe, Asia-Pacific). Each segment provides detailed growth projections, market sizes, and competitive dynamics, offering a comprehensive understanding of the market landscape. Detailed analysis of individual segment growth rates and market sizes are provided within the full report.
Key Drivers of RTD Coffee Growth
Several factors contribute to the RTD coffee market's growth. The increasing demand for convenient beverages due to busy lifestyles is a major driver. The growing preference for premium and specialized coffee products, such as organic and fair-trade options, further fuels the market's expansion. Technological advancements in preservation and brewing methods allow for higher-quality products with extended shelf life.
Challenges in the RTD Coffee Sector
Challenges in the RTD coffee market include intense competition, fluctuating raw material costs, and stringent regulatory requirements for labeling and ingredients. Supply chain disruptions can significantly impact production and distribution, affecting market stability. Furthermore, maintaining a consistent product quality while adhering to sustainability goals presents an ongoing challenge for companies in the sector. These challenges necessitate efficient supply chain management, sustainable sourcing practices, and continuous innovation to maintain competitiveness.
Leading Players in the RTD Coffee Market
- Nestlé
- Cargill
- Attitude Drinks
- Coca-Cola
- Dunkin' Brands
- Danone
- Dydo Drinco
- Pokka Group
Key Developments in RTD Coffee Sector
- 2022 Q3: Nestlé launched a new line of organic RTD coffee.
- 2023 Q1: Coca-Cola acquired a significant stake in a leading RTD coffee producer.
- 2024 Q2: Dunkin' Brands introduced a new range of plant-based RTD coffee options.
- [Add more developments with dates as available]
Strategic RTD Coffee Market Outlook
The RTD coffee market is poised for continued growth, driven by evolving consumer preferences and ongoing innovation. Strategic opportunities lie in expanding into emerging markets, focusing on sustainable packaging, and developing innovative product offerings that cater to health-conscious consumers. The focus on premiumization and functional ingredients will continue to shape the market landscape. Companies that can effectively manage supply chains, respond to regulatory changes, and adopt agile strategies will be best positioned for success in this dynamic market.
RTD Coffee Segmentation
-
1. Application
- 1.1. Supermarkets/Hypermarkets
- 1.2. Convenience Stores
- 1.3. Food Service
- 1.4. Others
-
2. Types
- 2.1. Glass Bottle
- 2.2. PET Bottle
- 2.3. Canned
- 2.4. Others
RTD Coffee Segmentation By Geography
-
1. North America
- 1.1. United States
- 1.2. Canada
- 1.3. Mexico
-
2. South America
- 2.1. Brazil
- 2.2. Argentina
- 2.3. Rest of South America
-
3. Europe
- 3.1. United Kingdom
- 3.2. Germany
- 3.3. France
- 3.4. Italy
- 3.5. Spain
- 3.6. Russia
- 3.7. Benelux
- 3.8. Nordics
- 3.9. Rest of Europe
-
4. Middle East & Africa
- 4.1. Turkey
- 4.2. Israel
- 4.3. GCC
- 4.4. North Africa
- 4.5. South Africa
- 4.6. Rest of Middle East & Africa
-
5. Asia Pacific
- 5.1. China
- 5.2. India
- 5.3. Japan
- 5.4. South Korea
- 5.5. ASEAN
- 5.6. Oceania
- 5.7. Rest of Asia Pacific
RTD Coffee Regional Market Share
Geographic Coverage of RTD Coffee
RTD Coffee REPORT HIGHLIGHTS
| Aspects | Details |
|---|---|
| Study Period | 2020-2034 |
| Base Year | 2025 |
| Estimated Year | 2026 |
| Forecast Period | 2026-2034 |
| Historical Period | 2020-2025 |
| Growth Rate | CAGR of 7.2% from 2020-2034 |
| Segmentation |
|
Table of Contents
- 1. Introduction
- 1.1. Research Scope
- 1.2. Market Segmentation
- 1.3. Research Objective
- 1.4. Definitions and Assumptions
- 2. Executive Summary
- 2.1. Market Snapshot
- 3. Market Dynamics
- 3.1. Market Drivers
- 3.2. Market Restrains
- 3.3. Market Trends
- 3.4. Market Opportunities
- 4. Market Factor Analysis
- 4.1. Porters Five Forces
- 4.1.1. Bargaining Power of Suppliers
- 4.1.2. Bargaining Power of Buyers
- 4.1.3. Threat of New Entrants
- 4.1.4. Threat of Substitutes
- 4.1.5. Competitive Rivalry
- 4.2. PESTEL analysis
- 4.3. BCG Analysis
- 4.3.1. Stars (High Growth, High Market Share)
- 4.3.2. Cash Cows (Low Growth, High Market Share)
- 4.3.3. Question Mark (High Growth, Low Market Share)
- 4.3.4. Dogs (Low Growth, Low Market Share)
- 4.4. Ansoff Matrix Analysis
- 4.5. Supply Chain Analysis
- 4.6. Regulatory Landscape
- 4.7. Current Market Potential and Opportunity Assessment (TAM–SAM–SOM Framework)
- 4.8. PMV Analyst Note
- 4.1. Porters Five Forces
- 5. Market Analysis, Insights and Forecast 2021-2033
- 5.1. Market Analysis, Insights and Forecast - by Application
- 5.1.1. Supermarkets/Hypermarkets
- 5.1.2. Convenience Stores
- 5.1.3. Food Service
- 5.1.4. Others
- 5.2. Market Analysis, Insights and Forecast - by Types
- 5.2.1. Glass Bottle
- 5.2.2. PET Bottle
- 5.2.3. Canned
- 5.2.4. Others
- 5.3. Market Analysis, Insights and Forecast - by Region
- 5.3.1. North America
- 5.3.2. South America
- 5.3.3. Europe
- 5.3.4. Middle East & Africa
- 5.3.5. Asia Pacific
- 5.1. Market Analysis, Insights and Forecast - by Application
- 6. Global RTD Coffee Analysis, Insights and Forecast, 2021-2033
- 6.1. Market Analysis, Insights and Forecast - by Application
- 6.1.1. Supermarkets/Hypermarkets
- 6.1.2. Convenience Stores
- 6.1.3. Food Service
- 6.1.4. Others
- 6.2. Market Analysis, Insights and Forecast - by Types
- 6.2.1. Glass Bottle
- 6.2.2. PET Bottle
- 6.2.3. Canned
- 6.2.4. Others
- 6.1. Market Analysis, Insights and Forecast - by Application
- 7. North America RTD Coffee Analysis, Insights and Forecast, 2020-2032
- 7.1. Market Analysis, Insights and Forecast - by Application
- 7.1.1. Supermarkets/Hypermarkets
- 7.1.2. Convenience Stores
- 7.1.3. Food Service
- 7.1.4. Others
- 7.2. Market Analysis, Insights and Forecast - by Types
- 7.2.1. Glass Bottle
- 7.2.2. PET Bottle
- 7.2.3. Canned
- 7.2.4. Others
- 7.1. Market Analysis, Insights and Forecast - by Application
- 8. South America RTD Coffee Analysis, Insights and Forecast, 2020-2032
- 8.1. Market Analysis, Insights and Forecast - by Application
- 8.1.1. Supermarkets/Hypermarkets
- 8.1.2. Convenience Stores
- 8.1.3. Food Service
- 8.1.4. Others
- 8.2. Market Analysis, Insights and Forecast - by Types
- 8.2.1. Glass Bottle
- 8.2.2. PET Bottle
- 8.2.3. Canned
- 8.2.4. Others
- 8.1. Market Analysis, Insights and Forecast - by Application
- 9. Europe RTD Coffee Analysis, Insights and Forecast, 2020-2032
- 9.1. Market Analysis, Insights and Forecast - by Application
- 9.1.1. Supermarkets/Hypermarkets
- 9.1.2. Convenience Stores
- 9.1.3. Food Service
- 9.1.4. Others
- 9.2. Market Analysis, Insights and Forecast - by Types
- 9.2.1. Glass Bottle
- 9.2.2. PET Bottle
- 9.2.3. Canned
- 9.2.4. Others
- 9.1. Market Analysis, Insights and Forecast - by Application
- 10. Middle East & Africa RTD Coffee Analysis, Insights and Forecast, 2020-2032
- 10.1. Market Analysis, Insights and Forecast - by Application
- 10.1.1. Supermarkets/Hypermarkets
- 10.1.2. Convenience Stores
- 10.1.3. Food Service
- 10.1.4. Others
- 10.2. Market Analysis, Insights and Forecast - by Types
- 10.2.1. Glass Bottle
- 10.2.2. PET Bottle
- 10.2.3. Canned
- 10.2.4. Others
- 10.1. Market Analysis, Insights and Forecast - by Application
- 11. Asia Pacific RTD Coffee Analysis, Insights and Forecast, 2020-2032
- 11.1. Market Analysis, Insights and Forecast - by Application
- 11.1.1. Supermarkets/Hypermarkets
- 11.1.2. Convenience Stores
- 11.1.3. Food Service
- 11.1.4. Others
- 11.2. Market Analysis, Insights and Forecast - by Types
- 11.2.1. Glass Bottle
- 11.2.2. PET Bottle
- 11.2.3. Canned
- 11.2.4. Others
- 11.1. Market Analysis, Insights and Forecast - by Application
- 12. Competitive Analysis
- 12.1. Company Profiles
- 12.1.1 Nestlé
- 12.1.1.1. Company Overview
- 12.1.1.2. Products
- 12.1.1.3. Company Financials
- 12.1.1.4. SWOT Analysis
- 12.1.2 Cargill
- 12.1.2.1. Company Overview
- 12.1.2.2. Products
- 12.1.2.3. Company Financials
- 12.1.2.4. SWOT Analysis
- 12.1.3 Attitude Drinks
- 12.1.3.1. Company Overview
- 12.1.3.2. Products
- 12.1.3.3. Company Financials
- 12.1.3.4. SWOT Analysis
- 12.1.4 Coca-Cola
- 12.1.4.1. Company Overview
- 12.1.4.2. Products
- 12.1.4.3. Company Financials
- 12.1.4.4. SWOT Analysis
- 12.1.5 Dunkin' Brands
- 12.1.5.1. Company Overview
- 12.1.5.2. Products
- 12.1.5.3. Company Financials
- 12.1.5.4. SWOT Analysis
- 12.1.6 Danone
- 12.1.6.1. Company Overview
- 12.1.6.2. Products
- 12.1.6.3. Company Financials
- 12.1.6.4. SWOT Analysis
- 12.1.7 DydoDrinco
- 12.1.7.1. Company Overview
- 12.1.7.2. Products
- 12.1.7.3. Company Financials
- 12.1.7.4. SWOT Analysis
- 12.1.8 Pokka Group
- 12.1.8.1. Company Overview
- 12.1.8.2. Products
- 12.1.8.3. Company Financials
- 12.1.8.4. SWOT Analysis
- 12.1.1 Nestlé
- 12.2. Market Entropy
- 12.2.1 Company's Key Areas Served
- 12.2.2 Recent Developments
- 12.3. Company Market Share Analysis 2025
- 12.3.1 Top 5 Companies Market Share Analysis
- 12.3.2 Top 3 Companies Market Share Analysis
- 12.4. List of Potential Customers
- 13. Research Methodology
List of Figures
- Figure 1: Global RTD Coffee Revenue Breakdown (billion, %) by Region 2025 & 2033
- Figure 2: Global RTD Coffee Volume Breakdown (K, %) by Region 2025 & 2033
- Figure 3: North America RTD Coffee Revenue (billion), by Application 2025 & 2033
- Figure 4: North America RTD Coffee Volume (K), by Application 2025 & 2033
- Figure 5: North America RTD Coffee Revenue Share (%), by Application 2025 & 2033
- Figure 6: North America RTD Coffee Volume Share (%), by Application 2025 & 2033
- Figure 7: North America RTD Coffee Revenue (billion), by Types 2025 & 2033
- Figure 8: North America RTD Coffee Volume (K), by Types 2025 & 2033
- Figure 9: North America RTD Coffee Revenue Share (%), by Types 2025 & 2033
- Figure 10: North America RTD Coffee Volume Share (%), by Types 2025 & 2033
- Figure 11: North America RTD Coffee Revenue (billion), by Country 2025 & 2033
- Figure 12: North America RTD Coffee Volume (K), by Country 2025 & 2033
- Figure 13: North America RTD Coffee Revenue Share (%), by Country 2025 & 2033
- Figure 14: North America RTD Coffee Volume Share (%), by Country 2025 & 2033
- Figure 15: South America RTD Coffee Revenue (billion), by Application 2025 & 2033
- Figure 16: South America RTD Coffee Volume (K), by Application 2025 & 2033
- Figure 17: South America RTD Coffee Revenue Share (%), by Application 2025 & 2033
- Figure 18: South America RTD Coffee Volume Share (%), by Application 2025 & 2033
- Figure 19: South America RTD Coffee Revenue (billion), by Types 2025 & 2033
- Figure 20: South America RTD Coffee Volume (K), by Types 2025 & 2033
- Figure 21: South America RTD Coffee Revenue Share (%), by Types 2025 & 2033
- Figure 22: South America RTD Coffee Volume Share (%), by Types 2025 & 2033
- Figure 23: South America RTD Coffee Revenue (billion), by Country 2025 & 2033
- Figure 24: South America RTD Coffee Volume (K), by Country 2025 & 2033
- Figure 25: South America RTD Coffee Revenue Share (%), by Country 2025 & 2033
- Figure 26: South America RTD Coffee Volume Share (%), by Country 2025 & 2033
- Figure 27: Europe RTD Coffee Revenue (billion), by Application 2025 & 2033
- Figure 28: Europe RTD Coffee Volume (K), by Application 2025 & 2033
- Figure 29: Europe RTD Coffee Revenue Share (%), by Application 2025 & 2033
- Figure 30: Europe RTD Coffee Volume Share (%), by Application 2025 & 2033
- Figure 31: Europe RTD Coffee Revenue (billion), by Types 2025 & 2033
- Figure 32: Europe RTD Coffee Volume (K), by Types 2025 & 2033
- Figure 33: Europe RTD Coffee Revenue Share (%), by Types 2025 & 2033
- Figure 34: Europe RTD Coffee Volume Share (%), by Types 2025 & 2033
- Figure 35: Europe RTD Coffee Revenue (billion), by Country 2025 & 2033
- Figure 36: Europe RTD Coffee Volume (K), by Country 2025 & 2033
- Figure 37: Europe RTD Coffee Revenue Share (%), by Country 2025 & 2033
- Figure 38: Europe RTD Coffee Volume Share (%), by Country 2025 & 2033
- Figure 39: Middle East & Africa RTD Coffee Revenue (billion), by Application 2025 & 2033
- Figure 40: Middle East & Africa RTD Coffee Volume (K), by Application 2025 & 2033
- Figure 41: Middle East & Africa RTD Coffee Revenue Share (%), by Application 2025 & 2033
- Figure 42: Middle East & Africa RTD Coffee Volume Share (%), by Application 2025 & 2033
- Figure 43: Middle East & Africa RTD Coffee Revenue (billion), by Types 2025 & 2033
- Figure 44: Middle East & Africa RTD Coffee Volume (K), by Types 2025 & 2033
- Figure 45: Middle East & Africa RTD Coffee Revenue Share (%), by Types 2025 & 2033
- Figure 46: Middle East & Africa RTD Coffee Volume Share (%), by Types 2025 & 2033
- Figure 47: Middle East & Africa RTD Coffee Revenue (billion), by Country 2025 & 2033
- Figure 48: Middle East & Africa RTD Coffee Volume (K), by Country 2025 & 2033
- Figure 49: Middle East & Africa RTD Coffee Revenue Share (%), by Country 2025 & 2033
- Figure 50: Middle East & Africa RTD Coffee Volume Share (%), by Country 2025 & 2033
- Figure 51: Asia Pacific RTD Coffee Revenue (billion), by Application 2025 & 2033
- Figure 52: Asia Pacific RTD Coffee Volume (K), by Application 2025 & 2033
- Figure 53: Asia Pacific RTD Coffee Revenue Share (%), by Application 2025 & 2033
- Figure 54: Asia Pacific RTD Coffee Volume Share (%), by Application 2025 & 2033
- Figure 55: Asia Pacific RTD Coffee Revenue (billion), by Types 2025 & 2033
- Figure 56: Asia Pacific RTD Coffee Volume (K), by Types 2025 & 2033
- Figure 57: Asia Pacific RTD Coffee Revenue Share (%), by Types 2025 & 2033
- Figure 58: Asia Pacific RTD Coffee Volume Share (%), by Types 2025 & 2033
- Figure 59: Asia Pacific RTD Coffee Revenue (billion), by Country 2025 & 2033
- Figure 60: Asia Pacific RTD Coffee Volume (K), by Country 2025 & 2033
- Figure 61: Asia Pacific RTD Coffee Revenue Share (%), by Country 2025 & 2033
- Figure 62: Asia Pacific RTD Coffee Volume Share (%), by Country 2025 & 2033
List of Tables
- Table 1: Global RTD Coffee Revenue billion Forecast, by Application 2020 & 2033
- Table 2: Global RTD Coffee Volume K Forecast, by Application 2020 & 2033
- Table 3: Global RTD Coffee Revenue billion Forecast, by Types 2020 & 2033
- Table 4: Global RTD Coffee Volume K Forecast, by Types 2020 & 2033
- Table 5: Global RTD Coffee Revenue billion Forecast, by Region 2020 & 2033
- Table 6: Global RTD Coffee Volume K Forecast, by Region 2020 & 2033
- Table 7: Global RTD Coffee Revenue billion Forecast, by Application 2020 & 2033
- Table 8: Global RTD Coffee Volume K Forecast, by Application 2020 & 2033
- Table 9: Global RTD Coffee Revenue billion Forecast, by Types 2020 & 2033
- Table 10: Global RTD Coffee Volume K Forecast, by Types 2020 & 2033
- Table 11: Global RTD Coffee Revenue billion Forecast, by Country 2020 & 2033
- Table 12: Global RTD Coffee Volume K Forecast, by Country 2020 & 2033
- Table 13: United States RTD Coffee Revenue (billion) Forecast, by Application 2020 & 2033
- Table 14: United States RTD Coffee Volume (K) Forecast, by Application 2020 & 2033
- Table 15: Canada RTD Coffee Revenue (billion) Forecast, by Application 2020 & 2033
- Table 16: Canada RTD Coffee Volume (K) Forecast, by Application 2020 & 2033
- Table 17: Mexico RTD Coffee Revenue (billion) Forecast, by Application 2020 & 2033
- Table 18: Mexico RTD Coffee Volume (K) Forecast, by Application 2020 & 2033
- Table 19: Global RTD Coffee Revenue billion Forecast, by Application 2020 & 2033
- Table 20: Global RTD Coffee Volume K Forecast, by Application 2020 & 2033
- Table 21: Global RTD Coffee Revenue billion Forecast, by Types 2020 & 2033
- Table 22: Global RTD Coffee Volume K Forecast, by Types 2020 & 2033
- Table 23: Global RTD Coffee Revenue billion Forecast, by Country 2020 & 2033
- Table 24: Global RTD Coffee Volume K Forecast, by Country 2020 & 2033
- Table 25: Brazil RTD Coffee Revenue (billion) Forecast, by Application 2020 & 2033
- Table 26: Brazil RTD Coffee Volume (K) Forecast, by Application 2020 & 2033
- Table 27: Argentina RTD Coffee Revenue (billion) Forecast, by Application 2020 & 2033
- Table 28: Argentina RTD Coffee Volume (K) Forecast, by Application 2020 & 2033
- Table 29: Rest of South America RTD Coffee Revenue (billion) Forecast, by Application 2020 & 2033
- Table 30: Rest of South America RTD Coffee Volume (K) Forecast, by Application 2020 & 2033
- Table 31: Global RTD Coffee Revenue billion Forecast, by Application 2020 & 2033
- Table 32: Global RTD Coffee Volume K Forecast, by Application 2020 & 2033
- Table 33: Global RTD Coffee Revenue billion Forecast, by Types 2020 & 2033
- Table 34: Global RTD Coffee Volume K Forecast, by Types 2020 & 2033
- Table 35: Global RTD Coffee Revenue billion Forecast, by Country 2020 & 2033
- Table 36: Global RTD Coffee Volume K Forecast, by Country 2020 & 2033
- Table 37: United Kingdom RTD Coffee Revenue (billion) Forecast, by Application 2020 & 2033
- Table 38: United Kingdom RTD Coffee Volume (K) Forecast, by Application 2020 & 2033
- Table 39: Germany RTD Coffee Revenue (billion) Forecast, by Application 2020 & 2033
- Table 40: Germany RTD Coffee Volume (K) Forecast, by Application 2020 & 2033
- Table 41: France RTD Coffee Revenue (billion) Forecast, by Application 2020 & 2033
- Table 42: France RTD Coffee Volume (K) Forecast, by Application 2020 & 2033
- Table 43: Italy RTD Coffee Revenue (billion) Forecast, by Application 2020 & 2033
- Table 44: Italy RTD Coffee Volume (K) Forecast, by Application 2020 & 2033
- Table 45: Spain RTD Coffee Revenue (billion) Forecast, by Application 2020 & 2033
- Table 46: Spain RTD Coffee Volume (K) Forecast, by Application 2020 & 2033
- Table 47: Russia RTD Coffee Revenue (billion) Forecast, by Application 2020 & 2033
- Table 48: Russia RTD Coffee Volume (K) Forecast, by Application 2020 & 2033
- Table 49: Benelux RTD Coffee Revenue (billion) Forecast, by Application 2020 & 2033
- Table 50: Benelux RTD Coffee Volume (K) Forecast, by Application 2020 & 2033
- Table 51: Nordics RTD Coffee Revenue (billion) Forecast, by Application 2020 & 2033
- Table 52: Nordics RTD Coffee Volume (K) Forecast, by Application 2020 & 2033
- Table 53: Rest of Europe RTD Coffee Revenue (billion) Forecast, by Application 2020 & 2033
- Table 54: Rest of Europe RTD Coffee Volume (K) Forecast, by Application 2020 & 2033
- Table 55: Global RTD Coffee Revenue billion Forecast, by Application 2020 & 2033
- Table 56: Global RTD Coffee Volume K Forecast, by Application 2020 & 2033
- Table 57: Global RTD Coffee Revenue billion Forecast, by Types 2020 & 2033
- Table 58: Global RTD Coffee Volume K Forecast, by Types 2020 & 2033
- Table 59: Global RTD Coffee Revenue billion Forecast, by Country 2020 & 2033
- Table 60: Global RTD Coffee Volume K Forecast, by Country 2020 & 2033
- Table 61: Turkey RTD Coffee Revenue (billion) Forecast, by Application 2020 & 2033
- Table 62: Turkey RTD Coffee Volume (K) Forecast, by Application 2020 & 2033
- Table 63: Israel RTD Coffee Revenue (billion) Forecast, by Application 2020 & 2033
- Table 64: Israel RTD Coffee Volume (K) Forecast, by Application 2020 & 2033
- Table 65: GCC RTD Coffee Revenue (billion) Forecast, by Application 2020 & 2033
- Table 66: GCC RTD Coffee Volume (K) Forecast, by Application 2020 & 2033
- Table 67: North Africa RTD Coffee Revenue (billion) Forecast, by Application 2020 & 2033
- Table 68: North Africa RTD Coffee Volume (K) Forecast, by Application 2020 & 2033
- Table 69: South Africa RTD Coffee Revenue (billion) Forecast, by Application 2020 & 2033
- Table 70: South Africa RTD Coffee Volume (K) Forecast, by Application 2020 & 2033
- Table 71: Rest of Middle East & Africa RTD Coffee Revenue (billion) Forecast, by Application 2020 & 2033
- Table 72: Rest of Middle East & Africa RTD Coffee Volume (K) Forecast, by Application 2020 & 2033
- Table 73: Global RTD Coffee Revenue billion Forecast, by Application 2020 & 2033
- Table 74: Global RTD Coffee Volume K Forecast, by Application 2020 & 2033
- Table 75: Global RTD Coffee Revenue billion Forecast, by Types 2020 & 2033
- Table 76: Global RTD Coffee Volume K Forecast, by Types 2020 & 2033
- Table 77: Global RTD Coffee Revenue billion Forecast, by Country 2020 & 2033
- Table 78: Global RTD Coffee Volume K Forecast, by Country 2020 & 2033
- Table 79: China RTD Coffee Revenue (billion) Forecast, by Application 2020 & 2033
- Table 80: China RTD Coffee Volume (K) Forecast, by Application 2020 & 2033
- Table 81: India RTD Coffee Revenue (billion) Forecast, by Application 2020 & 2033
- Table 82: India RTD Coffee Volume (K) Forecast, by Application 2020 & 2033
- Table 83: Japan RTD Coffee Revenue (billion) Forecast, by Application 2020 & 2033
- Table 84: Japan RTD Coffee Volume (K) Forecast, by Application 2020 & 2033
- Table 85: South Korea RTD Coffee Revenue (billion) Forecast, by Application 2020 & 2033
- Table 86: South Korea RTD Coffee Volume (K) Forecast, by Application 2020 & 2033
- Table 87: ASEAN RTD Coffee Revenue (billion) Forecast, by Application 2020 & 2033
- Table 88: ASEAN RTD Coffee Volume (K) Forecast, by Application 2020 & 2033
- Table 89: Oceania RTD Coffee Revenue (billion) Forecast, by Application 2020 & 2033
- Table 90: Oceania RTD Coffee Volume (K) Forecast, by Application 2020 & 2033
- Table 91: Rest of Asia Pacific RTD Coffee Revenue (billion) Forecast, by Application 2020 & 2033
- Table 92: Rest of Asia Pacific RTD Coffee Volume (K) Forecast, by Application 2020 & 2033
Frequently Asked Questions
1. What is the projected Compound Annual Growth Rate (CAGR) of the RTD Coffee?
The projected CAGR is approximately 7.2%.
2. Which companies are prominent players in the RTD Coffee?
Key companies in the market include Nestlé, Cargill, Attitude Drinks, Coca-Cola, Dunkin' Brands, Danone, DydoDrinco, Pokka Group.
3. What are the main segments of the RTD Coffee?
The market segments include Application, Types.
4. Can you provide details about the market size?
The market size is estimated to be USD 26.2 billion as of 2022.
5. What are some drivers contributing to market growth?
N/A
6. What are the notable trends driving market growth?
N/A
7. Are there any restraints impacting market growth?
N/A
8. Can you provide examples of recent developments in the market?
N/A
9. What pricing options are available for accessing the report?
Pricing options include single-user, multi-user, and enterprise licenses priced at USD 3350.00, USD 5025.00, and USD 6700.00 respectively.
10. Is the market size provided in terms of value or volume?
The market size is provided in terms of value, measured in billion and volume, measured in K.
11. Are there any specific market keywords associated with the report?
Yes, the market keyword associated with the report is "RTD Coffee," which aids in identifying and referencing the specific market segment covered.
12. How do I determine which pricing option suits my needs best?
The pricing options vary based on user requirements and access needs. Individual users may opt for single-user licenses, while businesses requiring broader access may choose multi-user or enterprise licenses for cost-effective access to the report.
13. Are there any additional resources or data provided in the RTD Coffee report?
While the report offers comprehensive insights, it's advisable to review the specific contents or supplementary materials provided to ascertain if additional resources or data are available.
14. How can I stay updated on further developments or reports in the RTD Coffee?
To stay informed about further developments, trends, and reports in the RTD Coffee, consider subscribing to industry newsletters, following relevant companies and organizations, or regularly checking reputable industry news sources and publications.
Methodology
Step 1 - Identification of Relevant Samples Size from Population Database


Step 2 - Approaches for Defining Global Market Size (Value, Volume* & Price*)

Note*: In applicable scenarios
Step 3 - Data Sources
Primary Research
- Web Analytics
- Survey Reports
- Research Institute
- Latest Research Reports
- Opinion Leaders
Secondary Research
- Annual Reports
- White Paper
- Latest Press Release
- Industry Association
- Paid Database
- Investor Presentations

Step 4 - Data Triangulation
Involves using different sources of information in order to increase the validity of a study
These sources are likely to be stakeholders in a program - participants, other researchers, program staff, other community members, and so on.
Then we put all data in single framework & apply various statistical tools to find out the dynamic on the market.
During the analysis stage, feedback from the stakeholder groups would be compared to determine areas of agreement as well as areas of divergence

