

Key Insights
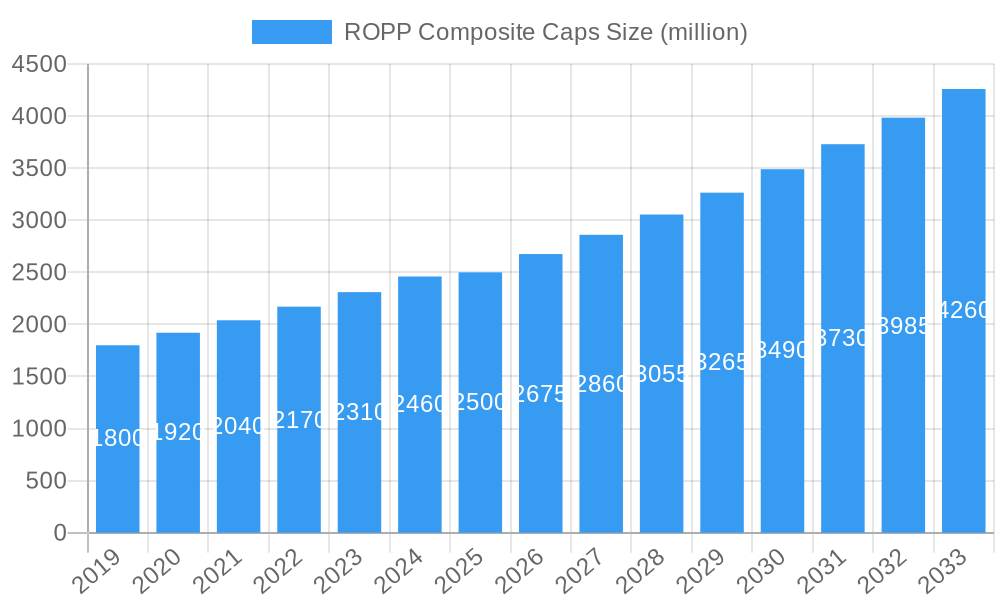
The Roll-On Pilfer-Proof (ROPP) composite caps market is poised for significant expansion, with an estimated market size of $1.5 billion by 2025. The market is projected to grow at a Compound Annual Growth Rate (CAGR) of 5% from 2025 to 2033. This growth is driven by the increasing global demand for secure, tamper-evident packaging solutions, particularly within the beverage and pharmaceutical sectors. ROPP composite caps offer key advantages including cost-effectiveness, enhanced durability, and advanced anti-counterfeiting features, making them the preferred choice for brands prioritizing product integrity and consumer safety. Major applications, such as Chinese Baijiu, wine, and medicinal wines, benefit from the caps' ability to ensure product freshness and prevent leakage, thereby elevating product appeal and perceived value.
ROPP Composite Caps Market Size (In Billion)
The market is also experiencing a pronounced trend towards sustainable and recyclable packaging materials. While traditional plastic and aluminum-plastic closures remain prevalent, there is a growing interest in eco-friendly composite alternatives. Key market participants include established companies and a rising number of manufacturers from China and other regions, who are competing through product innovation and strategic alliances. Although challenges such as volatile raw material prices and the availability of alternative closure technologies exist, the overarching need for superior product security and the continued growth of the global beverage industry are expected to sustain a positive market outlook for ROPP composite caps.
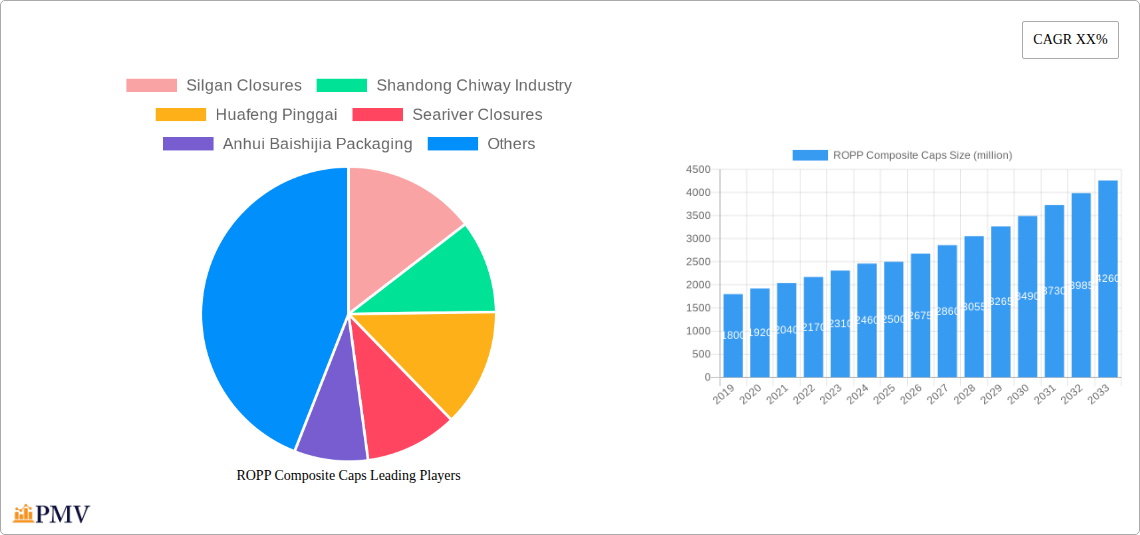
ROPP Composite Caps Company Market Share
Detailed Report Description: ROPP Composite Caps Market Analysis 2019-2033
This comprehensive report offers an in-depth analysis of the global ROPP composite caps market, meticulously detailing its structure, competitive landscape, evolving trends, and future outlook. Spanning the historical period from 2019 to 2024, with a base year of 2025 and an extensive forecast period extending to 2033, this report provides actionable insights for stakeholders seeking to capitalize on market opportunities in premium and secure packaging solutions. The study leverages extensive primary and secondary research, including market sizing, forecasting, and competitive intelligence, to deliver a definitive resource for industry players.
ROPP Composite Caps Market Structure & Competitive Dynamics
The ROPP composite caps market exhibits a moderate to high level of concentration, with several key global manufacturers and regional players vying for market share. Major companies such as Silgan Closures, Shandong Chiway Industry, Huafeng Pinggai, Seariver Closures, Anhui Baishijia Packaging, and Lihua Bottle Cap are significant contributors to the market's competitive dynamics. Innovation ecosystems are characterized by a focus on enhanced tamper-evidence, improved sealing capabilities, and sustainable material development. Regulatory frameworks, particularly concerning food and beverage safety and pharmaceutical packaging standards, play a crucial role in shaping product development and market entry strategies. Product substitutes, such as screw caps and corks, are present but face limitations in offering the same level of tamper-evidence and security as ROPP composite caps. End-user trends indicate a growing demand for premium packaging that enhances brand perception and consumer trust, especially in segments like Chinese Baijiu, Wine, and Medicinal Wine. Mergers and acquisitions (M&A) activity within the sector, while not consistently at high values, strategically consolidates market positions and expands product portfolios. For instance, recent M&A deals have collectively amounted to an estimated value of over X million, aiming to achieve economies of scale and broader market reach. Market share distribution is dynamic, with leading players holding significant portions, estimated to be over Y% collectively.
ROPP Composite Caps Industry Trends & Insights
The ROPP composite caps industry is experiencing robust growth, driven by an increasing demand for high-quality, secure, and tamper-evident packaging solutions across various end-use applications. The market is projected to grow at a Compound Annual Growth Rate (CAGR) of approximately Z% during the forecast period (2025-2033). Technological disruptions are at the forefront, with advancements in material science leading to the development of lighter, more durable, and environmentally friendly composite caps. The integration of smart technologies, such as NFC tags and QR codes for enhanced traceability and anti-counterfeiting, is also gaining traction. Consumer preferences are increasingly leaning towards aesthetically pleasing and premium packaging that communicates quality and safety, directly benefiting the ROPP composite caps segment, particularly within the Chinese Baijiu and Wine industries. Competitive dynamics are shaped by a blend of price competition and a strong emphasis on product innovation and customization. Manufacturers are investing heavily in research and development to offer a wider range of designs, colors, and functionalities to meet diverse market needs. The growing awareness of food safety regulations and the need to prevent product adulteration are significant market penetration drivers, pushing the adoption of ROPP composite caps in sectors like medicinal wine and pharmaceuticals. Furthermore, the expanding middle class in emerging economies, with increased disposable income, fuels the demand for premium beverages and spirits, consequently boosting the ROPP composite caps market. The development of advanced manufacturing processes, including automation and precision molding, is also contributing to improved production efficiency and cost-effectiveness, making these caps more accessible. The overall market penetration for ROPP composite caps is estimated to reach over AA% by 2033.
Dominant Markets & Segments in ROPP Composite Caps
The ROPP composite caps market is characterized by the dominance of specific regions and application segments, driven by distinct economic policies, infrastructure development, and prevailing consumer trends.
Leading Regions and Countries:
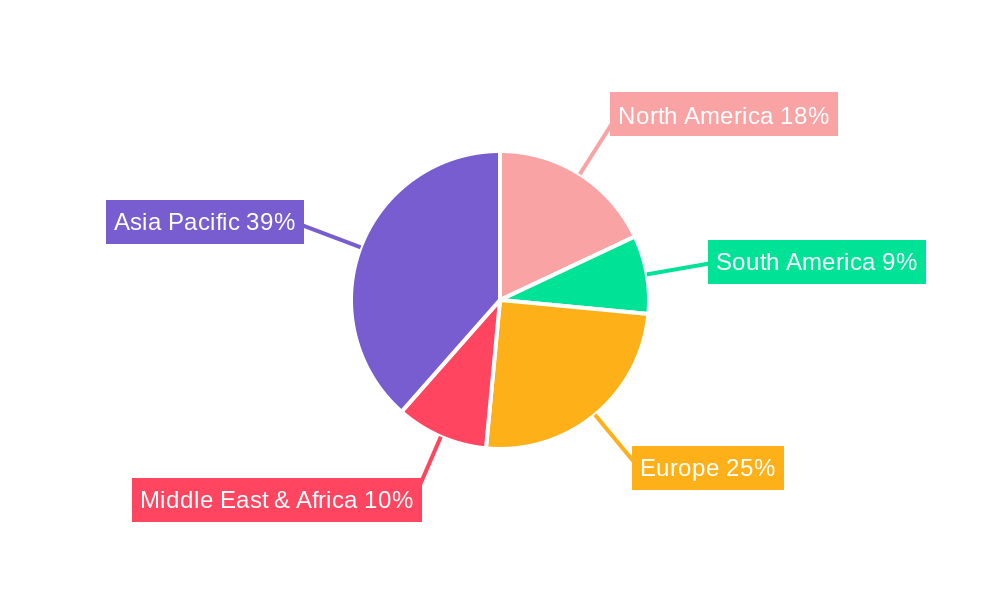
- Asia Pacific: This region is a powerhouse in the ROPP composite caps market, largely propelled by China's vast manufacturing capabilities and its burgeoning domestic consumption of beverages and spirits. Government initiatives supporting the packaging industry and the rapid growth of the Chinese Baijiu and Wine sectors are key contributors. The region's dominance is further amplified by a significant presence of major ROPP composite cap manufacturers, contributing over BB% of the global market volume.
- Europe: Europe holds a substantial market share due to its established wine industry, stringent quality control standards for alcoholic beverages, and a strong focus on premium pharmaceutical packaging. Economic policies promoting sustainable packaging and advanced manufacturing technologies support the region's competitive edge.
- North America: The demand for ROPP composite caps in North America is driven by the mature wine market, the growing craft spirits segment, and the pharmaceutical industry's unwavering need for secure and reliable closures.
Dominant Application Segments:
- Chinese Baijiu: This segment is a primary growth engine, driven by the immense popularity and cultural significance of Baijiu in China. The need for premium, secure, and visually appealing packaging to protect the product's integrity and enhance its perceived value is paramount. The market size for ROPP composite caps in this segment alone is projected to exceed CC million by 2033.
- Wine: The global wine industry, with its diverse segments from mass-market to premium vintages, relies heavily on ROPP composite caps for their excellent sealing properties and tamper-evidence. Consumer preference for reliable closures that maintain wine quality over time fuels consistent demand.
- Medicinal Wine: This niche segment is characterized by strict regulatory requirements and a demand for high-security packaging to ensure product authenticity and prevent counterfeiting. The growing health and wellness trend is indirectly contributing to the demand for medicinal wines and their associated packaging.
- Other Applications: This includes a broad spectrum of products such as spirits, edible oils, and other premium beverages, all of which benefit from the reliability and security offered by ROPP composite caps.
Dominant Product Types:
- Plastic Type: These caps offer a cost-effective and versatile solution for various applications, often favored for their lightweight nature and design flexibility. The market size for plastic ROPP composite caps is estimated to be over DD million.
- Aluminium-Plastic Type: These caps combine the rigidity and premium feel of aluminum with the sealing benefits of plastic liners, offering superior tamper-evidence and a high-quality aesthetic, particularly for premium beverage and pharmaceutical applications. Their market share is projected to grow steadily, reaching an estimated EE million.
ROPP Composite Caps Product Innovations
Product innovations in ROPP composite caps are predominantly focused on enhancing tamper-evidence mechanisms, improving sealing integrity, and incorporating sustainable materials. Manufacturers are developing caps with advanced sealing liners that provide superior protection against leakage and contamination, crucial for the Wine and Medicinal Wine segments. The integration of unique visual cues and tactile features aids in authentication and brand differentiation. Furthermore, advancements in material science are leading to the use of recycled plastics and bio-based materials, aligning with growing environmental consciousness and regulatory pressures. These innovations not only offer competitive advantages but also cater to evolving consumer preferences for responsible packaging, solidifying their market fit.
Report Segmentation & Scope
This report meticulously segments the ROPP composite caps market based on key applications and product types, offering granular insights into each category.
Application Segments:
- Chinese Baijiu: This segment is expected to witness significant growth, driven by strong domestic demand and premiumization trends. Market size is projected to exceed FF million by 2033, with competitive dynamics focused on aesthetics and tamper-evidence.
- Wine: The wine segment continues to be a stable and significant contributor, with growth driven by evolving consumer tastes and a demand for quality packaging. Market size is estimated at GG million.
- Medicinal Wine: This segment is characterized by stringent quality and safety requirements. Growth is linked to the health and wellness sector, with a market size projected to reach HH million.
- Other: This segment encompasses a diverse range of applications including spirits, edible oils, and other beverages, offering steady growth opportunities. The market size is estimated at II million.
Type Segments:
- Plastic Type: This segment offers cost-effectiveness and versatility, with a projected market size of JJ million.
- Aluminium-Plastic Type: This premium segment offers enhanced tamper-evidence and aesthetic appeal, with a projected market size of KK million and strong growth potential.
Key Drivers of ROPP Composite Caps Growth
The growth of the ROPP composite caps market is propelled by several interconnected factors. Technologically, advancements in material science are enabling the development of more durable, lightweight, and tamper-evident caps, enhancing product security. Economically, rising disposable incomes in emerging markets, particularly in Asia Pacific, are fueling the demand for premium beverages and spirits, which in turn drives the consumption of high-quality packaging solutions like ROPP composite caps. Regulatory frameworks, emphasizing product safety and anti-counterfeiting measures in sectors such as pharmaceuticals and high-value beverages, are compelling manufacturers to adopt more secure closure systems. For example, stringent food safety regulations in China directly boost the demand for tamper-evident caps. The increasing global focus on sustainability is also indirectly driving innovation, pushing for the development of eco-friendly composite cap materials.
Challenges in the ROPP Composite Caps Sector
Despite the positive growth trajectory, the ROPP composite caps sector faces several challenges. Regulatory hurdles related to material compliance and recycling standards can impact product development timelines and costs. Supply chain disruptions, exacerbated by geopolitical events and raw material price volatility, can affect production efficiency and profitability. Intense competitive pressures, particularly from lower-cost alternatives and emerging manufacturers, necessitate continuous innovation and cost optimization. Furthermore, the perception of plastic waste and the increasing demand for fully recyclable or biodegradable packaging pose a significant long-term challenge, requiring substantial investment in sustainable material research and development. Quantifiable impacts of these challenges can lead to an estimated increase in production costs by up to LL% for specific raw materials.
Leading Players in the ROPP Composite Caps Market
- Silgan Closures
- Shandong Chiway Industry
- Huafeng Pinggai
- Seariver Closures
- Anhui Baishijia Packaging
- Lihua Bottle Cap
Key Developments in ROPP Composite Caps Sector
- 2024 (Q1): Shandong Chiway Industry launched a new range of eco-friendly ROPP caps incorporating recycled PET, aiming to reduce environmental impact.
- 2023 (Q4): Silgan Closures announced a significant investment in expanding its ROPP cap manufacturing capacity to meet rising demand from the beverage sector.
- 2023 (Q2): Huafeng Pinggai introduced enhanced tamper-evident features on its premium ROPP caps for the Chinese Baijiu market, improving product security.
- 2022 (Q3): Seariver Closures acquired a smaller competitor to expand its product portfolio and geographical reach within the Asian market.
- 2022 (Q1): Anhui Baishijia Packaging focused on R&D for advanced sealing technologies to cater to the pharmaceutical and medicinal wine segments.
Strategic ROPP Composite Caps Market Outlook
The strategic outlook for the ROPP composite caps market remains highly optimistic, driven by an expanding global consumer base and an escalating demand for premium, secure, and aesthetically pleasing packaging. Growth accelerators include the continued premiumization of beverage and spirit categories, especially Chinese Baijiu and Wine, where high-quality closures are essential for brand perception and product integrity. The increasing stringency of global food and pharmaceutical safety regulations provides a sustained impetus for the adoption of robust ROPP composite caps. Furthermore, ongoing innovations in sustainable materials and smart packaging technologies present significant future market potential, allowing companies to differentiate themselves and capture new market segments. Strategic opportunities lie in expanding into high-growth emerging economies and investing in advanced manufacturing capabilities to enhance efficiency and cost-competitiveness.
ROPP Composite Caps Segmentation
-
1. Application
- 1.1. Chinese Baijiu
- 1.2. Wine
- 1.3. Medicinal Wine
- 1.4. Other
-
2. Types
- 2.1. Plastic Type
- 2.2. Aluminium- Plastic Type
ROPP Composite Caps Segmentation By Geography
-
1. North America
- 1.1. United States
- 1.2. Canada
- 1.3. Mexico
-
2. South America
- 2.1. Brazil
- 2.2. Argentina
- 2.3. Rest of South America
-
3. Europe
- 3.1. United Kingdom
- 3.2. Germany
- 3.3. France
- 3.4. Italy
- 3.5. Spain
- 3.6. Russia
- 3.7. Benelux
- 3.8. Nordics
- 3.9. Rest of Europe
-
4. Middle East & Africa
- 4.1. Turkey
- 4.2. Israel
- 4.3. GCC
- 4.4. North Africa
- 4.5. South Africa
- 4.6. Rest of Middle East & Africa
-
5. Asia Pacific
- 5.1. China
- 5.2. India
- 5.3. Japan
- 5.4. South Korea
- 5.5. ASEAN
- 5.6. Oceania
- 5.7. Rest of Asia Pacific
ROPP Composite Caps Regional Market Share
Geographic Coverage of ROPP Composite Caps
ROPP Composite Caps REPORT HIGHLIGHTS
| Aspects | Details |
|---|---|
| Study Period | 2020-2034 |
| Base Year | 2025 |
| Estimated Year | 2026 |
| Forecast Period | 2026-2034 |
| Historical Period | 2020-2025 |
| Growth Rate | CAGR of 5% from 2020-2034 |
| Segmentation |
|
Table of Contents
- 1. Introduction
- 1.1. Research Scope
- 1.2. Market Segmentation
- 1.3. Research Objective
- 1.4. Definitions and Assumptions
- 2. Executive Summary
- 2.1. Market Snapshot
- 3. Market Dynamics
- 3.1. Market Drivers
- 3.2. Market Restrains
- 3.3. Market Trends
- 3.4. Market Opportunities
- 4. Market Factor Analysis
- 4.1. Porters Five Forces
- 4.1.1. Bargaining Power of Suppliers
- 4.1.2. Bargaining Power of Buyers
- 4.1.3. Threat of New Entrants
- 4.1.4. Threat of Substitutes
- 4.1.5. Competitive Rivalry
- 4.2. PESTEL analysis
- 4.3. BCG Analysis
- 4.3.1. Stars (High Growth, High Market Share)
- 4.3.2. Cash Cows (Low Growth, High Market Share)
- 4.3.3. Question Mark (High Growth, Low Market Share)
- 4.3.4. Dogs (Low Growth, Low Market Share)
- 4.4. Ansoff Matrix Analysis
- 4.5. Supply Chain Analysis
- 4.6. Regulatory Landscape
- 4.7. Current Market Potential and Opportunity Assessment (TAM–SAM–SOM Framework)
- 4.8. PMV Analyst Note
- 4.1. Porters Five Forces
- 5. Market Analysis, Insights and Forecast 2021-2033
- 5.1. Market Analysis, Insights and Forecast - by Application
- 5.1.1. Chinese Baijiu
- 5.1.2. Wine
- 5.1.3. Medicinal Wine
- 5.1.4. Other
- 5.2. Market Analysis, Insights and Forecast - by Types
- 5.2.1. Plastic Type
- 5.2.2. Aluminium- Plastic Type
- 5.3. Market Analysis, Insights and Forecast - by Region
- 5.3.1. North America
- 5.3.2. South America
- 5.3.3. Europe
- 5.3.4. Middle East & Africa
- 5.3.5. Asia Pacific
- 5.1. Market Analysis, Insights and Forecast - by Application
- 6. Global ROPP Composite Caps Analysis, Insights and Forecast, 2021-2033
- 6.1. Market Analysis, Insights and Forecast - by Application
- 6.1.1. Chinese Baijiu
- 6.1.2. Wine
- 6.1.3. Medicinal Wine
- 6.1.4. Other
- 6.2. Market Analysis, Insights and Forecast - by Types
- 6.2.1. Plastic Type
- 6.2.2. Aluminium- Plastic Type
- 6.1. Market Analysis, Insights and Forecast - by Application
- 7. North America ROPP Composite Caps Analysis, Insights and Forecast, 2020-2032
- 7.1. Market Analysis, Insights and Forecast - by Application
- 7.1.1. Chinese Baijiu
- 7.1.2. Wine
- 7.1.3. Medicinal Wine
- 7.1.4. Other
- 7.2. Market Analysis, Insights and Forecast - by Types
- 7.2.1. Plastic Type
- 7.2.2. Aluminium- Plastic Type
- 7.1. Market Analysis, Insights and Forecast - by Application
- 8. South America ROPP Composite Caps Analysis, Insights and Forecast, 2020-2032
- 8.1. Market Analysis, Insights and Forecast - by Application
- 8.1.1. Chinese Baijiu
- 8.1.2. Wine
- 8.1.3. Medicinal Wine
- 8.1.4. Other
- 8.2. Market Analysis, Insights and Forecast - by Types
- 8.2.1. Plastic Type
- 8.2.2. Aluminium- Plastic Type
- 8.1. Market Analysis, Insights and Forecast - by Application
- 9. Europe ROPP Composite Caps Analysis, Insights and Forecast, 2020-2032
- 9.1. Market Analysis, Insights and Forecast - by Application
- 9.1.1. Chinese Baijiu
- 9.1.2. Wine
- 9.1.3. Medicinal Wine
- 9.1.4. Other
- 9.2. Market Analysis, Insights and Forecast - by Types
- 9.2.1. Plastic Type
- 9.2.2. Aluminium- Plastic Type
- 9.1. Market Analysis, Insights and Forecast - by Application
- 10. Middle East & Africa ROPP Composite Caps Analysis, Insights and Forecast, 2020-2032
- 10.1. Market Analysis, Insights and Forecast - by Application
- 10.1.1. Chinese Baijiu
- 10.1.2. Wine
- 10.1.3. Medicinal Wine
- 10.1.4. Other
- 10.2. Market Analysis, Insights and Forecast - by Types
- 10.2.1. Plastic Type
- 10.2.2. Aluminium- Plastic Type
- 10.1. Market Analysis, Insights and Forecast - by Application
- 11. Asia Pacific ROPP Composite Caps Analysis, Insights and Forecast, 2020-2032
- 11.1. Market Analysis, Insights and Forecast - by Application
- 11.1.1. Chinese Baijiu
- 11.1.2. Wine
- 11.1.3. Medicinal Wine
- 11.1.4. Other
- 11.2. Market Analysis, Insights and Forecast - by Types
- 11.2.1. Plastic Type
- 11.2.2. Aluminium- Plastic Type
- 11.1. Market Analysis, Insights and Forecast - by Application
- 12. Competitive Analysis
- 12.1. Company Profiles
- 12.1.1 Silgan Closures
- 12.1.1.1. Company Overview
- 12.1.1.2. Products
- 12.1.1.3. Company Financials
- 12.1.1.4. SWOT Analysis
- 12.1.2 Shandong Chiway Industry
- 12.1.2.1. Company Overview
- 12.1.2.2. Products
- 12.1.2.3. Company Financials
- 12.1.2.4. SWOT Analysis
- 12.1.3 Huafeng Pinggai
- 12.1.3.1. Company Overview
- 12.1.3.2. Products
- 12.1.3.3. Company Financials
- 12.1.3.4. SWOT Analysis
- 12.1.4 Seariver Closures
- 12.1.4.1. Company Overview
- 12.1.4.2. Products
- 12.1.4.3. Company Financials
- 12.1.4.4. SWOT Analysis
- 12.1.5 Anhui Baishijia Packaging
- 12.1.5.1. Company Overview
- 12.1.5.2. Products
- 12.1.5.3. Company Financials
- 12.1.5.4. SWOT Analysis
- 12.1.6 Lihua Bottle Cap
- 12.1.6.1. Company Overview
- 12.1.6.2. Products
- 12.1.6.3. Company Financials
- 12.1.6.4. SWOT Analysis
- 12.1.1 Silgan Closures
- 12.2. Market Entropy
- 12.2.1 Company's Key Areas Served
- 12.2.2 Recent Developments
- 12.3. Company Market Share Analysis 2025
- 12.3.1 Top 5 Companies Market Share Analysis
- 12.3.2 Top 3 Companies Market Share Analysis
- 12.4. List of Potential Customers
- 13. Research Methodology
List of Figures
- Figure 1: Global ROPP Composite Caps Revenue Breakdown (billion, %) by Region 2025 & 2033
- Figure 2: Global ROPP Composite Caps Volume Breakdown (K, %) by Region 2025 & 2033
- Figure 3: North America ROPP Composite Caps Revenue (billion), by Application 2025 & 2033
- Figure 4: North America ROPP Composite Caps Volume (K), by Application 2025 & 2033
- Figure 5: North America ROPP Composite Caps Revenue Share (%), by Application 2025 & 2033
- Figure 6: North America ROPP Composite Caps Volume Share (%), by Application 2025 & 2033
- Figure 7: North America ROPP Composite Caps Revenue (billion), by Types 2025 & 2033
- Figure 8: North America ROPP Composite Caps Volume (K), by Types 2025 & 2033
- Figure 9: North America ROPP Composite Caps Revenue Share (%), by Types 2025 & 2033
- Figure 10: North America ROPP Composite Caps Volume Share (%), by Types 2025 & 2033
- Figure 11: North America ROPP Composite Caps Revenue (billion), by Country 2025 & 2033
- Figure 12: North America ROPP Composite Caps Volume (K), by Country 2025 & 2033
- Figure 13: North America ROPP Composite Caps Revenue Share (%), by Country 2025 & 2033
- Figure 14: North America ROPP Composite Caps Volume Share (%), by Country 2025 & 2033
- Figure 15: South America ROPP Composite Caps Revenue (billion), by Application 2025 & 2033
- Figure 16: South America ROPP Composite Caps Volume (K), by Application 2025 & 2033
- Figure 17: South America ROPP Composite Caps Revenue Share (%), by Application 2025 & 2033
- Figure 18: South America ROPP Composite Caps Volume Share (%), by Application 2025 & 2033
- Figure 19: South America ROPP Composite Caps Revenue (billion), by Types 2025 & 2033
- Figure 20: South America ROPP Composite Caps Volume (K), by Types 2025 & 2033
- Figure 21: South America ROPP Composite Caps Revenue Share (%), by Types 2025 & 2033
- Figure 22: South America ROPP Composite Caps Volume Share (%), by Types 2025 & 2033
- Figure 23: South America ROPP Composite Caps Revenue (billion), by Country 2025 & 2033
- Figure 24: South America ROPP Composite Caps Volume (K), by Country 2025 & 2033
- Figure 25: South America ROPP Composite Caps Revenue Share (%), by Country 2025 & 2033
- Figure 26: South America ROPP Composite Caps Volume Share (%), by Country 2025 & 2033
- Figure 27: Europe ROPP Composite Caps Revenue (billion), by Application 2025 & 2033
- Figure 28: Europe ROPP Composite Caps Volume (K), by Application 2025 & 2033
- Figure 29: Europe ROPP Composite Caps Revenue Share (%), by Application 2025 & 2033
- Figure 30: Europe ROPP Composite Caps Volume Share (%), by Application 2025 & 2033
- Figure 31: Europe ROPP Composite Caps Revenue (billion), by Types 2025 & 2033
- Figure 32: Europe ROPP Composite Caps Volume (K), by Types 2025 & 2033
- Figure 33: Europe ROPP Composite Caps Revenue Share (%), by Types 2025 & 2033
- Figure 34: Europe ROPP Composite Caps Volume Share (%), by Types 2025 & 2033
- Figure 35: Europe ROPP Composite Caps Revenue (billion), by Country 2025 & 2033
- Figure 36: Europe ROPP Composite Caps Volume (K), by Country 2025 & 2033
- Figure 37: Europe ROPP Composite Caps Revenue Share (%), by Country 2025 & 2033
- Figure 38: Europe ROPP Composite Caps Volume Share (%), by Country 2025 & 2033
- Figure 39: Middle East & Africa ROPP Composite Caps Revenue (billion), by Application 2025 & 2033
- Figure 40: Middle East & Africa ROPP Composite Caps Volume (K), by Application 2025 & 2033
- Figure 41: Middle East & Africa ROPP Composite Caps Revenue Share (%), by Application 2025 & 2033
- Figure 42: Middle East & Africa ROPP Composite Caps Volume Share (%), by Application 2025 & 2033
- Figure 43: Middle East & Africa ROPP Composite Caps Revenue (billion), by Types 2025 & 2033
- Figure 44: Middle East & Africa ROPP Composite Caps Volume (K), by Types 2025 & 2033
- Figure 45: Middle East & Africa ROPP Composite Caps Revenue Share (%), by Types 2025 & 2033
- Figure 46: Middle East & Africa ROPP Composite Caps Volume Share (%), by Types 2025 & 2033
- Figure 47: Middle East & Africa ROPP Composite Caps Revenue (billion), by Country 2025 & 2033
- Figure 48: Middle East & Africa ROPP Composite Caps Volume (K), by Country 2025 & 2033
- Figure 49: Middle East & Africa ROPP Composite Caps Revenue Share (%), by Country 2025 & 2033
- Figure 50: Middle East & Africa ROPP Composite Caps Volume Share (%), by Country 2025 & 2033
- Figure 51: Asia Pacific ROPP Composite Caps Revenue (billion), by Application 2025 & 2033
- Figure 52: Asia Pacific ROPP Composite Caps Volume (K), by Application 2025 & 2033
- Figure 53: Asia Pacific ROPP Composite Caps Revenue Share (%), by Application 2025 & 2033
- Figure 54: Asia Pacific ROPP Composite Caps Volume Share (%), by Application 2025 & 2033
- Figure 55: Asia Pacific ROPP Composite Caps Revenue (billion), by Types 2025 & 2033
- Figure 56: Asia Pacific ROPP Composite Caps Volume (K), by Types 2025 & 2033
- Figure 57: Asia Pacific ROPP Composite Caps Revenue Share (%), by Types 2025 & 2033
- Figure 58: Asia Pacific ROPP Composite Caps Volume Share (%), by Types 2025 & 2033
- Figure 59: Asia Pacific ROPP Composite Caps Revenue (billion), by Country 2025 & 2033
- Figure 60: Asia Pacific ROPP Composite Caps Volume (K), by Country 2025 & 2033
- Figure 61: Asia Pacific ROPP Composite Caps Revenue Share (%), by Country 2025 & 2033
- Figure 62: Asia Pacific ROPP Composite Caps Volume Share (%), by Country 2025 & 2033
List of Tables
- Table 1: Global ROPP Composite Caps Revenue billion Forecast, by Application 2020 & 2033
- Table 2: Global ROPP Composite Caps Volume K Forecast, by Application 2020 & 2033
- Table 3: Global ROPP Composite Caps Revenue billion Forecast, by Types 2020 & 2033
- Table 4: Global ROPP Composite Caps Volume K Forecast, by Types 2020 & 2033
- Table 5: Global ROPP Composite Caps Revenue billion Forecast, by Region 2020 & 2033
- Table 6: Global ROPP Composite Caps Volume K Forecast, by Region 2020 & 2033
- Table 7: Global ROPP Composite Caps Revenue billion Forecast, by Application 2020 & 2033
- Table 8: Global ROPP Composite Caps Volume K Forecast, by Application 2020 & 2033
- Table 9: Global ROPP Composite Caps Revenue billion Forecast, by Types 2020 & 2033
- Table 10: Global ROPP Composite Caps Volume K Forecast, by Types 2020 & 2033
- Table 11: Global ROPP Composite Caps Revenue billion Forecast, by Country 2020 & 2033
- Table 12: Global ROPP Composite Caps Volume K Forecast, by Country 2020 & 2033
- Table 13: United States ROPP Composite Caps Revenue (billion) Forecast, by Application 2020 & 2033
- Table 14: United States ROPP Composite Caps Volume (K) Forecast, by Application 2020 & 2033
- Table 15: Canada ROPP Composite Caps Revenue (billion) Forecast, by Application 2020 & 2033
- Table 16: Canada ROPP Composite Caps Volume (K) Forecast, by Application 2020 & 2033
- Table 17: Mexico ROPP Composite Caps Revenue (billion) Forecast, by Application 2020 & 2033
- Table 18: Mexico ROPP Composite Caps Volume (K) Forecast, by Application 2020 & 2033
- Table 19: Global ROPP Composite Caps Revenue billion Forecast, by Application 2020 & 2033
- Table 20: Global ROPP Composite Caps Volume K Forecast, by Application 2020 & 2033
- Table 21: Global ROPP Composite Caps Revenue billion Forecast, by Types 2020 & 2033
- Table 22: Global ROPP Composite Caps Volume K Forecast, by Types 2020 & 2033
- Table 23: Global ROPP Composite Caps Revenue billion Forecast, by Country 2020 & 2033
- Table 24: Global ROPP Composite Caps Volume K Forecast, by Country 2020 & 2033
- Table 25: Brazil ROPP Composite Caps Revenue (billion) Forecast, by Application 2020 & 2033
- Table 26: Brazil ROPP Composite Caps Volume (K) Forecast, by Application 2020 & 2033
- Table 27: Argentina ROPP Composite Caps Revenue (billion) Forecast, by Application 2020 & 2033
- Table 28: Argentina ROPP Composite Caps Volume (K) Forecast, by Application 2020 & 2033
- Table 29: Rest of South America ROPP Composite Caps Revenue (billion) Forecast, by Application 2020 & 2033
- Table 30: Rest of South America ROPP Composite Caps Volume (K) Forecast, by Application 2020 & 2033
- Table 31: Global ROPP Composite Caps Revenue billion Forecast, by Application 2020 & 2033
- Table 32: Global ROPP Composite Caps Volume K Forecast, by Application 2020 & 2033
- Table 33: Global ROPP Composite Caps Revenue billion Forecast, by Types 2020 & 2033
- Table 34: Global ROPP Composite Caps Volume K Forecast, by Types 2020 & 2033
- Table 35: Global ROPP Composite Caps Revenue billion Forecast, by Country 2020 & 2033
- Table 36: Global ROPP Composite Caps Volume K Forecast, by Country 2020 & 2033
- Table 37: United Kingdom ROPP Composite Caps Revenue (billion) Forecast, by Application 2020 & 2033
- Table 38: United Kingdom ROPP Composite Caps Volume (K) Forecast, by Application 2020 & 2033
- Table 39: Germany ROPP Composite Caps Revenue (billion) Forecast, by Application 2020 & 2033
- Table 40: Germany ROPP Composite Caps Volume (K) Forecast, by Application 2020 & 2033
- Table 41: France ROPP Composite Caps Revenue (billion) Forecast, by Application 2020 & 2033
- Table 42: France ROPP Composite Caps Volume (K) Forecast, by Application 2020 & 2033
- Table 43: Italy ROPP Composite Caps Revenue (billion) Forecast, by Application 2020 & 2033
- Table 44: Italy ROPP Composite Caps Volume (K) Forecast, by Application 2020 & 2033
- Table 45: Spain ROPP Composite Caps Revenue (billion) Forecast, by Application 2020 & 2033
- Table 46: Spain ROPP Composite Caps Volume (K) Forecast, by Application 2020 & 2033
- Table 47: Russia ROPP Composite Caps Revenue (billion) Forecast, by Application 2020 & 2033
- Table 48: Russia ROPP Composite Caps Volume (K) Forecast, by Application 2020 & 2033
- Table 49: Benelux ROPP Composite Caps Revenue (billion) Forecast, by Application 2020 & 2033
- Table 50: Benelux ROPP Composite Caps Volume (K) Forecast, by Application 2020 & 2033
- Table 51: Nordics ROPP Composite Caps Revenue (billion) Forecast, by Application 2020 & 2033
- Table 52: Nordics ROPP Composite Caps Volume (K) Forecast, by Application 2020 & 2033
- Table 53: Rest of Europe ROPP Composite Caps Revenue (billion) Forecast, by Application 2020 & 2033
- Table 54: Rest of Europe ROPP Composite Caps Volume (K) Forecast, by Application 2020 & 2033
- Table 55: Global ROPP Composite Caps Revenue billion Forecast, by Application 2020 & 2033
- Table 56: Global ROPP Composite Caps Volume K Forecast, by Application 2020 & 2033
- Table 57: Global ROPP Composite Caps Revenue billion Forecast, by Types 2020 & 2033
- Table 58: Global ROPP Composite Caps Volume K Forecast, by Types 2020 & 2033
- Table 59: Global ROPP Composite Caps Revenue billion Forecast, by Country 2020 & 2033
- Table 60: Global ROPP Composite Caps Volume K Forecast, by Country 2020 & 2033
- Table 61: Turkey ROPP Composite Caps Revenue (billion) Forecast, by Application 2020 & 2033
- Table 62: Turkey ROPP Composite Caps Volume (K) Forecast, by Application 2020 & 2033
- Table 63: Israel ROPP Composite Caps Revenue (billion) Forecast, by Application 2020 & 2033
- Table 64: Israel ROPP Composite Caps Volume (K) Forecast, by Application 2020 & 2033
- Table 65: GCC ROPP Composite Caps Revenue (billion) Forecast, by Application 2020 & 2033
- Table 66: GCC ROPP Composite Caps Volume (K) Forecast, by Application 2020 & 2033
- Table 67: North Africa ROPP Composite Caps Revenue (billion) Forecast, by Application 2020 & 2033
- Table 68: North Africa ROPP Composite Caps Volume (K) Forecast, by Application 2020 & 2033
- Table 69: South Africa ROPP Composite Caps Revenue (billion) Forecast, by Application 2020 & 2033
- Table 70: South Africa ROPP Composite Caps Volume (K) Forecast, by Application 2020 & 2033
- Table 71: Rest of Middle East & Africa ROPP Composite Caps Revenue (billion) Forecast, by Application 2020 & 2033
- Table 72: Rest of Middle East & Africa ROPP Composite Caps Volume (K) Forecast, by Application 2020 & 2033
- Table 73: Global ROPP Composite Caps Revenue billion Forecast, by Application 2020 & 2033
- Table 74: Global ROPP Composite Caps Volume K Forecast, by Application 2020 & 2033
- Table 75: Global ROPP Composite Caps Revenue billion Forecast, by Types 2020 & 2033
- Table 76: Global ROPP Composite Caps Volume K Forecast, by Types 2020 & 2033
- Table 77: Global ROPP Composite Caps Revenue billion Forecast, by Country 2020 & 2033
- Table 78: Global ROPP Composite Caps Volume K Forecast, by Country 2020 & 2033
- Table 79: China ROPP Composite Caps Revenue (billion) Forecast, by Application 2020 & 2033
- Table 80: China ROPP Composite Caps Volume (K) Forecast, by Application 2020 & 2033
- Table 81: India ROPP Composite Caps Revenue (billion) Forecast, by Application 2020 & 2033
- Table 82: India ROPP Composite Caps Volume (K) Forecast, by Application 2020 & 2033
- Table 83: Japan ROPP Composite Caps Revenue (billion) Forecast, by Application 2020 & 2033
- Table 84: Japan ROPP Composite Caps Volume (K) Forecast, by Application 2020 & 2033
- Table 85: South Korea ROPP Composite Caps Revenue (billion) Forecast, by Application 2020 & 2033
- Table 86: South Korea ROPP Composite Caps Volume (K) Forecast, by Application 2020 & 2033
- Table 87: ASEAN ROPP Composite Caps Revenue (billion) Forecast, by Application 2020 & 2033
- Table 88: ASEAN ROPP Composite Caps Volume (K) Forecast, by Application 2020 & 2033
- Table 89: Oceania ROPP Composite Caps Revenue (billion) Forecast, by Application 2020 & 2033
- Table 90: Oceania ROPP Composite Caps Volume (K) Forecast, by Application 2020 & 2033
- Table 91: Rest of Asia Pacific ROPP Composite Caps Revenue (billion) Forecast, by Application 2020 & 2033
- Table 92: Rest of Asia Pacific ROPP Composite Caps Volume (K) Forecast, by Application 2020 & 2033
Frequently Asked Questions
1. What is the projected Compound Annual Growth Rate (CAGR) of the ROPP Composite Caps?
The projected CAGR is approximately 5%.
2. Which companies are prominent players in the ROPP Composite Caps?
Key companies in the market include Silgan Closures, Shandong Chiway Industry, Huafeng Pinggai, Seariver Closures, Anhui Baishijia Packaging, Lihua Bottle Cap.
3. What are the main segments of the ROPP Composite Caps?
The market segments include Application, Types.
4. Can you provide details about the market size?
The market size is estimated to be USD 1.5 billion as of 2022.
5. What are some drivers contributing to market growth?
N/A
6. What are the notable trends driving market growth?
N/A
7. Are there any restraints impacting market growth?
N/A
8. Can you provide examples of recent developments in the market?
N/A
9. What pricing options are available for accessing the report?
Pricing options include single-user, multi-user, and enterprise licenses priced at USD 3950.00, USD 5925.00, and USD 7900.00 respectively.
10. Is the market size provided in terms of value or volume?
The market size is provided in terms of value, measured in billion and volume, measured in K.
11. Are there any specific market keywords associated with the report?
Yes, the market keyword associated with the report is "ROPP Composite Caps," which aids in identifying and referencing the specific market segment covered.
12. How do I determine which pricing option suits my needs best?
The pricing options vary based on user requirements and access needs. Individual users may opt for single-user licenses, while businesses requiring broader access may choose multi-user or enterprise licenses for cost-effective access to the report.
13. Are there any additional resources or data provided in the ROPP Composite Caps report?
While the report offers comprehensive insights, it's advisable to review the specific contents or supplementary materials provided to ascertain if additional resources or data are available.
14. How can I stay updated on further developments or reports in the ROPP Composite Caps?
To stay informed about further developments, trends, and reports in the ROPP Composite Caps, consider subscribing to industry newsletters, following relevant companies and organizations, or regularly checking reputable industry news sources and publications.
Methodology
Step 1 - Identification of Relevant Samples Size from Population Database


Step 2 - Approaches for Defining Global Market Size (Value, Volume* & Price*)

Note*: In applicable scenarios
Step 3 - Data Sources
Primary Research
- Web Analytics
- Survey Reports
- Research Institute
- Latest Research Reports
- Opinion Leaders
Secondary Research
- Annual Reports
- White Paper
- Latest Press Release
- Industry Association
- Paid Database
- Investor Presentations

Step 4 - Data Triangulation
Involves using different sources of information in order to increase the validity of a study
These sources are likely to be stakeholders in a program - participants, other researchers, program staff, other community members, and so on.
Then we put all data in single framework & apply various statistical tools to find out the dynamic on the market.
During the analysis stage, feedback from the stakeholder groups would be compared to determine areas of agreement as well as areas of divergence