

Key Insights
The global rigid packaging containers market is projected for significant expansion, with an estimated market size of 220.2 billion by 2025. This growth is fueled by increasing consumer preference for premium, durable, and visually appealing packaging across diverse industries. The Food & Beverage sector remains a primary driver, supported by the demand for convenience foods, ready-to-eat options, and premium beverages. Pharmaceutical packaging also demonstrates robust growth, driven by the necessity for secure, sterile, and tamper-evident solutions. The Cosmetics & Personal Care industry is another key contributor, emphasizing sophisticated and sustainable packaging to enhance brand appeal and consumer experience. The market is anticipated to achieve a Compound Annual Growth Rate (CAGR) of approximately 3.6% from 2025 to 2033.
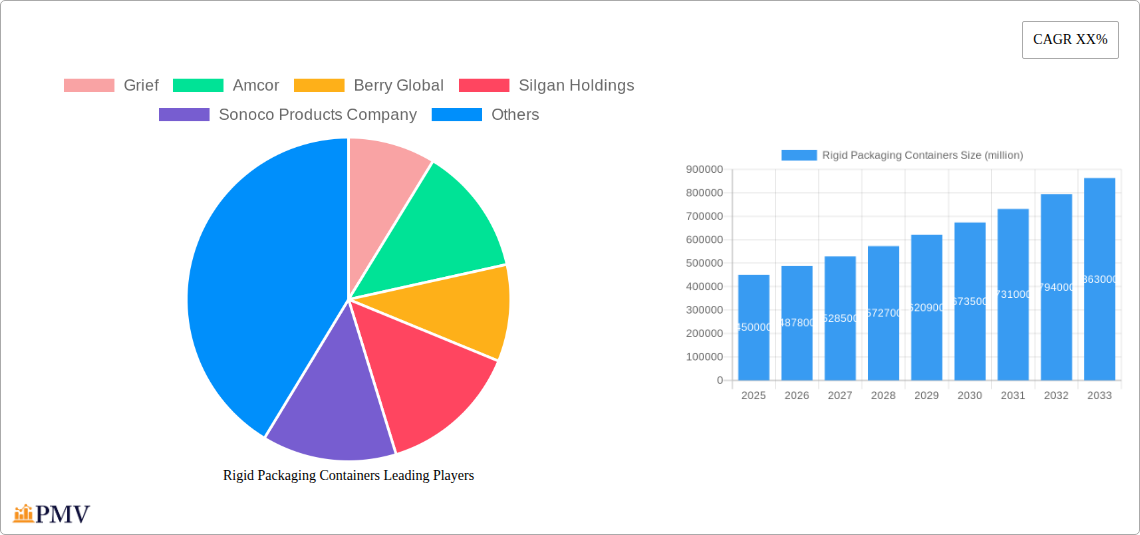
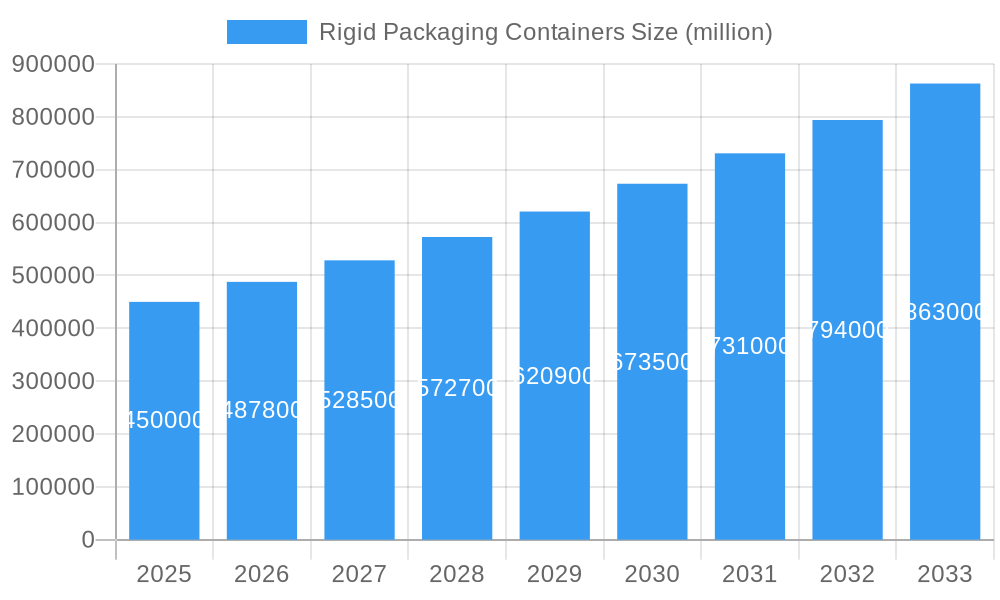
Rigid Packaging Containers Market Size (In Billion)
Key trends influencing the rigid packaging market include a strong focus on sustainability, with a rising adoption of recyclable, reusable, and biodegradable materials. This encourages manufacturers to invest in innovative material science, exploring alternatives such as advanced bioplastics and eco-friendly composites. Advancements in manufacturing technologies, including high-speed filling and sealing, also contribute to market growth by enhancing efficiency and reducing operational costs. Market restraints include volatility in raw material prices, particularly for plastics and metals, which can affect profitability. Stringent regulatory frameworks governing packaging safety and environmental impact also present challenges. Despite these factors, sustained market growth is expected, with the Asia Pacific region anticipated to lead expansion due to rapid industrialization and a growing middle-class consumer base.
Rigid Packaging Containers Company Market Share
This comprehensive market research report offers an in-depth analysis of the global Rigid Packaging Containers market, detailing its structure, key trends, dominant segments, product innovations, and competitive landscape. Covering the historical period from 2019 to 2024, with 2025 as the base year, and a forecast period extending to 2033, this report is essential for stakeholders seeking to understand market dynamics, identify growth opportunities, and adapt to the evolving demands for high-quality rigid packaging solutions. We forecast the global Rigid Packaging Containers market to reach a significant value of 220.2 billion by 2025, with an expected Compound Annual Growth Rate (CAGR) of 3.6% from 2025 to 2033.
Rigid Packaging Containers Market Structure & Competitive Dynamics
The global Rigid Packaging Containers market is characterized by a moderate to high level of concentration, with key players like Amcor, Berry Global, Silgan Holdings, Sonoco Products Company, and Mauser Packaging Solutions holding substantial market share. Innovation ecosystems are vibrant, driven by advancements in material science, sustainable packaging solutions, and smart packaging technologies. Regulatory frameworks, particularly concerning food safety, pharmaceutical integrity, and environmental sustainability, play a crucial role in shaping product development and market entry strategies. Product substitutes, such as flexible packaging and biodegradable alternatives, present ongoing competitive pressure. End-user trends are heavily influenced by consumer demand for convenience, product protection, and eco-friendly packaging. Mergers and acquisitions (M&A) activities are a significant aspect of market dynamics, with recent deals valued in the millions of dollars aimed at expanding geographical reach, enhancing product portfolios, and achieving economies of scale.
- Market Share Dynamics: Leading companies are continuously vying for market dominance through strategic investments and product differentiation.
- Innovation Ecosystems: Collaborations between packaging manufacturers and material suppliers are fostering breakthroughs in recyclable and compostable rigid packaging.
- Regulatory Impact: Stringent regulations are driving the demand for compliant and traceable packaging solutions, particularly in pharmaceutical and food applications.
- Competitive Pressures: The threat of substitutes necessitates continuous innovation and cost optimization.
- M&A Activity: Strategic acquisitions are a key growth lever for major players seeking to consolidate their market position and access new technologies. Recent M&A deals have collectively amounted to several hundred million dollars.
Rigid Packaging Containers Industry Trends & Insights
The Rigid Packaging Containers industry is experiencing dynamic growth, propelled by several key trends and insights. A primary growth driver is the escalating demand for premium and safe packaging across the Food & Beverage, Pharmaceutical, and Cosmetics & Personal Care sectors. Consumers are increasingly prioritizing product integrity, shelf-life extension, and user experience, making robust rigid packaging indispensable. Technological disruptions are reshaping the industry, with innovations in lightweighting, advanced barrier properties, and tamper-evident features enhancing product protection and reducing material usage. The rise of e-commerce has also created a surge in demand for durable and resilient packaging solutions capable of withstanding the rigors of shipping. Consumer preferences are shifting towards sustainable and recyclable packaging options, prompting manufacturers to invest heavily in eco-friendly materials and circular economy initiatives. Competitive dynamics are intense, with companies focusing on operational efficiency, supply chain optimization, and the development of specialized packaging for niche applications. The market penetration of innovative rigid packaging solutions is expected to rise significantly, driven by both regulatory mandates and growing consumer awareness regarding environmental impact. The overall CAGR for the rigid packaging containers market is projected to be xx% during the forecast period.
- Sustainability Push: The industry is witnessing a significant shift towards recyclable, reusable, and biodegradable rigid packaging materials, driven by consumer demand and regulatory pressures.
- E-commerce Boom: The exponential growth of online retail necessitates the development of highly durable and protective rigid packaging to minimize transit damage.
- Smart Packaging Integration: The adoption of smart packaging technologies, such as QR codes and RFID tags, is gaining traction for enhanced traceability and consumer engagement.
- Material Innovation: Ongoing research and development in plastics, metals, and paperboard are leading to the creation of lighter, stronger, and more sustainable packaging options.
- Health and Safety Concerns: Increased focus on hygiene and product safety, especially post-pandemic, is bolstering demand for sterile and tamper-proof rigid packaging in pharmaceutical and food applications.
Dominant Markets & Segments in Rigid Packaging Containers
The Food & Beverage segment is a dominant force in the global Rigid Packaging Containers market, driven by an insatiable consumer demand for packaged foods, beverages, and dairy products. The inherent need for product preservation, extended shelf-life, and convenient single-serving options fuels this segment's growth. Key drivers include expanding middle-class populations in emerging economies, a growing preference for ready-to-eat meals, and the proliferation of premium and artisanal food products. Within the Food & Beverage segment, plastic materials, particularly PET and PP, hold significant dominance due to their versatility, cost-effectiveness, and excellent barrier properties. However, the increasing focus on sustainability is also driving innovation in paper and paperboard-based rigid packaging solutions. The Pharmaceutical segment is another critical and rapidly growing area, characterized by stringent regulatory requirements for product safety, sterility, and tamper-evidence. The increasing global healthcare expenditure, an aging population, and the growing prevalence of chronic diseases contribute to the sustained demand for high-quality pharmaceutical rigid packaging, such as bottles, vials, and blister packs. The Cosmetics & Personal Care segment also exhibits strong growth, influenced by consumer trends towards premiumization, natural ingredients, and aesthetically pleasing packaging.
- Food & Beverage Dominance: This segment accounts for over 40% of the global rigid packaging market by volume, driven by factors like urbanization and evolving consumer lifestyles. Economic policies supporting food security and agricultural exports further bolster this segment.
- Pharmaceutical Sector Growth: Driven by an aging population and advancements in healthcare, this segment is expected to witness a CAGR of xx% from 2025-2033. Regulatory frameworks like FDA and EMA mandates are crucial.
- Cosmetics & Personal Care Appeal: Premiumization trends and a focus on visually appealing packaging make this a high-value segment, with market penetration of innovative designs accelerating.
- Plastic Material Leadership: PET and PP dominate due to their balance of cost, performance, and recyclability. Infrastructure for plastic recycling is a key enabler.
- Emerging Markets Potential: Rapid economic development and rising disposable incomes in regions like Asia-Pacific and Latin America are creating significant demand for rigid packaging across all applications.
Rigid Packaging Containers Product Innovations
Product innovations in the Rigid Packaging Containers sector are primarily focused on enhancing sustainability, functionality, and consumer convenience. Developments include the introduction of bio-based and compostable rigid plastics, advanced barrier coatings for extended shelf-life in food and beverage applications, and lightweighted metal and glass containers. Smart packaging features, such as integrated sensors and NFC tags, are also emerging, offering improved traceability and consumer engagement. These innovations provide competitive advantages by meeting evolving consumer preferences for eco-friendly options and delivering superior product protection and user experience.
Report Segmentation & Scope
This report segments the Rigid Packaging Containers market by Application into Food & Beverage, Pharmaceutical, Cosmetics & Personal Care, Homecare, Automotive, Chemicals, and Other. By Type, the segmentation includes Plastic Material, Metal Material, Glass Material, and Paper & Paperboard Material. Each segment is analyzed for market size, growth projections, and competitive dynamics. For instance, the Food & Beverage segment is projected to grow at a CAGR of xx% and represent a market size of over one million by 2025. The Pharmaceutical segment is anticipated to grow at a CAGR of xx% driven by stringent regulatory requirements.
- Food & Beverage: Projected market size of over one million by 2025 with a CAGR of xx%.
- Pharmaceutical: CAGR of xx% due to increasing healthcare demands and regulatory compliance needs.
- Cosmetics & Personal Care: Growth driven by premiumization and innovative designs.
- Plastic Material: Dominant segment with ongoing innovation in sustainable alternatives.
- Paper & Paperboard Material: Experiencing significant growth due to environmental consciousness.
Key Drivers of Rigid Packaging Containers Growth
The growth of the Rigid Packaging Containers market is propelled by a confluence of factors. Technological advancements in material science and manufacturing processes are enabling the creation of more sustainable, durable, and cost-effective packaging solutions. The increasing global demand for packaged goods across sectors like food, beverage, and pharmaceuticals, driven by population growth and urbanization, is a fundamental growth driver. Evolving consumer preferences, particularly a growing demand for convenience, product safety, and eco-friendly packaging, are compelling manufacturers to innovate. Furthermore, supportive government regulations aimed at ensuring product safety and promoting recyclability are creating a favorable market environment.
- Consumer Demand: Rising disposable incomes and changing lifestyles are increasing the consumption of packaged goods.
- Technological Advancements: Innovations in materials and manufacturing reduce costs and improve performance.
- Regulatory Support: Mandates for product safety and recyclability encourage adoption of advanced packaging.
- E-commerce Growth: The online retail boom necessitates robust and protective packaging.
Challenges in the Rigid Packaging Containers Sector
Despite robust growth, the Rigid Packaging Containers sector faces several challenges. Fluctuations in raw material prices, particularly for plastics and metals, can impact profitability and necessitate price adjustments. Intense competition among manufacturers, coupled with the threat of substitute packaging solutions, requires continuous innovation and cost optimization. Stringent regulatory frameworks, while driving innovation, can also lead to increased compliance costs and longer product development cycles. Supply chain disruptions, as experienced in recent years, can affect material availability and lead times, posing risks to production schedules.
- Raw Material Price Volatility: Fluctuations in prices of plastics, metals, and paper can affect cost structures.
- Intensified Competition: A highly competitive landscape necessitates constant innovation and efficiency.
- Regulatory Hurdles: Evolving environmental and safety regulations can increase compliance costs.
- Supply Chain Disruptions: Global events can impact the availability and cost of raw materials.
Leading Players in the Rigid Packaging Containers Market
- Grief
- Amcor
- Berry Global
- Silgan Holdings
- Sonoco Products Company
- Mauser Packaging Solutions
- Ball Corporation
- Pactiv LLC
- SCHÜTZ GmbH
- Winpak
- WestRock
- Sabert
- International Paper
- Fabri-Kal Corporation
- Georgia-Pacific
- Smurfit Kappa Group
- Crown Holdings
- DS Smith
- Schoeller Allibert Services
- Huhtamaki Oyj
Key Developments in Rigid Packaging Containers Sector
- 2023: Amcor launched a new range of mono-material PET bottles for carbonated soft drinks, enhancing recyclability.
- 2023: Berry Global expanded its sustainable packaging portfolio with advanced recycled plastic containers.
- 2022: Sonoco Products Company acquired a leading producer of rigid paperboard containers, strengthening its market position.
- 2022: Silgan Holdings announced strategic investments in expanding its metal container production capacity.
- 2021: Mauser Packaging Solutions introduced innovative lightweight IBCs for chemical transportation.
- 2021: Ball Corporation continued to lead in aluminum beverage can innovation with enhanced designs for sustainability.
- 2020: Pactiv LLC focused on developing compostable rigid packaging solutions for the food service industry.
- 2020: SCHÜTZ GmbH invested in advanced manufacturing technologies for its industrial packaging solutions.
Strategic Rigid Packaging Containers Market Outlook
The strategic outlook for the Rigid Packaging Containers market remains exceptionally positive. Growth will be accelerated by the persistent demand for safe, reliable, and convenient packaging solutions across diverse industries, coupled with an intensifying global focus on sustainability and circular economy principles. Opportunities lie in the continued development of advanced materials, including those derived from renewable resources and designed for enhanced recyclability. The expansion of e-commerce and the increasing sophistication of consumer expectations will further drive the need for innovative and protective rigid packaging. Strategic investments in R&D, coupled with a focus on operational efficiency and sustainable practices, will be crucial for market leaders to capitalize on the significant future growth potential.
Rigid Packaging Containers Segmentation
-
1. Application
- 1.1. Food & Beverage
- 1.2. Pharmaceutical
- 1.3. Cosmetics & Personal Care
- 1.4. Homecare
- 1.5. Automotive
- 1.6. Chemicals
- 1.7. Other
-
2. Types
- 2.1. Plastic Material
- 2.2. Metal Material
- 2.3. Glass Material
- 2.4. Paper & Paperboard Material
Rigid Packaging Containers Segmentation By Geography
-
1. North America
- 1.1. United States
- 1.2. Canada
- 1.3. Mexico
-
2. South America
- 2.1. Brazil
- 2.2. Argentina
- 2.3. Rest of South America
-
3. Europe
- 3.1. United Kingdom
- 3.2. Germany
- 3.3. France
- 3.4. Italy
- 3.5. Spain
- 3.6. Russia
- 3.7. Benelux
- 3.8. Nordics
- 3.9. Rest of Europe
-
4. Middle East & Africa
- 4.1. Turkey
- 4.2. Israel
- 4.3. GCC
- 4.4. North Africa
- 4.5. South Africa
- 4.6. Rest of Middle East & Africa
-
5. Asia Pacific
- 5.1. China
- 5.2. India
- 5.3. Japan
- 5.4. South Korea
- 5.5. ASEAN
- 5.6. Oceania
- 5.7. Rest of Asia Pacific
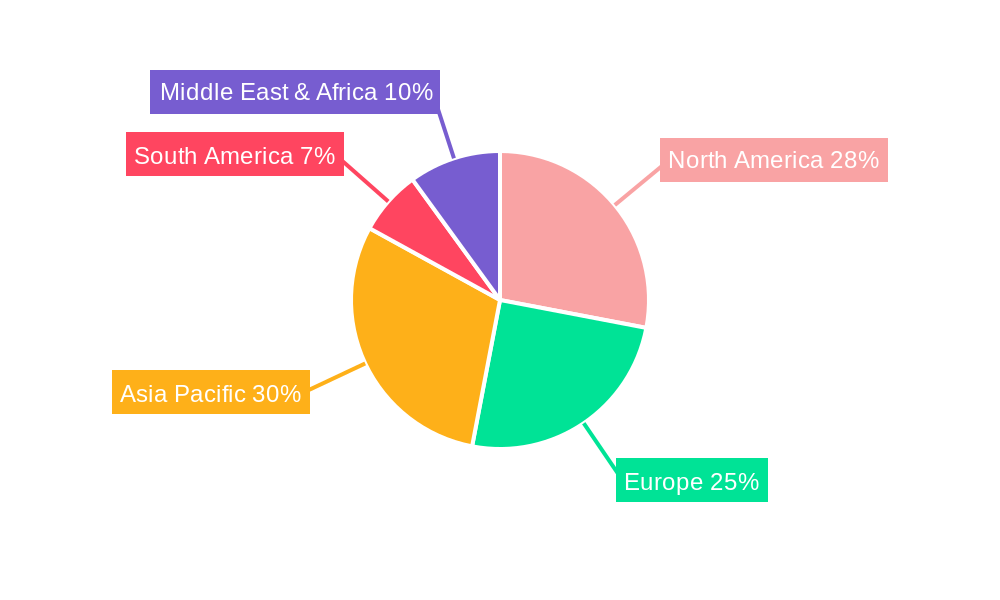
Rigid Packaging Containers Regional Market Share
Geographic Coverage of Rigid Packaging Containers
Rigid Packaging Containers REPORT HIGHLIGHTS
| Aspects | Details |
|---|---|
| Study Period | 2020-2034 |
| Base Year | 2025 |
| Estimated Year | 2026 |
| Forecast Period | 2026-2034 |
| Historical Period | 2020-2025 |
| Growth Rate | CAGR of 3.6% from 2020-2034 |
| Segmentation |
|
Table of Contents
- 1. Introduction
- 1.1. Research Scope
- 1.2. Market Segmentation
- 1.3. Research Objective
- 1.4. Definitions and Assumptions
- 2. Executive Summary
- 2.1. Market Snapshot
- 3. Market Dynamics
- 3.1. Market Drivers
- 3.2. Market Restrains
- 3.3. Market Trends
- 3.4. Market Opportunities
- 4. Market Factor Analysis
- 4.1. Porters Five Forces
- 4.1.1. Bargaining Power of Suppliers
- 4.1.2. Bargaining Power of Buyers
- 4.1.3. Threat of New Entrants
- 4.1.4. Threat of Substitutes
- 4.1.5. Competitive Rivalry
- 4.2. PESTEL analysis
- 4.3. BCG Analysis
- 4.3.1. Stars (High Growth, High Market Share)
- 4.3.2. Cash Cows (Low Growth, High Market Share)
- 4.3.3. Question Mark (High Growth, Low Market Share)
- 4.3.4. Dogs (Low Growth, Low Market Share)
- 4.4. Ansoff Matrix Analysis
- 4.5. Supply Chain Analysis
- 4.6. Regulatory Landscape
- 4.7. Current Market Potential and Opportunity Assessment (TAM–SAM–SOM Framework)
- 4.8. PMV Analyst Note
- 4.1. Porters Five Forces
- 5. Market Analysis, Insights and Forecast 2021-2033
- 5.1. Market Analysis, Insights and Forecast - by Application
- 5.1.1. Food & Beverage
- 5.1.2. Pharmaceutical
- 5.1.3. Cosmetics & Personal Care
- 5.1.4. Homecare
- 5.1.5. Automotive
- 5.1.6. Chemicals
- 5.1.7. Other
- 5.2. Market Analysis, Insights and Forecast - by Types
- 5.2.1. Plastic Material
- 5.2.2. Metal Material
- 5.2.3. Glass Material
- 5.2.4. Paper & Paperboard Material
- 5.3. Market Analysis, Insights and Forecast - by Region
- 5.3.1. North America
- 5.3.2. South America
- 5.3.3. Europe
- 5.3.4. Middle East & Africa
- 5.3.5. Asia Pacific
- 5.1. Market Analysis, Insights and Forecast - by Application
- 6. Global Rigid Packaging Containers Analysis, Insights and Forecast, 2021-2033
- 6.1. Market Analysis, Insights and Forecast - by Application
- 6.1.1. Food & Beverage
- 6.1.2. Pharmaceutical
- 6.1.3. Cosmetics & Personal Care
- 6.1.4. Homecare
- 6.1.5. Automotive
- 6.1.6. Chemicals
- 6.1.7. Other
- 6.2. Market Analysis, Insights and Forecast - by Types
- 6.2.1. Plastic Material
- 6.2.2. Metal Material
- 6.2.3. Glass Material
- 6.2.4. Paper & Paperboard Material
- 6.1. Market Analysis, Insights and Forecast - by Application
- 7. North America Rigid Packaging Containers Analysis, Insights and Forecast, 2020-2032
- 7.1. Market Analysis, Insights and Forecast - by Application
- 7.1.1. Food & Beverage
- 7.1.2. Pharmaceutical
- 7.1.3. Cosmetics & Personal Care
- 7.1.4. Homecare
- 7.1.5. Automotive
- 7.1.6. Chemicals
- 7.1.7. Other
- 7.2. Market Analysis, Insights and Forecast - by Types
- 7.2.1. Plastic Material
- 7.2.2. Metal Material
- 7.2.3. Glass Material
- 7.2.4. Paper & Paperboard Material
- 7.1. Market Analysis, Insights and Forecast - by Application
- 8. South America Rigid Packaging Containers Analysis, Insights and Forecast, 2020-2032
- 8.1. Market Analysis, Insights and Forecast - by Application
- 8.1.1. Food & Beverage
- 8.1.2. Pharmaceutical
- 8.1.3. Cosmetics & Personal Care
- 8.1.4. Homecare
- 8.1.5. Automotive
- 8.1.6. Chemicals
- 8.1.7. Other
- 8.2. Market Analysis, Insights and Forecast - by Types
- 8.2.1. Plastic Material
- 8.2.2. Metal Material
- 8.2.3. Glass Material
- 8.2.4. Paper & Paperboard Material
- 8.1. Market Analysis, Insights and Forecast - by Application
- 9. Europe Rigid Packaging Containers Analysis, Insights and Forecast, 2020-2032
- 9.1. Market Analysis, Insights and Forecast - by Application
- 9.1.1. Food & Beverage
- 9.1.2. Pharmaceutical
- 9.1.3. Cosmetics & Personal Care
- 9.1.4. Homecare
- 9.1.5. Automotive
- 9.1.6. Chemicals
- 9.1.7. Other
- 9.2. Market Analysis, Insights and Forecast - by Types
- 9.2.1. Plastic Material
- 9.2.2. Metal Material
- 9.2.3. Glass Material
- 9.2.4. Paper & Paperboard Material
- 9.1. Market Analysis, Insights and Forecast - by Application
- 10. Middle East & Africa Rigid Packaging Containers Analysis, Insights and Forecast, 2020-2032
- 10.1. Market Analysis, Insights and Forecast - by Application
- 10.1.1. Food & Beverage
- 10.1.2. Pharmaceutical
- 10.1.3. Cosmetics & Personal Care
- 10.1.4. Homecare
- 10.1.5. Automotive
- 10.1.6. Chemicals
- 10.1.7. Other
- 10.2. Market Analysis, Insights and Forecast - by Types
- 10.2.1. Plastic Material
- 10.2.2. Metal Material
- 10.2.3. Glass Material
- 10.2.4. Paper & Paperboard Material
- 10.1. Market Analysis, Insights and Forecast - by Application
- 11. Asia Pacific Rigid Packaging Containers Analysis, Insights and Forecast, 2020-2032
- 11.1. Market Analysis, Insights and Forecast - by Application
- 11.1.1. Food & Beverage
- 11.1.2. Pharmaceutical
- 11.1.3. Cosmetics & Personal Care
- 11.1.4. Homecare
- 11.1.5. Automotive
- 11.1.6. Chemicals
- 11.1.7. Other
- 11.2. Market Analysis, Insights and Forecast - by Types
- 11.2.1. Plastic Material
- 11.2.2. Metal Material
- 11.2.3. Glass Material
- 11.2.4. Paper & Paperboard Material
- 11.1. Market Analysis, Insights and Forecast - by Application
- 12. Competitive Analysis
- 12.1. Company Profiles
- 12.1.1 Grief
- 12.1.1.1. Company Overview
- 12.1.1.2. Products
- 12.1.1.3. Company Financials
- 12.1.1.4. SWOT Analysis
- 12.1.2 Amcor
- 12.1.2.1. Company Overview
- 12.1.2.2. Products
- 12.1.2.3. Company Financials
- 12.1.2.4. SWOT Analysis
- 12.1.3 Berry Global
- 12.1.3.1. Company Overview
- 12.1.3.2. Products
- 12.1.3.3. Company Financials
- 12.1.3.4. SWOT Analysis
- 12.1.4 Silgan Holdings
- 12.1.4.1. Company Overview
- 12.1.4.2. Products
- 12.1.4.3. Company Financials
- 12.1.4.4. SWOT Analysis
- 12.1.5 Sonoco Products Company
- 12.1.5.1. Company Overview
- 12.1.5.2. Products
- 12.1.5.3. Company Financials
- 12.1.5.4. SWOT Analysis
- 12.1.6 Mauser Packaging Solutions
- 12.1.6.1. Company Overview
- 12.1.6.2. Products
- 12.1.6.3. Company Financials
- 12.1.6.4. SWOT Analysis
- 12.1.7 Ball Corporation
- 12.1.7.1. Company Overview
- 12.1.7.2. Products
- 12.1.7.3. Company Financials
- 12.1.7.4. SWOT Analysis
- 12.1.8 Pactiv LLC
- 12.1.8.1. Company Overview
- 12.1.8.2. Products
- 12.1.8.3. Company Financials
- 12.1.8.4. SWOT Analysis
- 12.1.9 SCHÜTZ GmbH
- 12.1.9.1. Company Overview
- 12.1.9.2. Products
- 12.1.9.3. Company Financials
- 12.1.9.4. SWOT Analysis
- 12.1.10 Winpak
- 12.1.10.1. Company Overview
- 12.1.10.2. Products
- 12.1.10.3. Company Financials
- 12.1.10.4. SWOT Analysis
- 12.1.11 WestRock
- 12.1.11.1. Company Overview
- 12.1.11.2. Products
- 12.1.11.3. Company Financials
- 12.1.11.4. SWOT Analysis
- 12.1.12 Sabert
- 12.1.12.1. Company Overview
- 12.1.12.2. Products
- 12.1.12.3. Company Financials
- 12.1.12.4. SWOT Analysis
- 12.1.13 International Paper
- 12.1.13.1. Company Overview
- 12.1.13.2. Products
- 12.1.13.3. Company Financials
- 12.1.13.4. SWOT Analysis
- 12.1.14 Fabri-Kal Corporation
- 12.1.14.1. Company Overview
- 12.1.14.2. Products
- 12.1.14.3. Company Financials
- 12.1.14.4. SWOT Analysis
- 12.1.15 Georgia-Pacific
- 12.1.15.1. Company Overview
- 12.1.15.2. Products
- 12.1.15.3. Company Financials
- 12.1.15.4. SWOT Analysis
- 12.1.16 Smurfit Kappa Group
- 12.1.16.1. Company Overview
- 12.1.16.2. Products
- 12.1.16.3. Company Financials
- 12.1.16.4. SWOT Analysis
- 12.1.17 Crown Holdings
- 12.1.17.1. Company Overview
- 12.1.17.2. Products
- 12.1.17.3. Company Financials
- 12.1.17.4. SWOT Analysis
- 12.1.18 DS Smith
- 12.1.18.1. Company Overview
- 12.1.18.2. Products
- 12.1.18.3. Company Financials
- 12.1.18.4. SWOT Analysis
- 12.1.19 Schoeller Allibert Services
- 12.1.19.1. Company Overview
- 12.1.19.2. Products
- 12.1.19.3. Company Financials
- 12.1.19.4. SWOT Analysis
- 12.1.20 Huhtamaki Oyj
- 12.1.20.1. Company Overview
- 12.1.20.2. Products
- 12.1.20.3. Company Financials
- 12.1.20.4. SWOT Analysis
- 12.1.1 Grief
- 12.2. Market Entropy
- 12.2.1 Company's Key Areas Served
- 12.2.2 Recent Developments
- 12.3. Company Market Share Analysis 2025
- 12.3.1 Top 5 Companies Market Share Analysis
- 12.3.2 Top 3 Companies Market Share Analysis
- 12.4. List of Potential Customers
- 13. Research Methodology
List of Figures
- Figure 1: Global Rigid Packaging Containers Revenue Breakdown (billion, %) by Region 2025 & 2033
- Figure 2: Global Rigid Packaging Containers Volume Breakdown (K, %) by Region 2025 & 2033
- Figure 3: North America Rigid Packaging Containers Revenue (billion), by Application 2025 & 2033
- Figure 4: North America Rigid Packaging Containers Volume (K), by Application 2025 & 2033
- Figure 5: North America Rigid Packaging Containers Revenue Share (%), by Application 2025 & 2033
- Figure 6: North America Rigid Packaging Containers Volume Share (%), by Application 2025 & 2033
- Figure 7: North America Rigid Packaging Containers Revenue (billion), by Types 2025 & 2033
- Figure 8: North America Rigid Packaging Containers Volume (K), by Types 2025 & 2033
- Figure 9: North America Rigid Packaging Containers Revenue Share (%), by Types 2025 & 2033
- Figure 10: North America Rigid Packaging Containers Volume Share (%), by Types 2025 & 2033
- Figure 11: North America Rigid Packaging Containers Revenue (billion), by Country 2025 & 2033
- Figure 12: North America Rigid Packaging Containers Volume (K), by Country 2025 & 2033
- Figure 13: North America Rigid Packaging Containers Revenue Share (%), by Country 2025 & 2033
- Figure 14: North America Rigid Packaging Containers Volume Share (%), by Country 2025 & 2033
- Figure 15: South America Rigid Packaging Containers Revenue (billion), by Application 2025 & 2033
- Figure 16: South America Rigid Packaging Containers Volume (K), by Application 2025 & 2033
- Figure 17: South America Rigid Packaging Containers Revenue Share (%), by Application 2025 & 2033
- Figure 18: South America Rigid Packaging Containers Volume Share (%), by Application 2025 & 2033
- Figure 19: South America Rigid Packaging Containers Revenue (billion), by Types 2025 & 2033
- Figure 20: South America Rigid Packaging Containers Volume (K), by Types 2025 & 2033
- Figure 21: South America Rigid Packaging Containers Revenue Share (%), by Types 2025 & 2033
- Figure 22: South America Rigid Packaging Containers Volume Share (%), by Types 2025 & 2033
- Figure 23: South America Rigid Packaging Containers Revenue (billion), by Country 2025 & 2033
- Figure 24: South America Rigid Packaging Containers Volume (K), by Country 2025 & 2033
- Figure 25: South America Rigid Packaging Containers Revenue Share (%), by Country 2025 & 2033
- Figure 26: South America Rigid Packaging Containers Volume Share (%), by Country 2025 & 2033
- Figure 27: Europe Rigid Packaging Containers Revenue (billion), by Application 2025 & 2033
- Figure 28: Europe Rigid Packaging Containers Volume (K), by Application 2025 & 2033
- Figure 29: Europe Rigid Packaging Containers Revenue Share (%), by Application 2025 & 2033
- Figure 30: Europe Rigid Packaging Containers Volume Share (%), by Application 2025 & 2033
- Figure 31: Europe Rigid Packaging Containers Revenue (billion), by Types 2025 & 2033
- Figure 32: Europe Rigid Packaging Containers Volume (K), by Types 2025 & 2033
- Figure 33: Europe Rigid Packaging Containers Revenue Share (%), by Types 2025 & 2033
- Figure 34: Europe Rigid Packaging Containers Volume Share (%), by Types 2025 & 2033
- Figure 35: Europe Rigid Packaging Containers Revenue (billion), by Country 2025 & 2033
- Figure 36: Europe Rigid Packaging Containers Volume (K), by Country 2025 & 2033
- Figure 37: Europe Rigid Packaging Containers Revenue Share (%), by Country 2025 & 2033
- Figure 38: Europe Rigid Packaging Containers Volume Share (%), by Country 2025 & 2033
- Figure 39: Middle East & Africa Rigid Packaging Containers Revenue (billion), by Application 2025 & 2033
- Figure 40: Middle East & Africa Rigid Packaging Containers Volume (K), by Application 2025 & 2033
- Figure 41: Middle East & Africa Rigid Packaging Containers Revenue Share (%), by Application 2025 & 2033
- Figure 42: Middle East & Africa Rigid Packaging Containers Volume Share (%), by Application 2025 & 2033
- Figure 43: Middle East & Africa Rigid Packaging Containers Revenue (billion), by Types 2025 & 2033
- Figure 44: Middle East & Africa Rigid Packaging Containers Volume (K), by Types 2025 & 2033
- Figure 45: Middle East & Africa Rigid Packaging Containers Revenue Share (%), by Types 2025 & 2033
- Figure 46: Middle East & Africa Rigid Packaging Containers Volume Share (%), by Types 2025 & 2033
- Figure 47: Middle East & Africa Rigid Packaging Containers Revenue (billion), by Country 2025 & 2033
- Figure 48: Middle East & Africa Rigid Packaging Containers Volume (K), by Country 2025 & 2033
- Figure 49: Middle East & Africa Rigid Packaging Containers Revenue Share (%), by Country 2025 & 2033
- Figure 50: Middle East & Africa Rigid Packaging Containers Volume Share (%), by Country 2025 & 2033
- Figure 51: Asia Pacific Rigid Packaging Containers Revenue (billion), by Application 2025 & 2033
- Figure 52: Asia Pacific Rigid Packaging Containers Volume (K), by Application 2025 & 2033
- Figure 53: Asia Pacific Rigid Packaging Containers Revenue Share (%), by Application 2025 & 2033
- Figure 54: Asia Pacific Rigid Packaging Containers Volume Share (%), by Application 2025 & 2033
- Figure 55: Asia Pacific Rigid Packaging Containers Revenue (billion), by Types 2025 & 2033
- Figure 56: Asia Pacific Rigid Packaging Containers Volume (K), by Types 2025 & 2033
- Figure 57: Asia Pacific Rigid Packaging Containers Revenue Share (%), by Types 2025 & 2033
- Figure 58: Asia Pacific Rigid Packaging Containers Volume Share (%), by Types 2025 & 2033
- Figure 59: Asia Pacific Rigid Packaging Containers Revenue (billion), by Country 2025 & 2033
- Figure 60: Asia Pacific Rigid Packaging Containers Volume (K), by Country 2025 & 2033
- Figure 61: Asia Pacific Rigid Packaging Containers Revenue Share (%), by Country 2025 & 2033
- Figure 62: Asia Pacific Rigid Packaging Containers Volume Share (%), by Country 2025 & 2033
List of Tables
- Table 1: Global Rigid Packaging Containers Revenue billion Forecast, by Application 2020 & 2033
- Table 2: Global Rigid Packaging Containers Volume K Forecast, by Application 2020 & 2033
- Table 3: Global Rigid Packaging Containers Revenue billion Forecast, by Types 2020 & 2033
- Table 4: Global Rigid Packaging Containers Volume K Forecast, by Types 2020 & 2033
- Table 5: Global Rigid Packaging Containers Revenue billion Forecast, by Region 2020 & 2033
- Table 6: Global Rigid Packaging Containers Volume K Forecast, by Region 2020 & 2033
- Table 7: Global Rigid Packaging Containers Revenue billion Forecast, by Application 2020 & 2033
- Table 8: Global Rigid Packaging Containers Volume K Forecast, by Application 2020 & 2033
- Table 9: Global Rigid Packaging Containers Revenue billion Forecast, by Types 2020 & 2033
- Table 10: Global Rigid Packaging Containers Volume K Forecast, by Types 2020 & 2033
- Table 11: Global Rigid Packaging Containers Revenue billion Forecast, by Country 2020 & 2033
- Table 12: Global Rigid Packaging Containers Volume K Forecast, by Country 2020 & 2033
- Table 13: United States Rigid Packaging Containers Revenue (billion) Forecast, by Application 2020 & 2033
- Table 14: United States Rigid Packaging Containers Volume (K) Forecast, by Application 2020 & 2033
- Table 15: Canada Rigid Packaging Containers Revenue (billion) Forecast, by Application 2020 & 2033
- Table 16: Canada Rigid Packaging Containers Volume (K) Forecast, by Application 2020 & 2033
- Table 17: Mexico Rigid Packaging Containers Revenue (billion) Forecast, by Application 2020 & 2033
- Table 18: Mexico Rigid Packaging Containers Volume (K) Forecast, by Application 2020 & 2033
- Table 19: Global Rigid Packaging Containers Revenue billion Forecast, by Application 2020 & 2033
- Table 20: Global Rigid Packaging Containers Volume K Forecast, by Application 2020 & 2033
- Table 21: Global Rigid Packaging Containers Revenue billion Forecast, by Types 2020 & 2033
- Table 22: Global Rigid Packaging Containers Volume K Forecast, by Types 2020 & 2033
- Table 23: Global Rigid Packaging Containers Revenue billion Forecast, by Country 2020 & 2033
- Table 24: Global Rigid Packaging Containers Volume K Forecast, by Country 2020 & 2033
- Table 25: Brazil Rigid Packaging Containers Revenue (billion) Forecast, by Application 2020 & 2033
- Table 26: Brazil Rigid Packaging Containers Volume (K) Forecast, by Application 2020 & 2033
- Table 27: Argentina Rigid Packaging Containers Revenue (billion) Forecast, by Application 2020 & 2033
- Table 28: Argentina Rigid Packaging Containers Volume (K) Forecast, by Application 2020 & 2033
- Table 29: Rest of South America Rigid Packaging Containers Revenue (billion) Forecast, by Application 2020 & 2033
- Table 30: Rest of South America Rigid Packaging Containers Volume (K) Forecast, by Application 2020 & 2033
- Table 31: Global Rigid Packaging Containers Revenue billion Forecast, by Application 2020 & 2033
- Table 32: Global Rigid Packaging Containers Volume K Forecast, by Application 2020 & 2033
- Table 33: Global Rigid Packaging Containers Revenue billion Forecast, by Types 2020 & 2033
- Table 34: Global Rigid Packaging Containers Volume K Forecast, by Types 2020 & 2033
- Table 35: Global Rigid Packaging Containers Revenue billion Forecast, by Country 2020 & 2033
- Table 36: Global Rigid Packaging Containers Volume K Forecast, by Country 2020 & 2033
- Table 37: United Kingdom Rigid Packaging Containers Revenue (billion) Forecast, by Application 2020 & 2033
- Table 38: United Kingdom Rigid Packaging Containers Volume (K) Forecast, by Application 2020 & 2033
- Table 39: Germany Rigid Packaging Containers Revenue (billion) Forecast, by Application 2020 & 2033
- Table 40: Germany Rigid Packaging Containers Volume (K) Forecast, by Application 2020 & 2033
- Table 41: France Rigid Packaging Containers Revenue (billion) Forecast, by Application 2020 & 2033
- Table 42: France Rigid Packaging Containers Volume (K) Forecast, by Application 2020 & 2033
- Table 43: Italy Rigid Packaging Containers Revenue (billion) Forecast, by Application 2020 & 2033
- Table 44: Italy Rigid Packaging Containers Volume (K) Forecast, by Application 2020 & 2033
- Table 45: Spain Rigid Packaging Containers Revenue (billion) Forecast, by Application 2020 & 2033
- Table 46: Spain Rigid Packaging Containers Volume (K) Forecast, by Application 2020 & 2033
- Table 47: Russia Rigid Packaging Containers Revenue (billion) Forecast, by Application 2020 & 2033
- Table 48: Russia Rigid Packaging Containers Volume (K) Forecast, by Application 2020 & 2033
- Table 49: Benelux Rigid Packaging Containers Revenue (billion) Forecast, by Application 2020 & 2033
- Table 50: Benelux Rigid Packaging Containers Volume (K) Forecast, by Application 2020 & 2033
- Table 51: Nordics Rigid Packaging Containers Revenue (billion) Forecast, by Application 2020 & 2033
- Table 52: Nordics Rigid Packaging Containers Volume (K) Forecast, by Application 2020 & 2033
- Table 53: Rest of Europe Rigid Packaging Containers Revenue (billion) Forecast, by Application 2020 & 2033
- Table 54: Rest of Europe Rigid Packaging Containers Volume (K) Forecast, by Application 2020 & 2033
- Table 55: Global Rigid Packaging Containers Revenue billion Forecast, by Application 2020 & 2033
- Table 56: Global Rigid Packaging Containers Volume K Forecast, by Application 2020 & 2033
- Table 57: Global Rigid Packaging Containers Revenue billion Forecast, by Types 2020 & 2033
- Table 58: Global Rigid Packaging Containers Volume K Forecast, by Types 2020 & 2033
- Table 59: Global Rigid Packaging Containers Revenue billion Forecast, by Country 2020 & 2033
- Table 60: Global Rigid Packaging Containers Volume K Forecast, by Country 2020 & 2033
- Table 61: Turkey Rigid Packaging Containers Revenue (billion) Forecast, by Application 2020 & 2033
- Table 62: Turkey Rigid Packaging Containers Volume (K) Forecast, by Application 2020 & 2033
- Table 63: Israel Rigid Packaging Containers Revenue (billion) Forecast, by Application 2020 & 2033
- Table 64: Israel Rigid Packaging Containers Volume (K) Forecast, by Application 2020 & 2033
- Table 65: GCC Rigid Packaging Containers Revenue (billion) Forecast, by Application 2020 & 2033
- Table 66: GCC Rigid Packaging Containers Volume (K) Forecast, by Application 2020 & 2033
- Table 67: North Africa Rigid Packaging Containers Revenue (billion) Forecast, by Application 2020 & 2033
- Table 68: North Africa Rigid Packaging Containers Volume (K) Forecast, by Application 2020 & 2033
- Table 69: South Africa Rigid Packaging Containers Revenue (billion) Forecast, by Application 2020 & 2033
- Table 70: South Africa Rigid Packaging Containers Volume (K) Forecast, by Application 2020 & 2033
- Table 71: Rest of Middle East & Africa Rigid Packaging Containers Revenue (billion) Forecast, by Application 2020 & 2033
- Table 72: Rest of Middle East & Africa Rigid Packaging Containers Volume (K) Forecast, by Application 2020 & 2033
- Table 73: Global Rigid Packaging Containers Revenue billion Forecast, by Application 2020 & 2033
- Table 74: Global Rigid Packaging Containers Volume K Forecast, by Application 2020 & 2033
- Table 75: Global Rigid Packaging Containers Revenue billion Forecast, by Types 2020 & 2033
- Table 76: Global Rigid Packaging Containers Volume K Forecast, by Types 2020 & 2033
- Table 77: Global Rigid Packaging Containers Revenue billion Forecast, by Country 2020 & 2033
- Table 78: Global Rigid Packaging Containers Volume K Forecast, by Country 2020 & 2033
- Table 79: China Rigid Packaging Containers Revenue (billion) Forecast, by Application 2020 & 2033
- Table 80: China Rigid Packaging Containers Volume (K) Forecast, by Application 2020 & 2033
- Table 81: India Rigid Packaging Containers Revenue (billion) Forecast, by Application 2020 & 2033
- Table 82: India Rigid Packaging Containers Volume (K) Forecast, by Application 2020 & 2033
- Table 83: Japan Rigid Packaging Containers Revenue (billion) Forecast, by Application 2020 & 2033
- Table 84: Japan Rigid Packaging Containers Volume (K) Forecast, by Application 2020 & 2033
- Table 85: South Korea Rigid Packaging Containers Revenue (billion) Forecast, by Application 2020 & 2033
- Table 86: South Korea Rigid Packaging Containers Volume (K) Forecast, by Application 2020 & 2033
- Table 87: ASEAN Rigid Packaging Containers Revenue (billion) Forecast, by Application 2020 & 2033
- Table 88: ASEAN Rigid Packaging Containers Volume (K) Forecast, by Application 2020 & 2033
- Table 89: Oceania Rigid Packaging Containers Revenue (billion) Forecast, by Application 2020 & 2033
- Table 90: Oceania Rigid Packaging Containers Volume (K) Forecast, by Application 2020 & 2033
- Table 91: Rest of Asia Pacific Rigid Packaging Containers Revenue (billion) Forecast, by Application 2020 & 2033
- Table 92: Rest of Asia Pacific Rigid Packaging Containers Volume (K) Forecast, by Application 2020 & 2033
Frequently Asked Questions
1. What is the projected Compound Annual Growth Rate (CAGR) of the Rigid Packaging Containers?
The projected CAGR is approximately 3.6%.
2. Which companies are prominent players in the Rigid Packaging Containers?
Key companies in the market include Grief, Amcor, Berry Global, Silgan Holdings, Sonoco Products Company, Mauser Packaging Solutions, Ball Corporation, Pactiv LLC, SCHÜTZ GmbH, Winpak, WestRock, Sabert, International Paper, Fabri-Kal Corporation, Georgia-Pacific, Smurfit Kappa Group, Crown Holdings, DS Smith, Schoeller Allibert Services, Huhtamaki Oyj.
3. What are the main segments of the Rigid Packaging Containers?
The market segments include Application, Types.
4. Can you provide details about the market size?
The market size is estimated to be USD 220.2 billion as of 2022.
5. What are some drivers contributing to market growth?
N/A
6. What are the notable trends driving market growth?
N/A
7. Are there any restraints impacting market growth?
N/A
8. Can you provide examples of recent developments in the market?
N/A
9. What pricing options are available for accessing the report?
Pricing options include single-user, multi-user, and enterprise licenses priced at USD 3350.00, USD 5025.00, and USD 6700.00 respectively.
10. Is the market size provided in terms of value or volume?
The market size is provided in terms of value, measured in billion and volume, measured in K.
11. Are there any specific market keywords associated with the report?
Yes, the market keyword associated with the report is "Rigid Packaging Containers," which aids in identifying and referencing the specific market segment covered.
12. How do I determine which pricing option suits my needs best?
The pricing options vary based on user requirements and access needs. Individual users may opt for single-user licenses, while businesses requiring broader access may choose multi-user or enterprise licenses for cost-effective access to the report.
13. Are there any additional resources or data provided in the Rigid Packaging Containers report?
While the report offers comprehensive insights, it's advisable to review the specific contents or supplementary materials provided to ascertain if additional resources or data are available.
14. How can I stay updated on further developments or reports in the Rigid Packaging Containers?
To stay informed about further developments, trends, and reports in the Rigid Packaging Containers, consider subscribing to industry newsletters, following relevant companies and organizations, or regularly checking reputable industry news sources and publications.
Methodology
Step 1 - Identification of Relevant Samples Size from Population Database


Step 2 - Approaches for Defining Global Market Size (Value, Volume* & Price*)

Note*: In applicable scenarios
Step 3 - Data Sources
Primary Research
- Web Analytics
- Survey Reports
- Research Institute
- Latest Research Reports
- Opinion Leaders
Secondary Research
- Annual Reports
- White Paper
- Latest Press Release
- Industry Association
- Paid Database
- Investor Presentations

Step 4 - Data Triangulation
Involves using different sources of information in order to increase the validity of a study
These sources are likely to be stakeholders in a program - participants, other researchers, program staff, other community members, and so on.
Then we put all data in single framework & apply various statistical tools to find out the dynamic on the market.
During the analysis stage, feedback from the stakeholder groups would be compared to determine areas of agreement as well as areas of divergence