
Key Insights
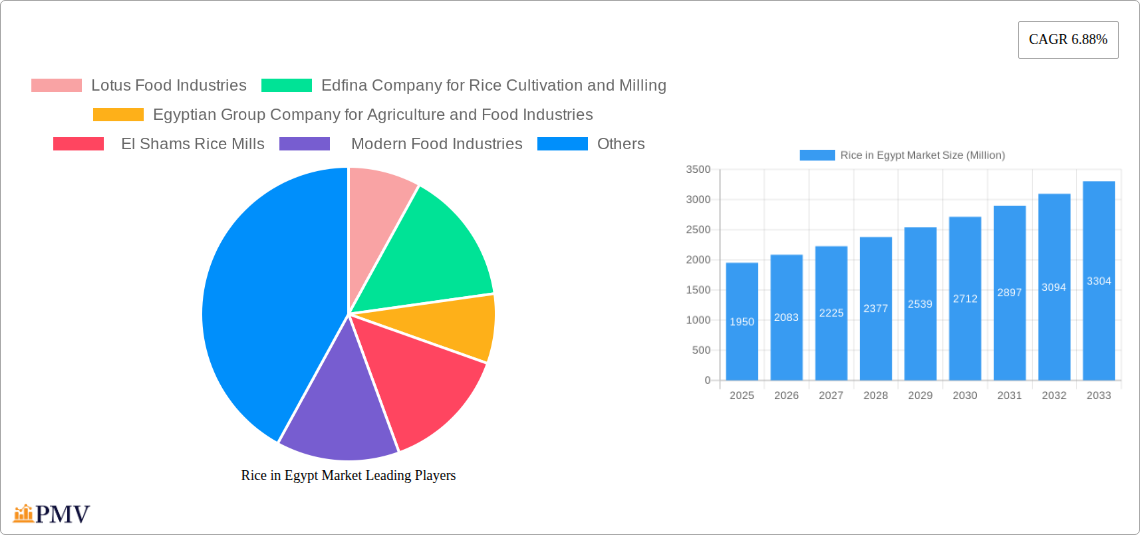
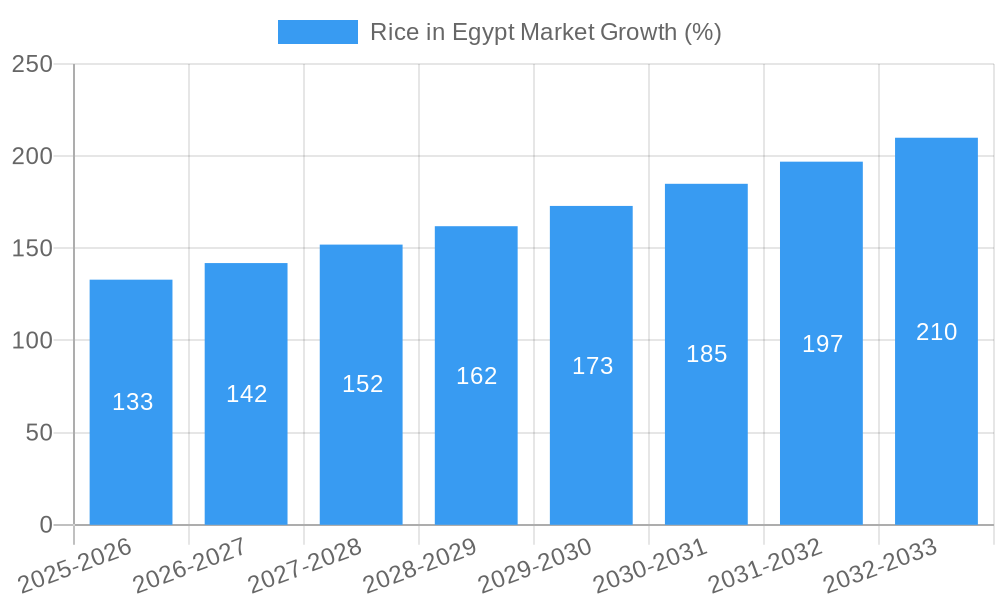
The Egyptian rice market, valued at $1.95 billion in 2025, is projected to experience robust growth, exhibiting a Compound Annual Growth Rate (CAGR) of 6.88% from 2025 to 2033. This expansion is driven by several factors. Rising disposable incomes among Egyptian consumers are fueling increased demand for rice, a staple food. Government initiatives aimed at boosting agricultural productivity and improving irrigation infrastructure are also contributing to increased rice production. Furthermore, the growing popularity of processed rice products, such as parboiled and instant rice, is expanding market segments and driving consumption. However, challenges remain. Fluctuations in global rice prices, coupled with potential water scarcity issues in certain regions of Egypt, could act as restraints on market growth. The competitive landscape comprises both established players like Lotus Food Industries and Edfina Company, alongside smaller, regional mills. These companies are focusing on product diversification, brand building, and efficient supply chain management to maintain competitiveness. Importantly, the Egyptian rice market presents significant opportunities for both domestic producers and international investors keen to tap into a growing consumer base and a market with a strong potential for future expansion. Analysis across production, consumption, import, export, and pricing dynamics within the Egyptian market reveals a dynamic and evolving landscape.
The segmentation of the Egyptian rice market based on production, consumption (volume and value), import, and export analyses provides a granular understanding of market dynamics. Detailed assessments of price trends throughout the historical and forecast periods, considering factors like input costs (fertilizers, labor), global market fluctuations, and government policies, are crucial for effective market forecasting. The dominance of key players like Lotus Food Industries highlights the importance of established brands and their strategies to meet the demands of a growing market. Future growth will likely depend on investments in technology, sustainable farming practices, and successful brand positioning strategies within the various segments of the rice market in Egypt.
Rice in Egypt Market: A Comprehensive Market Report (2019-2033)
This detailed report provides a comprehensive analysis of the Rice in Egypt Market, offering invaluable insights for industry stakeholders, investors, and strategic decision-makers. Covering the period from 2019 to 2033, with a focus on 2025 (base and estimated year), this report meticulously examines market dynamics, competitive landscapes, and future growth potential. The study period spans the historical period (2019-2024) and the forecast period (2025-2033).
Rice in Egypt Market Market Structure & Competitive Dynamics
The Egyptian rice market exhibits a moderately concentrated structure, with a few dominant players and several smaller regional mills. Key players include Lotus Food Industries, Edfina Company for Rice Cultivation and Milling, Egyptian Group Company for Agriculture and Food Industries, El Shams Rice Mills, and Modern Food Industries. These companies compete primarily on price, quality, and brand recognition. Market share data for 2024 indicates Lotus Food Industries holds approximately xx% market share, followed by Edfina Company at xx%, while the remaining players share the remaining xx%.
The regulatory framework governing rice production and trade in Egypt significantly impacts market dynamics. Government policies related to import tariffs, subsidies, and quality control influence both domestic production and import volumes. The presence of substitute grains, such as wheat and corn, also plays a role, particularly within the price-sensitive consumer segment. Furthermore, M&A activity within the sector, though not extensive, is influenced by the desire for increased scale and market reach. Recorded M&A deal values in the past five years have totaled approximately xx Million, with the largest transaction valued at xx Million in 2022. Innovation ecosystems remain relatively underdeveloped, with limited investment in advanced technologies for rice cultivation and processing. End-user trends show a growing preference for higher-quality, packaged rice, driving some companies to upgrade their processing and packaging capabilities.
Rice in Egypt Market Industry Trends & Insights
The Egyptian rice market displays a steady growth trajectory, driven by a combination of factors. The consistent rise in population and increasing urbanization fuel demand, while government support for agricultural development enhances domestic production. However, fluctuating global rice prices and dependence on imports pose significant challenges. The Compound Annual Growth Rate (CAGR) for rice consumption volume from 2019 to 2024 was approximately xx%, while the market penetration of premium rice varieties increased by xx% during the same period.
Technological disruptions are slowly impacting the sector, with some larger companies adopting improved milling and processing techniques. Consumer preferences are shifting towards premium, branded rice, and conveniently packaged options. The competitive dynamics are shaped by the interplay between domestic producers and importers, with a growing focus on value-added products and branding.
Dominant Markets & Segments in Rice in Egypt Market
- Egypt: Production Analysis (Volume): Domestic rice production has shown fluctuating growth due to factors like water availability and government support programs. Production volume in 2024 reached approximately xx Million tons.
- Egypt: Consumption Analysis (Volume and Value): Rice consumption in Egypt is high, reflecting its significance in the national diet. Total consumption volume in 2024 reached xx Million tons, with a total value of approximately xx Million.
- Egypt: Import Market Analysis (Volume and Value): Egypt remains a significant importer of rice to supplement domestic production. Import volume in 2024 was estimated at xx Million tons, valued at approximately xx Million. Key import sources include xx and xx.
- Egypt: Export Market Analysis (Volume and Value): Egypt's rice exports are relatively limited, primarily catering to regional markets. Export volume in 2024 was approximately xx Million tons, with a value of approximately xx Million.
- Price Trend Analysis: Rice prices in Egypt have been subject to volatility, influenced by both global market fluctuations and domestic supply conditions. The average price per ton in 2024 was approximately xx USD.
Key drivers of dominance include favorable climatic conditions in certain regions, government support for agriculture, and robust consumer demand. Infrastructure limitations, particularly in irrigation and transportation, pose challenges.
Rice in Egypt Market Product Innovations
Recent innovations focus on developing drought-resistant rice varieties, such as the 'Sakha Super 300' variety, which addresses water scarcity concerns. Improvements in milling and packaging technologies are also evident, aimed at enhancing product quality and shelf life. The focus is on catering to evolving consumer preferences for convenience and premium quality.
Report Segmentation & Scope
This report segments the Egyptian rice market across various aspects: production volume by region, consumption volume and value by consumer segment, import and export volumes and values by country of origin/destination, and price trend analysis by variety. Each segment provides detailed growth projections, market size estimations, and competitive dynamics for the forecast period. Specific growth rates vary across segments.
Key Drivers of Rice in Egypt Market Growth
Population growth, rising urbanization, and increasing disposable incomes are driving demand for rice. Government policies promoting agricultural development, particularly initiatives aimed at improving water management and technological advancement, also contribute to growth.
Challenges in the Rice in Egypt Market Sector
Water scarcity, particularly in certain agricultural regions, poses a major constraint on production. Fluctuations in global rice prices impact domestic market stability. Furthermore, infrastructural limitations hamper efficient transportation and distribution, increasing costs.
Leading Players in the Rice in Egypt Market Market
- Lotus Food Industries
- Edfina Company for Rice Cultivation and Milling
- Egyptian Group Company for Agriculture and Food Industries
- El Shams Rice Mills
- Modern Food Industries
Key Developments in Rice in Egypt Market Sector
- April 2022: Egyptian scientist 'Dr. Hamdi Al-Mawafi' received a gold medal at the 2022 Geneva International Exhibition of Inventions for developing the drought-resistant 'Sakha Super 300' rice variety. This innovation has the potential to significantly impact future production levels.
- November 2022: The Rice Farmers Association of Nigeria signed a memorandum of understanding with Tiamin Rice Company (Egypt) for processing and selling rice locally and internationally. This development opens new export markets for Egyptian rice producers.
Strategic Rice in Egypt Market Market Outlook
The Egyptian rice market presents significant opportunities for growth, driven by a combination of factors. Investing in water-efficient farming techniques and upgrading milling and processing technologies are crucial. Focusing on premium and value-added rice products to cater to evolving consumer preferences will also yield positive outcomes. Exploring export markets and capitalizing on strategic partnerships can further enhance market competitiveness.
Rice in Egypt Market Segmentation
-
1. Egypt
- 1.1. Production Analysis (Volume)
- 1.2. Consumption Analysis (Volume and Value)
- 1.3. Import Market Analysis (Volume and Value)
- 1.4. Export Market Analysis (Volume and Value)
- 1.5. Price Trend Analysis
-
2. Egypt
- 2.1. Production Analysis (Volume)
- 2.2. Consumption Analysis (Volume and Value)
- 2.3. Import Market Analysis (Volume and Value)
- 2.4. Export Market Analysis (Volume and Value)
- 2.5. Price Trend Analysis
Rice in Egypt Market Segmentation By Geography
-
1. North America
- 1.1. United States
- 1.2. Canada
- 1.3. Mexico
-
2. South America
- 2.1. Brazil
- 2.2. Argentina
- 2.3. Rest of South America
-
3. Europe
- 3.1. United Kingdom
- 3.2. Germany
- 3.3. France
- 3.4. Italy
- 3.5. Spain
- 3.6. Russia
- 3.7. Benelux
- 3.8. Nordics
- 3.9. Rest of Europe
-
4. Middle East & Africa
- 4.1. Turkey
- 4.2. Israel
- 4.3. GCC
- 4.4. North Africa
- 4.5. South Africa
- 4.6. Rest of Middle East & Africa
-
5. Asia Pacific
- 5.1. China
- 5.2. India
- 5.3. Japan
- 5.4. South Korea
- 5.5. ASEAN
- 5.6. Oceania
- 5.7. Rest of Asia Pacific
Rice in Egypt Market REPORT HIGHLIGHTS
| Aspects | Details |
|---|---|
| Study Period | 2019-2033 |
| Base Year | 2024 |
| Estimated Year | 2025 |
| Forecast Period | 2025-2033 |
| Historical Period | 2019-2024 |
| Growth Rate | CAGR of 6.88% from 2019-2033 |
| Segmentation |
|
Table of Contents
- 1. Introduction
- 1.1. Research Scope
- 1.2. Market Segmentation
- 1.3. Research Methodology
- 1.4. Definitions and Assumptions
- 2. Executive Summary
- 2.1. Introduction
- 3. Market Dynamics
- 3.1. Introduction
- 3.2. Market Drivers
- 3.2.1. Rising Consumption of Cashew Nuts in the Country; Favorable Government Initiatives
- 3.3. Market Restrains
- 3.3.1. Hazardous Climatic Condition Hinders Cashew Production; Stringent Regulations Related to Food Quality Standards
- 3.4. Market Trends
- 3.4.1. Increase in demand of rice due to rising population
- 4. Market Factor Analysis
- 4.1. Porters Five Forces
- 4.2. Supply/Value Chain
- 4.3. PESTEL analysis
- 4.4. Market Entropy
- 4.5. Patent/Trademark Analysis
- 5. Global Rice in Egypt Market Analysis, Insights and Forecast, 2019-2031
- 5.1. Market Analysis, Insights and Forecast - by Egypt
- 5.1.1. Production Analysis (Volume)
- 5.1.2. Consumption Analysis (Volume and Value)
- 5.1.3. Import Market Analysis (Volume and Value)
- 5.1.4. Export Market Analysis (Volume and Value)
- 5.1.5. Price Trend Analysis
- 5.2. Market Analysis, Insights and Forecast - by Egypt
- 5.2.1. Production Analysis (Volume)
- 5.2.2. Consumption Analysis (Volume and Value)
- 5.2.3. Import Market Analysis (Volume and Value)
- 5.2.4. Export Market Analysis (Volume and Value)
- 5.2.5. Price Trend Analysis
- 5.3. Market Analysis, Insights and Forecast - by Region
- 5.3.1. North America
- 5.3.2. South America
- 5.3.3. Europe
- 5.3.4. Middle East & Africa
- 5.3.5. Asia Pacific
- 5.1. Market Analysis, Insights and Forecast - by Egypt
- 6. North America Rice in Egypt Market Analysis, Insights and Forecast, 2019-2031
- 6.1. Market Analysis, Insights and Forecast - by Egypt
- 6.1.1. Production Analysis (Volume)
- 6.1.2. Consumption Analysis (Volume and Value)
- 6.1.3. Import Market Analysis (Volume and Value)
- 6.1.4. Export Market Analysis (Volume and Value)
- 6.1.5. Price Trend Analysis
- 6.2. Market Analysis, Insights and Forecast - by Egypt
- 6.2.1. Production Analysis (Volume)
- 6.2.2. Consumption Analysis (Volume and Value)
- 6.2.3. Import Market Analysis (Volume and Value)
- 6.2.4. Export Market Analysis (Volume and Value)
- 6.2.5. Price Trend Analysis
- 6.1. Market Analysis, Insights and Forecast - by Egypt
- 7. South America Rice in Egypt Market Analysis, Insights and Forecast, 2019-2031
- 7.1. Market Analysis, Insights and Forecast - by Egypt
- 7.1.1. Production Analysis (Volume)
- 7.1.2. Consumption Analysis (Volume and Value)
- 7.1.3. Import Market Analysis (Volume and Value)
- 7.1.4. Export Market Analysis (Volume and Value)
- 7.1.5. Price Trend Analysis
- 7.2. Market Analysis, Insights and Forecast - by Egypt
- 7.2.1. Production Analysis (Volume)
- 7.2.2. Consumption Analysis (Volume and Value)
- 7.2.3. Import Market Analysis (Volume and Value)
- 7.2.4. Export Market Analysis (Volume and Value)
- 7.2.5. Price Trend Analysis
- 7.1. Market Analysis, Insights and Forecast - by Egypt
- 8. Europe Rice in Egypt Market Analysis, Insights and Forecast, 2019-2031
- 8.1. Market Analysis, Insights and Forecast - by Egypt
- 8.1.1. Production Analysis (Volume)
- 8.1.2. Consumption Analysis (Volume and Value)
- 8.1.3. Import Market Analysis (Volume and Value)
- 8.1.4. Export Market Analysis (Volume and Value)
- 8.1.5. Price Trend Analysis
- 8.2. Market Analysis, Insights and Forecast - by Egypt
- 8.2.1. Production Analysis (Volume)
- 8.2.2. Consumption Analysis (Volume and Value)
- 8.2.3. Import Market Analysis (Volume and Value)
- 8.2.4. Export Market Analysis (Volume and Value)
- 8.2.5. Price Trend Analysis
- 8.1. Market Analysis, Insights and Forecast - by Egypt
- 9. Middle East & Africa Rice in Egypt Market Analysis, Insights and Forecast, 2019-2031
- 9.1. Market Analysis, Insights and Forecast - by Egypt
- 9.1.1. Production Analysis (Volume)
- 9.1.2. Consumption Analysis (Volume and Value)
- 9.1.3. Import Market Analysis (Volume and Value)
- 9.1.4. Export Market Analysis (Volume and Value)
- 9.1.5. Price Trend Analysis
- 9.2. Market Analysis, Insights and Forecast - by Egypt
- 9.2.1. Production Analysis (Volume)
- 9.2.2. Consumption Analysis (Volume and Value)
- 9.2.3. Import Market Analysis (Volume and Value)
- 9.2.4. Export Market Analysis (Volume and Value)
- 9.2.5. Price Trend Analysis
- 9.1. Market Analysis, Insights and Forecast - by Egypt
- 10. Asia Pacific Rice in Egypt Market Analysis, Insights and Forecast, 2019-2031
- 10.1. Market Analysis, Insights and Forecast - by Egypt
- 10.1.1. Production Analysis (Volume)
- 10.1.2. Consumption Analysis (Volume and Value)
- 10.1.3. Import Market Analysis (Volume and Value)
- 10.1.4. Export Market Analysis (Volume and Value)
- 10.1.5. Price Trend Analysis
- 10.2. Market Analysis, Insights and Forecast - by Egypt
- 10.2.1. Production Analysis (Volume)
- 10.2.2. Consumption Analysis (Volume and Value)
- 10.2.3. Import Market Analysis (Volume and Value)
- 10.2.4. Export Market Analysis (Volume and Value)
- 10.2.5. Price Trend Analysis
- 10.1. Market Analysis, Insights and Forecast - by Egypt
- 11. Competitive Analysis
- 11.1. Global Market Share Analysis 2024
- 11.2. Company Profiles
- 11.2.1 Lotus Food Industries
- 11.2.1.1. Overview
- 11.2.1.2. Products
- 11.2.1.3. SWOT Analysis
- 11.2.1.4. Recent Developments
- 11.2.1.5. Financials (Based on Availability)
- 11.2.2 Edfina Company for Rice Cultivation and Milling
- 11.2.2.1. Overview
- 11.2.2.2. Products
- 11.2.2.3. SWOT Analysis
- 11.2.2.4. Recent Developments
- 11.2.2.5. Financials (Based on Availability)
- 11.2.3 Egyptian Group Company for Agriculture and Food Industries
- 11.2.3.1. Overview
- 11.2.3.2. Products
- 11.2.3.3. SWOT Analysis
- 11.2.3.4. Recent Developments
- 11.2.3.5. Financials (Based on Availability)
- 11.2.4 El Shams Rice Mills
- 11.2.4.1. Overview
- 11.2.4.2. Products
- 11.2.4.3. SWOT Analysis
- 11.2.4.4. Recent Developments
- 11.2.4.5. Financials (Based on Availability)
- 11.2.5 Modern Food Industries
- 11.2.5.1. Overview
- 11.2.5.2. Products
- 11.2.5.3. SWOT Analysis
- 11.2.5.4. Recent Developments
- 11.2.5.5. Financials (Based on Availability)
- 11.2.1 Lotus Food Industries
List of Figures
- Figure 1: Global Rice in Egypt Market Revenue Breakdown (Million, %) by Region 2024 & 2032
- Figure 2: Global Rice in Egypt Market Volume Breakdown (Kiloton, %) by Region 2024 & 2032
- Figure 3: Egypt Rice in Egypt Market Revenue (Million), by Country 2024 & 2032
- Figure 4: Egypt Rice in Egypt Market Volume (Kiloton), by Country 2024 & 2032
- Figure 5: Egypt Rice in Egypt Market Revenue Share (%), by Country 2024 & 2032
- Figure 6: Egypt Rice in Egypt Market Volume Share (%), by Country 2024 & 2032
- Figure 7: North America Rice in Egypt Market Revenue (Million), by Egypt 2024 & 2032
- Figure 8: North America Rice in Egypt Market Volume (Kiloton), by Egypt 2024 & 2032
- Figure 9: North America Rice in Egypt Market Revenue Share (%), by Egypt 2024 & 2032
- Figure 10: North America Rice in Egypt Market Volume Share (%), by Egypt 2024 & 2032
- Figure 11: North America Rice in Egypt Market Revenue (Million), by Egypt 2024 & 2032
- Figure 12: North America Rice in Egypt Market Volume (Kiloton), by Egypt 2024 & 2032
- Figure 13: North America Rice in Egypt Market Revenue Share (%), by Egypt 2024 & 2032
- Figure 14: North America Rice in Egypt Market Volume Share (%), by Egypt 2024 & 2032
- Figure 15: North America Rice in Egypt Market Revenue (Million), by Country 2024 & 2032
- Figure 16: North America Rice in Egypt Market Volume (Kiloton), by Country 2024 & 2032
- Figure 17: North America Rice in Egypt Market Revenue Share (%), by Country 2024 & 2032
- Figure 18: North America Rice in Egypt Market Volume Share (%), by Country 2024 & 2032
- Figure 19: South America Rice in Egypt Market Revenue (Million), by Egypt 2024 & 2032
- Figure 20: South America Rice in Egypt Market Volume (Kiloton), by Egypt 2024 & 2032
- Figure 21: South America Rice in Egypt Market Revenue Share (%), by Egypt 2024 & 2032
- Figure 22: South America Rice in Egypt Market Volume Share (%), by Egypt 2024 & 2032
- Figure 23: South America Rice in Egypt Market Revenue (Million), by Egypt 2024 & 2032
- Figure 24: South America Rice in Egypt Market Volume (Kiloton), by Egypt 2024 & 2032
- Figure 25: South America Rice in Egypt Market Revenue Share (%), by Egypt 2024 & 2032
- Figure 26: South America Rice in Egypt Market Volume Share (%), by Egypt 2024 & 2032
- Figure 27: South America Rice in Egypt Market Revenue (Million), by Country 2024 & 2032
- Figure 28: South America Rice in Egypt Market Volume (Kiloton), by Country 2024 & 2032
- Figure 29: South America Rice in Egypt Market Revenue Share (%), by Country 2024 & 2032
- Figure 30: South America Rice in Egypt Market Volume Share (%), by Country 2024 & 2032
- Figure 31: Europe Rice in Egypt Market Revenue (Million), by Egypt 2024 & 2032
- Figure 32: Europe Rice in Egypt Market Volume (Kiloton), by Egypt 2024 & 2032
- Figure 33: Europe Rice in Egypt Market Revenue Share (%), by Egypt 2024 & 2032
- Figure 34: Europe Rice in Egypt Market Volume Share (%), by Egypt 2024 & 2032
- Figure 35: Europe Rice in Egypt Market Revenue (Million), by Egypt 2024 & 2032
- Figure 36: Europe Rice in Egypt Market Volume (Kiloton), by Egypt 2024 & 2032
- Figure 37: Europe Rice in Egypt Market Revenue Share (%), by Egypt 2024 & 2032
- Figure 38: Europe Rice in Egypt Market Volume Share (%), by Egypt 2024 & 2032
- Figure 39: Europe Rice in Egypt Market Revenue (Million), by Country 2024 & 2032
- Figure 40: Europe Rice in Egypt Market Volume (Kiloton), by Country 2024 & 2032
- Figure 41: Europe Rice in Egypt Market Revenue Share (%), by Country 2024 & 2032
- Figure 42: Europe Rice in Egypt Market Volume Share (%), by Country 2024 & 2032
- Figure 43: Middle East & Africa Rice in Egypt Market Revenue (Million), by Egypt 2024 & 2032
- Figure 44: Middle East & Africa Rice in Egypt Market Volume (Kiloton), by Egypt 2024 & 2032
- Figure 45: Middle East & Africa Rice in Egypt Market Revenue Share (%), by Egypt 2024 & 2032
- Figure 46: Middle East & Africa Rice in Egypt Market Volume Share (%), by Egypt 2024 & 2032
- Figure 47: Middle East & Africa Rice in Egypt Market Revenue (Million), by Egypt 2024 & 2032
- Figure 48: Middle East & Africa Rice in Egypt Market Volume (Kiloton), by Egypt 2024 & 2032
- Figure 49: Middle East & Africa Rice in Egypt Market Revenue Share (%), by Egypt 2024 & 2032
- Figure 50: Middle East & Africa Rice in Egypt Market Volume Share (%), by Egypt 2024 & 2032
- Figure 51: Middle East & Africa Rice in Egypt Market Revenue (Million), by Country 2024 & 2032
- Figure 52: Middle East & Africa Rice in Egypt Market Volume (Kiloton), by Country 2024 & 2032
- Figure 53: Middle East & Africa Rice in Egypt Market Revenue Share (%), by Country 2024 & 2032
- Figure 54: Middle East & Africa Rice in Egypt Market Volume Share (%), by Country 2024 & 2032
- Figure 55: Asia Pacific Rice in Egypt Market Revenue (Million), by Egypt 2024 & 2032
- Figure 56: Asia Pacific Rice in Egypt Market Volume (Kiloton), by Egypt 2024 & 2032
- Figure 57: Asia Pacific Rice in Egypt Market Revenue Share (%), by Egypt 2024 & 2032
- Figure 58: Asia Pacific Rice in Egypt Market Volume Share (%), by Egypt 2024 & 2032
- Figure 59: Asia Pacific Rice in Egypt Market Revenue (Million), by Egypt 2024 & 2032
- Figure 60: Asia Pacific Rice in Egypt Market Volume (Kiloton), by Egypt 2024 & 2032
- Figure 61: Asia Pacific Rice in Egypt Market Revenue Share (%), by Egypt 2024 & 2032
- Figure 62: Asia Pacific Rice in Egypt Market Volume Share (%), by Egypt 2024 & 2032
- Figure 63: Asia Pacific Rice in Egypt Market Revenue (Million), by Country 2024 & 2032
- Figure 64: Asia Pacific Rice in Egypt Market Volume (Kiloton), by Country 2024 & 2032
- Figure 65: Asia Pacific Rice in Egypt Market Revenue Share (%), by Country 2024 & 2032
- Figure 66: Asia Pacific Rice in Egypt Market Volume Share (%), by Country 2024 & 2032
List of Tables
- Table 1: Global Rice in Egypt Market Revenue Million Forecast, by Region 2019 & 2032
- Table 2: Global Rice in Egypt Market Volume Kiloton Forecast, by Region 2019 & 2032
- Table 3: Global Rice in Egypt Market Revenue Million Forecast, by Egypt 2019 & 2032
- Table 4: Global Rice in Egypt Market Volume Kiloton Forecast, by Egypt 2019 & 2032
- Table 5: Global Rice in Egypt Market Revenue Million Forecast, by Egypt 2019 & 2032
- Table 6: Global Rice in Egypt Market Volume Kiloton Forecast, by Egypt 2019 & 2032
- Table 7: Global Rice in Egypt Market Revenue Million Forecast, by Region 2019 & 2032
- Table 8: Global Rice in Egypt Market Volume Kiloton Forecast, by Region 2019 & 2032
- Table 9: Global Rice in Egypt Market Revenue Million Forecast, by Country 2019 & 2032
- Table 10: Global Rice in Egypt Market Volume Kiloton Forecast, by Country 2019 & 2032
- Table 11: Global Rice in Egypt Market Revenue Million Forecast, by Egypt 2019 & 2032
- Table 12: Global Rice in Egypt Market Volume Kiloton Forecast, by Egypt 2019 & 2032
- Table 13: Global Rice in Egypt Market Revenue Million Forecast, by Egypt 2019 & 2032
- Table 14: Global Rice in Egypt Market Volume Kiloton Forecast, by Egypt 2019 & 2032
- Table 15: Global Rice in Egypt Market Revenue Million Forecast, by Country 2019 & 2032
- Table 16: Global Rice in Egypt Market Volume Kiloton Forecast, by Country 2019 & 2032
- Table 17: United States Rice in Egypt Market Revenue (Million) Forecast, by Application 2019 & 2032
- Table 18: United States Rice in Egypt Market Volume (Kiloton) Forecast, by Application 2019 & 2032
- Table 19: Canada Rice in Egypt Market Revenue (Million) Forecast, by Application 2019 & 2032
- Table 20: Canada Rice in Egypt Market Volume (Kiloton) Forecast, by Application 2019 & 2032
- Table 21: Mexico Rice in Egypt Market Revenue (Million) Forecast, by Application 2019 & 2032
- Table 22: Mexico Rice in Egypt Market Volume (Kiloton) Forecast, by Application 2019 & 2032
- Table 23: Global Rice in Egypt Market Revenue Million Forecast, by Egypt 2019 & 2032
- Table 24: Global Rice in Egypt Market Volume Kiloton Forecast, by Egypt 2019 & 2032
- Table 25: Global Rice in Egypt Market Revenue Million Forecast, by Egypt 2019 & 2032
- Table 26: Global Rice in Egypt Market Volume Kiloton Forecast, by Egypt 2019 & 2032
- Table 27: Global Rice in Egypt Market Revenue Million Forecast, by Country 2019 & 2032
- Table 28: Global Rice in Egypt Market Volume Kiloton Forecast, by Country 2019 & 2032
- Table 29: Brazil Rice in Egypt Market Revenue (Million) Forecast, by Application 2019 & 2032
- Table 30: Brazil Rice in Egypt Market Volume (Kiloton) Forecast, by Application 2019 & 2032
- Table 31: Argentina Rice in Egypt Market Revenue (Million) Forecast, by Application 2019 & 2032
- Table 32: Argentina Rice in Egypt Market Volume (Kiloton) Forecast, by Application 2019 & 2032
- Table 33: Rest of South America Rice in Egypt Market Revenue (Million) Forecast, by Application 2019 & 2032
- Table 34: Rest of South America Rice in Egypt Market Volume (Kiloton) Forecast, by Application 2019 & 2032
- Table 35: Global Rice in Egypt Market Revenue Million Forecast, by Egypt 2019 & 2032
- Table 36: Global Rice in Egypt Market Volume Kiloton Forecast, by Egypt 2019 & 2032
- Table 37: Global Rice in Egypt Market Revenue Million Forecast, by Egypt 2019 & 2032
- Table 38: Global Rice in Egypt Market Volume Kiloton Forecast, by Egypt 2019 & 2032
- Table 39: Global Rice in Egypt Market Revenue Million Forecast, by Country 2019 & 2032
- Table 40: Global Rice in Egypt Market Volume Kiloton Forecast, by Country 2019 & 2032
- Table 41: United Kingdom Rice in Egypt Market Revenue (Million) Forecast, by Application 2019 & 2032
- Table 42: United Kingdom Rice in Egypt Market Volume (Kiloton) Forecast, by Application 2019 & 2032
- Table 43: Germany Rice in Egypt Market Revenue (Million) Forecast, by Application 2019 & 2032
- Table 44: Germany Rice in Egypt Market Volume (Kiloton) Forecast, by Application 2019 & 2032
- Table 45: France Rice in Egypt Market Revenue (Million) Forecast, by Application 2019 & 2032
- Table 46: France Rice in Egypt Market Volume (Kiloton) Forecast, by Application 2019 & 2032
- Table 47: Italy Rice in Egypt Market Revenue (Million) Forecast, by Application 2019 & 2032
- Table 48: Italy Rice in Egypt Market Volume (Kiloton) Forecast, by Application 2019 & 2032
- Table 49: Spain Rice in Egypt Market Revenue (Million) Forecast, by Application 2019 & 2032
- Table 50: Spain Rice in Egypt Market Volume (Kiloton) Forecast, by Application 2019 & 2032
- Table 51: Russia Rice in Egypt Market Revenue (Million) Forecast, by Application 2019 & 2032
- Table 52: Russia Rice in Egypt Market Volume (Kiloton) Forecast, by Application 2019 & 2032
- Table 53: Benelux Rice in Egypt Market Revenue (Million) Forecast, by Application 2019 & 2032
- Table 54: Benelux Rice in Egypt Market Volume (Kiloton) Forecast, by Application 2019 & 2032
- Table 55: Nordics Rice in Egypt Market Revenue (Million) Forecast, by Application 2019 & 2032
- Table 56: Nordics Rice in Egypt Market Volume (Kiloton) Forecast, by Application 2019 & 2032
- Table 57: Rest of Europe Rice in Egypt Market Revenue (Million) Forecast, by Application 2019 & 2032
- Table 58: Rest of Europe Rice in Egypt Market Volume (Kiloton) Forecast, by Application 2019 & 2032
- Table 59: Global Rice in Egypt Market Revenue Million Forecast, by Egypt 2019 & 2032
- Table 60: Global Rice in Egypt Market Volume Kiloton Forecast, by Egypt 2019 & 2032
- Table 61: Global Rice in Egypt Market Revenue Million Forecast, by Egypt 2019 & 2032
- Table 62: Global Rice in Egypt Market Volume Kiloton Forecast, by Egypt 2019 & 2032
- Table 63: Global Rice in Egypt Market Revenue Million Forecast, by Country 2019 & 2032
- Table 64: Global Rice in Egypt Market Volume Kiloton Forecast, by Country 2019 & 2032
- Table 65: Turkey Rice in Egypt Market Revenue (Million) Forecast, by Application 2019 & 2032
- Table 66: Turkey Rice in Egypt Market Volume (Kiloton) Forecast, by Application 2019 & 2032
- Table 67: Israel Rice in Egypt Market Revenue (Million) Forecast, by Application 2019 & 2032
- Table 68: Israel Rice in Egypt Market Volume (Kiloton) Forecast, by Application 2019 & 2032
- Table 69: GCC Rice in Egypt Market Revenue (Million) Forecast, by Application 2019 & 2032
- Table 70: GCC Rice in Egypt Market Volume (Kiloton) Forecast, by Application 2019 & 2032
- Table 71: North Africa Rice in Egypt Market Revenue (Million) Forecast, by Application 2019 & 2032
- Table 72: North Africa Rice in Egypt Market Volume (Kiloton) Forecast, by Application 2019 & 2032
- Table 73: South Africa Rice in Egypt Market Revenue (Million) Forecast, by Application 2019 & 2032
- Table 74: South Africa Rice in Egypt Market Volume (Kiloton) Forecast, by Application 2019 & 2032
- Table 75: Rest of Middle East & Africa Rice in Egypt Market Revenue (Million) Forecast, by Application 2019 & 2032
- Table 76: Rest of Middle East & Africa Rice in Egypt Market Volume (Kiloton) Forecast, by Application 2019 & 2032
- Table 77: Global Rice in Egypt Market Revenue Million Forecast, by Egypt 2019 & 2032
- Table 78: Global Rice in Egypt Market Volume Kiloton Forecast, by Egypt 2019 & 2032
- Table 79: Global Rice in Egypt Market Revenue Million Forecast, by Egypt 2019 & 2032
- Table 80: Global Rice in Egypt Market Volume Kiloton Forecast, by Egypt 2019 & 2032
- Table 81: Global Rice in Egypt Market Revenue Million Forecast, by Country 2019 & 2032
- Table 82: Global Rice in Egypt Market Volume Kiloton Forecast, by Country 2019 & 2032
- Table 83: China Rice in Egypt Market Revenue (Million) Forecast, by Application 2019 & 2032
- Table 84: China Rice in Egypt Market Volume (Kiloton) Forecast, by Application 2019 & 2032
- Table 85: India Rice in Egypt Market Revenue (Million) Forecast, by Application 2019 & 2032
- Table 86: India Rice in Egypt Market Volume (Kiloton) Forecast, by Application 2019 & 2032
- Table 87: Japan Rice in Egypt Market Revenue (Million) Forecast, by Application 2019 & 2032
- Table 88: Japan Rice in Egypt Market Volume (Kiloton) Forecast, by Application 2019 & 2032
- Table 89: South Korea Rice in Egypt Market Revenue (Million) Forecast, by Application 2019 & 2032
- Table 90: South Korea Rice in Egypt Market Volume (Kiloton) Forecast, by Application 2019 & 2032
- Table 91: ASEAN Rice in Egypt Market Revenue (Million) Forecast, by Application 2019 & 2032
- Table 92: ASEAN Rice in Egypt Market Volume (Kiloton) Forecast, by Application 2019 & 2032
- Table 93: Oceania Rice in Egypt Market Revenue (Million) Forecast, by Application 2019 & 2032
- Table 94: Oceania Rice in Egypt Market Volume (Kiloton) Forecast, by Application 2019 & 2032
- Table 95: Rest of Asia Pacific Rice in Egypt Market Revenue (Million) Forecast, by Application 2019 & 2032
- Table 96: Rest of Asia Pacific Rice in Egypt Market Volume (Kiloton) Forecast, by Application 2019 & 2032
Frequently Asked Questions
1. What is the projected Compound Annual Growth Rate (CAGR) of the Rice in Egypt Market?
The projected CAGR is approximately 6.88%.
2. Which companies are prominent players in the Rice in Egypt Market?
Key companies in the market include Lotus Food Industries, Edfina Company for Rice Cultivation and Milling, Egyptian Group Company for Agriculture and Food Industries , El Shams Rice Mills, Modern Food Industries.
3. What are the main segments of the Rice in Egypt Market?
The market segments include Egypt, Egypt.
4. Can you provide details about the market size?
The market size is estimated to be USD 1.95 Million as of 2022.
5. What are some drivers contributing to market growth?
Rising Consumption of Cashew Nuts in the Country; Favorable Government Initiatives.
6. What are the notable trends driving market growth?
Increase in demand of rice due to rising population.
7. Are there any restraints impacting market growth?
Hazardous Climatic Condition Hinders Cashew Production; Stringent Regulations Related to Food Quality Standards.
8. Can you provide examples of recent developments in the market?
November 2022: The Rice Farmers Association of Nigeria signed a memorandum of understanding with Tiamin Rice Company (Egypt) for processing and selling rice locally and internationally.
9. What pricing options are available for accessing the report?
Pricing options include single-user, multi-user, and enterprise licenses priced at USD 3800, USD 4500, and USD 5800 respectively.
10. Is the market size provided in terms of value or volume?
The market size is provided in terms of value, measured in Million and volume, measured in Kiloton.
11. Are there any specific market keywords associated with the report?
Yes, the market keyword associated with the report is "Rice in Egypt Market," which aids in identifying and referencing the specific market segment covered.
12. How do I determine which pricing option suits my needs best?
The pricing options vary based on user requirements and access needs. Individual users may opt for single-user licenses, while businesses requiring broader access may choose multi-user or enterprise licenses for cost-effective access to the report.
13. Are there any additional resources or data provided in the Rice in Egypt Market report?
While the report offers comprehensive insights, it's advisable to review the specific contents or supplementary materials provided to ascertain if additional resources or data are available.
14. How can I stay updated on further developments or reports in the Rice in Egypt Market?
To stay informed about further developments, trends, and reports in the Rice in Egypt Market, consider subscribing to industry newsletters, following relevant companies and organizations, or regularly checking reputable industry news sources and publications.
Methodology
Step 1 - Identification of Relevant Samples Size from Population Database


Step 2 - Approaches for Defining Global Market Size (Value, Volume* & Price*)

Note*: In applicable scenarios
Step 3 - Data Sources
Primary Research
- Web Analytics
- Survey Reports
- Research Institute
- Latest Research Reports
- Opinion Leaders
Secondary Research
- Annual Reports
- White Paper
- Latest Press Release
- Industry Association
- Paid Database
- Investor Presentations

Step 4 - Data Triangulation
Involves using different sources of information in order to increase the validity of a study
These sources are likely to be stakeholders in a program - participants, other researchers, program staff, other community members, and so on.
Then we put all data in single framework & apply various statistical tools to find out the dynamic on the market.
During the analysis stage, feedback from the stakeholder groups would be compared to determine areas of agreement as well as areas of divergence


