

Key Insights
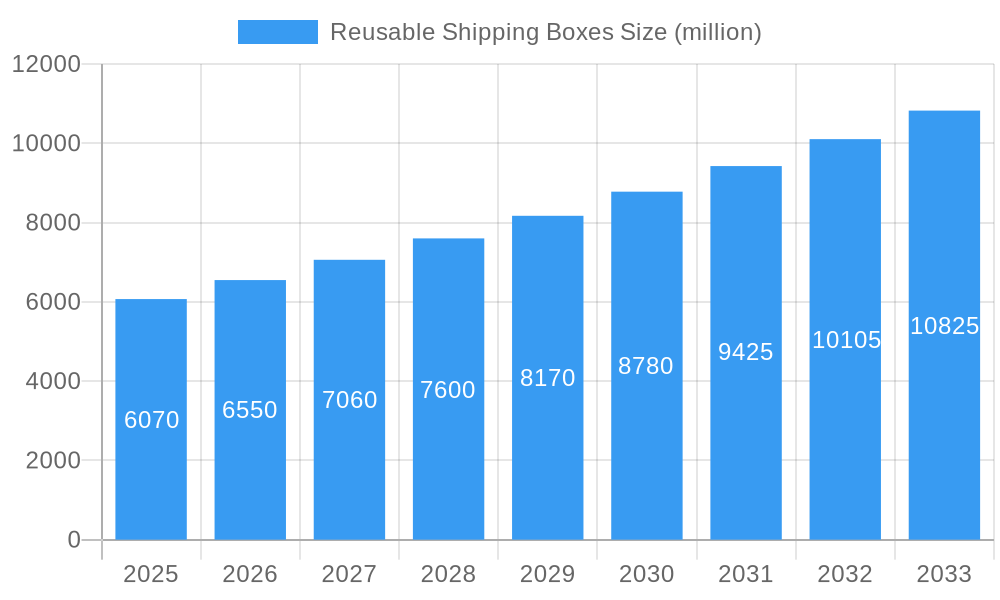
The reusable shipping box market is experiencing robust growth, driven by increasing environmental concerns, rising e-commerce activity, and a growing focus on sustainable packaging solutions. The market, estimated at $5 billion in 2025, is projected to expand at a Compound Annual Growth Rate (CAGR) of 8% from 2025 to 2033, reaching approximately $10 billion by 2033. This growth is fueled by the rising costs associated with single-use packaging, stricter environmental regulations, and the increasing demand for efficient and eco-friendly logistics solutions across various industries, including e-commerce, food and beverage, and pharmaceuticals. Key market players such as Returnity Innovations, Amatech, and TerraCycle are driving innovation through the development of durable, reusable boxes and optimized supply chain models. The adoption of advanced technologies like RFID tracking and intelligent routing systems enhances efficiency and traceability, further contributing to market expansion.
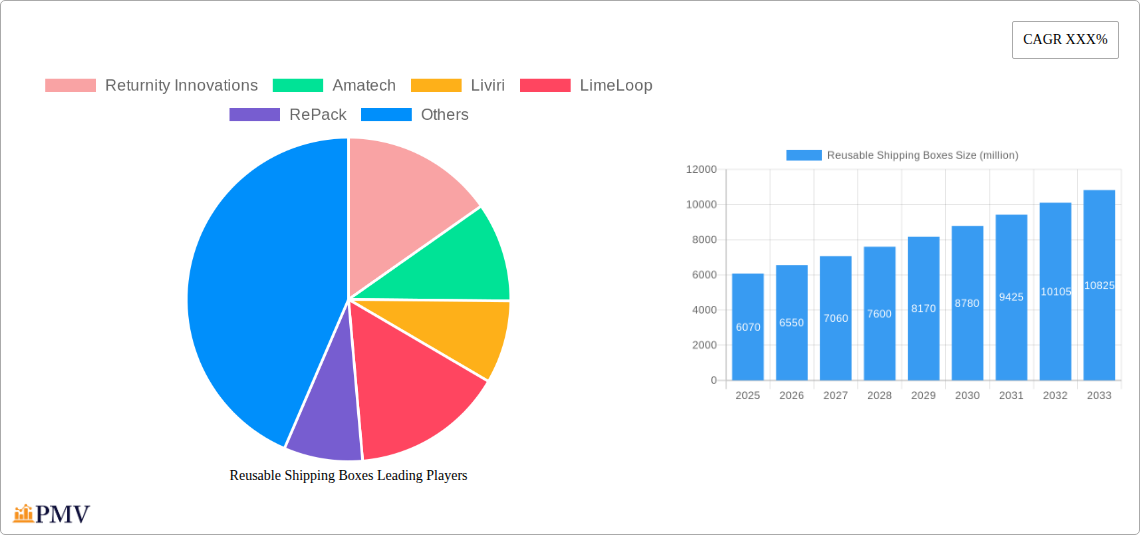
Reusable Shipping Boxes Market Size (In Billion)
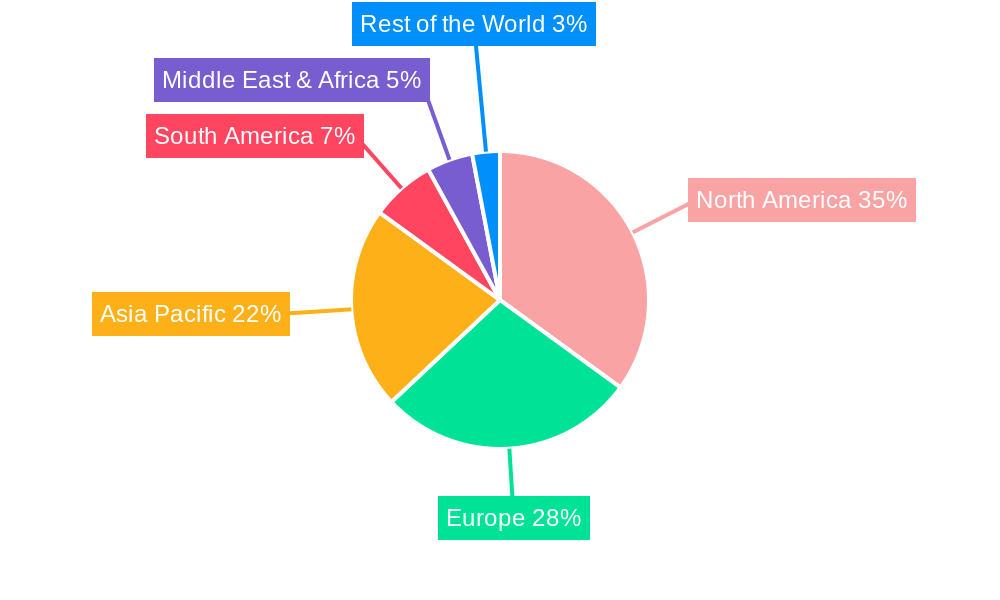
Significant regional variations are expected, with North America and Europe currently dominating the market due to their advanced logistics infrastructure and strong environmental regulations. However, Asia-Pacific is poised for substantial growth, driven by increasing industrialization and rising e-commerce penetration. Market segmentation reveals high demand for various box sizes and materials, reflecting the diverse needs of different industries. Challenges remain, including the higher initial investment costs associated with reusable box systems and the need for efficient cleaning and sanitization processes. However, the long-term cost savings and environmental benefits are compelling businesses to adopt reusable packaging solutions, thereby contributing to the overall market expansion. The increasing awareness of plastic pollution and the implementation of sustainable packaging initiatives by governments globally will accelerate the adoption rate of reusable shipping boxes further in the forecast period.
Reusable Shipping Boxes Company Market Share
Reusable Shipping Boxes Market Report: 2019-2033
This comprehensive report provides an in-depth analysis of the global reusable shipping boxes market, offering invaluable insights for businesses, investors, and stakeholders. The report covers the period from 2019 to 2033, with a base year of 2025 and a forecast period of 2025-2033. The market is projected to reach a value of $xx million by 2033, exhibiting a CAGR of xx% during the forecast period. This detailed study analyzes market structure, competitive dynamics, industry trends, dominant segments, product innovations, and future growth prospects. Millions of dollars are used for all monetary values.
Reusable Shipping Boxes Market Structure & Competitive Dynamics
The global reusable shipping boxes market is characterized by a moderately concentrated landscape with several key players vying for market share. While a few large players dominate, a growing number of smaller, innovative companies are challenging the status quo. The market is witnessing significant M&A activity, with deal values exceeding $xx million in the past five years, driven by the need for consolidation and expansion into new markets. Market concentration is estimated at xx%, with the top five players commanding approximately xx% of the market share in 2024. Innovation ecosystems are dynamic, fueled by advancements in materials science, logistics technology, and sustainable packaging solutions. Regulatory frameworks, such as extended producer responsibility (EPR) schemes, are increasingly influencing market dynamics, promoting the adoption of reusable packaging. Product substitutes, such as single-use cardboard boxes, face growing pressure due to environmental concerns and rising costs. End-user trends towards sustainability and reduced environmental impact are driving market growth.
- Market concentration: xx% (estimated)
- Top 5 players' market share: xx% (estimated)
- Total M&A deal value (2019-2024): > $xx million (estimated)
- Key Regulatory Frameworks: EPR schemes, waste reduction regulations.
Reusable Shipping Boxes Industry Trends & Insights
The reusable shipping boxes market is experiencing robust growth fueled by several key factors. The increasing awareness of environmental sustainability is driving demand for eco-friendly packaging solutions, making reusable boxes a preferred choice over single-use alternatives. E-commerce growth continues to significantly impact this market. The rising demand for efficient and sustainable logistics solutions is also creating growth opportunities. Technological disruptions, such as advancements in material science and the development of intelligent packaging systems with integrated tracking and monitoring capabilities, are further enhancing market prospects. Consumer preferences are shifting towards sustainable products and services, influencing purchasing decisions and boosting market adoption. Competitive dynamics are characterized by intense innovation, strategic partnerships, and a focus on cost optimization and supply chain efficiency. The market penetration of reusable boxes is estimated to reach xx% by 2033.
Dominant Markets & Segments in Reusable Shipping Boxes
North America holds the dominant position in the global reusable shipping boxes market, driven by the presence of major e-commerce players, robust logistics infrastructure, and stringent environmental regulations. Europe is also a significant market, experiencing considerable growth due to increasing environmental awareness and supportive government policies.
Key Drivers in North America:
- High e-commerce penetration
- Strong logistics infrastructure
- Stringent environmental regulations
- High consumer awareness of sustainability
Key Drivers in Europe:
- Growing environmental awareness
- Supportive government policies
- Increasing demand from various industries.
The dominance of these regions is attributed to factors like established e-commerce sectors, advanced logistics networks, stringent environmental regulations, and higher consumer awareness of sustainable packaging options. Market size estimates for the North American and European regions are estimated at $xx million and $xx million respectively by 2033.
Reusable Shipping Boxes Product Innovations
Recent innovations include the development of lightweight, durable, and easily stackable reusable shipping boxes made from recycled materials. Furthermore, the integration of RFID technology and other smart tracking systems is improving supply chain efficiency and enhancing product security. These developments address key market needs for sustainability, cost-effectiveness, and supply chain transparency, giving reusable boxes a competitive advantage over traditional single-use alternatives.
Report Segmentation & Scope
This report segments the reusable shipping boxes market by material type (plastic, metal, etc.), size, application (e-commerce, industrial goods, etc.), and geography (North America, Europe, Asia-Pacific, etc.). Each segment showcases distinct growth projections, market sizes, and competitive dynamics. For instance, the plastic segment is predicted to hold the largest market share due to its versatility and cost-effectiveness, while the e-commerce sector is projected to exhibit the highest growth rate. Detailed analyses of each segment are presented in the full report.
Key Drivers of Reusable Shipping Boxes Growth
The growth of the reusable shipping boxes market is driven by several factors: increasing environmental concerns leading to stricter regulations on single-use packaging; rising demand for sustainable and eco-friendly products; increasing e-commerce activities and the subsequent need for efficient packaging solutions; advancements in material science and technology leading to improved durability and cost-effectiveness of reusable boxes; and growing government initiatives and incentives to promote sustainable packaging solutions.
Challenges in the Reusable Shipping Boxes Sector
Significant challenges remain: the higher initial cost of reusable boxes compared to their single-use counterparts; the need for robust return and cleaning systems to maintain hygiene and quality; potential complexities in managing reverse logistics; and the potential for damage or loss of boxes during transportation and handling, impacting overall cost-effectiveness. These challenges need to be addressed to accelerate wider market adoption.
Leading Players in the Reusable Shipping Boxes Market
- Returnity Innovations
- Amatech
- Liviri
- LimeLoop
- RePack
- TerraCycle
- Temple-Inland
- Reuse-Rethinking Packaging
- Salazar
- International Paper
- Crown Holdings
- Amcor
- Rentacrate enterprises
- BungoBox
Key Developments in Reusable Shipping Boxes Sector
- 2022 Q4: Returnity Innovations launches a new line of durable, stackable reusable shipping containers.
- 2023 Q1: Amcor invests $xx million in expanding its reusable packaging manufacturing capacity.
- 2023 Q2: A major e-commerce company partners with LimeLoop to implement a large-scale reusable packaging program.
- (Further key developments will be included in the full report)
Strategic Reusable Shipping Boxes Market Outlook
The future of the reusable shipping boxes market looks promising. Continued growth in e-commerce, heightened environmental awareness, and technological advancements will drive increased demand. Strategic opportunities exist in developing innovative materials, improving supply chain efficiency, and expanding into new markets. Companies that can successfully address the challenges associated with reusable packaging, such as implementing effective reverse logistics systems, will be best positioned for long-term success.
Reusable Shipping Boxes Segmentation
-
1. Application
- 1.1. Food Industry
- 1.2. Transportation Industry
- 1.3. Others
-
2. Type
- 2.1. Plastic
- 2.2. Cardboard
- 2.3. Others
Reusable Shipping Boxes Segmentation By Geography
-
1. North America
- 1.1. United States
- 1.2. Canada
- 1.3. Mexico
-
2. South America
- 2.1. Brazil
- 2.2. Argentina
- 2.3. Rest of South America
-
3. Europe
- 3.1. United Kingdom
- 3.2. Germany
- 3.3. France
- 3.4. Italy
- 3.5. Spain
- 3.6. Russia
- 3.7. Benelux
- 3.8. Nordics
- 3.9. Rest of Europe
-
4. Middle East & Africa
- 4.1. Turkey
- 4.2. Israel
- 4.3. GCC
- 4.4. North Africa
- 4.5. South Africa
- 4.6. Rest of Middle East & Africa
-
5. Asia Pacific
- 5.1. China
- 5.2. India
- 5.3. Japan
- 5.4. South Korea
- 5.5. ASEAN
- 5.6. Oceania
- 5.7. Rest of Asia Pacific
Reusable Shipping Boxes Regional Market Share
Geographic Coverage of Reusable Shipping Boxes
Reusable Shipping Boxes REPORT HIGHLIGHTS
| Aspects | Details |
|---|---|
| Study Period | 2020-2034 |
| Base Year | 2025 |
| Estimated Year | 2026 |
| Forecast Period | 2026-2034 |
| Historical Period | 2020-2025 |
| Growth Rate | CAGR of 5.8% from 2020-2034 |
| Segmentation |
|
Table of Contents
- 1. Introduction
- 1.1. Research Scope
- 1.2. Market Segmentation
- 1.3. Research Methodology
- 1.4. Definitions and Assumptions
- 2. Executive Summary
- 2.1. Introduction
- 3. Market Dynamics
- 3.1. Introduction
- 3.2. Market Drivers
- 3.3. Market Restrains
- 3.4. Market Trends
- 4. Market Factor Analysis
- 4.1. Porters Five Forces
- 4.2. Supply/Value Chain
- 4.3. PESTEL analysis
- 4.4. Market Entropy
- 4.5. Patent/Trademark Analysis
- 5. Global Reusable Shipping Boxes Analysis, Insights and Forecast, 2020-2032
- 5.1. Market Analysis, Insights and Forecast - by Application
- 5.1.1. Food Industry
- 5.1.2. Transportation Industry
- 5.1.3. Others
- 5.2. Market Analysis, Insights and Forecast - by Type
- 5.2.1. Plastic
- 5.2.2. Cardboard
- 5.2.3. Others
- 5.3. Market Analysis, Insights and Forecast - by Region
- 5.3.1. North America
- 5.3.2. South America
- 5.3.3. Europe
- 5.3.4. Middle East & Africa
- 5.3.5. Asia Pacific
- 5.1. Market Analysis, Insights and Forecast - by Application
- 6. North America Reusable Shipping Boxes Analysis, Insights and Forecast, 2020-2032
- 6.1. Market Analysis, Insights and Forecast - by Application
- 6.1.1. Food Industry
- 6.1.2. Transportation Industry
- 6.1.3. Others
- 6.2. Market Analysis, Insights and Forecast - by Type
- 6.2.1. Plastic
- 6.2.2. Cardboard
- 6.2.3. Others
- 6.1. Market Analysis, Insights and Forecast - by Application
- 7. South America Reusable Shipping Boxes Analysis, Insights and Forecast, 2020-2032
- 7.1. Market Analysis, Insights and Forecast - by Application
- 7.1.1. Food Industry
- 7.1.2. Transportation Industry
- 7.1.3. Others
- 7.2. Market Analysis, Insights and Forecast - by Type
- 7.2.1. Plastic
- 7.2.2. Cardboard
- 7.2.3. Others
- 7.1. Market Analysis, Insights and Forecast - by Application
- 8. Europe Reusable Shipping Boxes Analysis, Insights and Forecast, 2020-2032
- 8.1. Market Analysis, Insights and Forecast - by Application
- 8.1.1. Food Industry
- 8.1.2. Transportation Industry
- 8.1.3. Others
- 8.2. Market Analysis, Insights and Forecast - by Type
- 8.2.1. Plastic
- 8.2.2. Cardboard
- 8.2.3. Others
- 8.1. Market Analysis, Insights and Forecast - by Application
- 9. Middle East & Africa Reusable Shipping Boxes Analysis, Insights and Forecast, 2020-2032
- 9.1. Market Analysis, Insights and Forecast - by Application
- 9.1.1. Food Industry
- 9.1.2. Transportation Industry
- 9.1.3. Others
- 9.2. Market Analysis, Insights and Forecast - by Type
- 9.2.1. Plastic
- 9.2.2. Cardboard
- 9.2.3. Others
- 9.1. Market Analysis, Insights and Forecast - by Application
- 10. Asia Pacific Reusable Shipping Boxes Analysis, Insights and Forecast, 2020-2032
- 10.1. Market Analysis, Insights and Forecast - by Application
- 10.1.1. Food Industry
- 10.1.2. Transportation Industry
- 10.1.3. Others
- 10.2. Market Analysis, Insights and Forecast - by Type
- 10.2.1. Plastic
- 10.2.2. Cardboard
- 10.2.3. Others
- 10.1. Market Analysis, Insights and Forecast - by Application
- 11. Competitive Analysis
- 11.1. Global Market Share Analysis 2025
- 11.2. Company Profiles
- 11.2.1 Returnity Innovations
- 11.2.1.1. Overview
- 11.2.1.2. Products
- 11.2.1.3. SWOT Analysis
- 11.2.1.4. Recent Developments
- 11.2.1.5. Financials (Based on Availability)
- 11.2.2 Amatech
- 11.2.2.1. Overview
- 11.2.2.2. Products
- 11.2.2.3. SWOT Analysis
- 11.2.2.4. Recent Developments
- 11.2.2.5. Financials (Based on Availability)
- 11.2.3 Liviri
- 11.2.3.1. Overview
- 11.2.3.2. Products
- 11.2.3.3. SWOT Analysis
- 11.2.3.4. Recent Developments
- 11.2.3.5. Financials (Based on Availability)
- 11.2.4 LimeLoop
- 11.2.4.1. Overview
- 11.2.4.2. Products
- 11.2.4.3. SWOT Analysis
- 11.2.4.4. Recent Developments
- 11.2.4.5. Financials (Based on Availability)
- 11.2.5 RePack
- 11.2.5.1. Overview
- 11.2.5.2. Products
- 11.2.5.3. SWOT Analysis
- 11.2.5.4. Recent Developments
- 11.2.5.5. Financials (Based on Availability)
- 11.2.6 TerraCycle
- 11.2.6.1. Overview
- 11.2.6.2. Products
- 11.2.6.3. SWOT Analysis
- 11.2.6.4. Recent Developments
- 11.2.6.5. Financials (Based on Availability)
- 11.2.7 Temple- Inland
- 11.2.7.1. Overview
- 11.2.7.2. Products
- 11.2.7.3. SWOT Analysis
- 11.2.7.4. Recent Developments
- 11.2.7.5. Financials (Based on Availability)
- 11.2.8 Reuse- Rethinking Packaging
- 11.2.8.1. Overview
- 11.2.8.2. Products
- 11.2.8.3. SWOT Analysis
- 11.2.8.4. Recent Developments
- 11.2.8.5. Financials (Based on Availability)
- 11.2.9 Salazar
- 11.2.9.1. Overview
- 11.2.9.2. Products
- 11.2.9.3. SWOT Analysis
- 11.2.9.4. Recent Developments
- 11.2.9.5. Financials (Based on Availability)
- 11.2.10 International Paper
- 11.2.10.1. Overview
- 11.2.10.2. Products
- 11.2.10.3. SWOT Analysis
- 11.2.10.4. Recent Developments
- 11.2.10.5. Financials (Based on Availability)
- 11.2.11 Crown Holdings
- 11.2.11.1. Overview
- 11.2.11.2. Products
- 11.2.11.3. SWOT Analysis
- 11.2.11.4. Recent Developments
- 11.2.11.5. Financials (Based on Availability)
- 11.2.12 Amcor
- 11.2.12.1. Overview
- 11.2.12.2. Products
- 11.2.12.3. SWOT Analysis
- 11.2.12.4. Recent Developments
- 11.2.12.5. Financials (Based on Availability)
- 11.2.13 Rentacrate enterprises
- 11.2.13.1. Overview
- 11.2.13.2. Products
- 11.2.13.3. SWOT Analysis
- 11.2.13.4. Recent Developments
- 11.2.13.5. Financials (Based on Availability)
- 11.2.14 BungoBox
- 11.2.14.1. Overview
- 11.2.14.2. Products
- 11.2.14.3. SWOT Analysis
- 11.2.14.4. Recent Developments
- 11.2.14.5. Financials (Based on Availability)
- 11.2.1 Returnity Innovations
List of Figures
- Figure 1: Global Reusable Shipping Boxes Revenue Breakdown (undefined, %) by Region 2025 & 2033
- Figure 2: Global Reusable Shipping Boxes Volume Breakdown (K, %) by Region 2025 & 2033
- Figure 3: North America Reusable Shipping Boxes Revenue (undefined), by Application 2025 & 2033
- Figure 4: North America Reusable Shipping Boxes Volume (K), by Application 2025 & 2033
- Figure 5: North America Reusable Shipping Boxes Revenue Share (%), by Application 2025 & 2033
- Figure 6: North America Reusable Shipping Boxes Volume Share (%), by Application 2025 & 2033
- Figure 7: North America Reusable Shipping Boxes Revenue (undefined), by Type 2025 & 2033
- Figure 8: North America Reusable Shipping Boxes Volume (K), by Type 2025 & 2033
- Figure 9: North America Reusable Shipping Boxes Revenue Share (%), by Type 2025 & 2033
- Figure 10: North America Reusable Shipping Boxes Volume Share (%), by Type 2025 & 2033
- Figure 11: North America Reusable Shipping Boxes Revenue (undefined), by Country 2025 & 2033
- Figure 12: North America Reusable Shipping Boxes Volume (K), by Country 2025 & 2033
- Figure 13: North America Reusable Shipping Boxes Revenue Share (%), by Country 2025 & 2033
- Figure 14: North America Reusable Shipping Boxes Volume Share (%), by Country 2025 & 2033
- Figure 15: South America Reusable Shipping Boxes Revenue (undefined), by Application 2025 & 2033
- Figure 16: South America Reusable Shipping Boxes Volume (K), by Application 2025 & 2033
- Figure 17: South America Reusable Shipping Boxes Revenue Share (%), by Application 2025 & 2033
- Figure 18: South America Reusable Shipping Boxes Volume Share (%), by Application 2025 & 2033
- Figure 19: South America Reusable Shipping Boxes Revenue (undefined), by Type 2025 & 2033
- Figure 20: South America Reusable Shipping Boxes Volume (K), by Type 2025 & 2033
- Figure 21: South America Reusable Shipping Boxes Revenue Share (%), by Type 2025 & 2033
- Figure 22: South America Reusable Shipping Boxes Volume Share (%), by Type 2025 & 2033
- Figure 23: South America Reusable Shipping Boxes Revenue (undefined), by Country 2025 & 2033
- Figure 24: South America Reusable Shipping Boxes Volume (K), by Country 2025 & 2033
- Figure 25: South America Reusable Shipping Boxes Revenue Share (%), by Country 2025 & 2033
- Figure 26: South America Reusable Shipping Boxes Volume Share (%), by Country 2025 & 2033
- Figure 27: Europe Reusable Shipping Boxes Revenue (undefined), by Application 2025 & 2033
- Figure 28: Europe Reusable Shipping Boxes Volume (K), by Application 2025 & 2033
- Figure 29: Europe Reusable Shipping Boxes Revenue Share (%), by Application 2025 & 2033
- Figure 30: Europe Reusable Shipping Boxes Volume Share (%), by Application 2025 & 2033
- Figure 31: Europe Reusable Shipping Boxes Revenue (undefined), by Type 2025 & 2033
- Figure 32: Europe Reusable Shipping Boxes Volume (K), by Type 2025 & 2033
- Figure 33: Europe Reusable Shipping Boxes Revenue Share (%), by Type 2025 & 2033
- Figure 34: Europe Reusable Shipping Boxes Volume Share (%), by Type 2025 & 2033
- Figure 35: Europe Reusable Shipping Boxes Revenue (undefined), by Country 2025 & 2033
- Figure 36: Europe Reusable Shipping Boxes Volume (K), by Country 2025 & 2033
- Figure 37: Europe Reusable Shipping Boxes Revenue Share (%), by Country 2025 & 2033
- Figure 38: Europe Reusable Shipping Boxes Volume Share (%), by Country 2025 & 2033
- Figure 39: Middle East & Africa Reusable Shipping Boxes Revenue (undefined), by Application 2025 & 2033
- Figure 40: Middle East & Africa Reusable Shipping Boxes Volume (K), by Application 2025 & 2033
- Figure 41: Middle East & Africa Reusable Shipping Boxes Revenue Share (%), by Application 2025 & 2033
- Figure 42: Middle East & Africa Reusable Shipping Boxes Volume Share (%), by Application 2025 & 2033
- Figure 43: Middle East & Africa Reusable Shipping Boxes Revenue (undefined), by Type 2025 & 2033
- Figure 44: Middle East & Africa Reusable Shipping Boxes Volume (K), by Type 2025 & 2033
- Figure 45: Middle East & Africa Reusable Shipping Boxes Revenue Share (%), by Type 2025 & 2033
- Figure 46: Middle East & Africa Reusable Shipping Boxes Volume Share (%), by Type 2025 & 2033
- Figure 47: Middle East & Africa Reusable Shipping Boxes Revenue (undefined), by Country 2025 & 2033
- Figure 48: Middle East & Africa Reusable Shipping Boxes Volume (K), by Country 2025 & 2033
- Figure 49: Middle East & Africa Reusable Shipping Boxes Revenue Share (%), by Country 2025 & 2033
- Figure 50: Middle East & Africa Reusable Shipping Boxes Volume Share (%), by Country 2025 & 2033
- Figure 51: Asia Pacific Reusable Shipping Boxes Revenue (undefined), by Application 2025 & 2033
- Figure 52: Asia Pacific Reusable Shipping Boxes Volume (K), by Application 2025 & 2033
- Figure 53: Asia Pacific Reusable Shipping Boxes Revenue Share (%), by Application 2025 & 2033
- Figure 54: Asia Pacific Reusable Shipping Boxes Volume Share (%), by Application 2025 & 2033
- Figure 55: Asia Pacific Reusable Shipping Boxes Revenue (undefined), by Type 2025 & 2033
- Figure 56: Asia Pacific Reusable Shipping Boxes Volume (K), by Type 2025 & 2033
- Figure 57: Asia Pacific Reusable Shipping Boxes Revenue Share (%), by Type 2025 & 2033
- Figure 58: Asia Pacific Reusable Shipping Boxes Volume Share (%), by Type 2025 & 2033
- Figure 59: Asia Pacific Reusable Shipping Boxes Revenue (undefined), by Country 2025 & 2033
- Figure 60: Asia Pacific Reusable Shipping Boxes Volume (K), by Country 2025 & 2033
- Figure 61: Asia Pacific Reusable Shipping Boxes Revenue Share (%), by Country 2025 & 2033
- Figure 62: Asia Pacific Reusable Shipping Boxes Volume Share (%), by Country 2025 & 2033
List of Tables
- Table 1: Global Reusable Shipping Boxes Revenue undefined Forecast, by Application 2020 & 2033
- Table 2: Global Reusable Shipping Boxes Volume K Forecast, by Application 2020 & 2033
- Table 3: Global Reusable Shipping Boxes Revenue undefined Forecast, by Type 2020 & 2033
- Table 4: Global Reusable Shipping Boxes Volume K Forecast, by Type 2020 & 2033
- Table 5: Global Reusable Shipping Boxes Revenue undefined Forecast, by Region 2020 & 2033
- Table 6: Global Reusable Shipping Boxes Volume K Forecast, by Region 2020 & 2033
- Table 7: Global Reusable Shipping Boxes Revenue undefined Forecast, by Application 2020 & 2033
- Table 8: Global Reusable Shipping Boxes Volume K Forecast, by Application 2020 & 2033
- Table 9: Global Reusable Shipping Boxes Revenue undefined Forecast, by Type 2020 & 2033
- Table 10: Global Reusable Shipping Boxes Volume K Forecast, by Type 2020 & 2033
- Table 11: Global Reusable Shipping Boxes Revenue undefined Forecast, by Country 2020 & 2033
- Table 12: Global Reusable Shipping Boxes Volume K Forecast, by Country 2020 & 2033
- Table 13: United States Reusable Shipping Boxes Revenue (undefined) Forecast, by Application 2020 & 2033
- Table 14: United States Reusable Shipping Boxes Volume (K) Forecast, by Application 2020 & 2033
- Table 15: Canada Reusable Shipping Boxes Revenue (undefined) Forecast, by Application 2020 & 2033
- Table 16: Canada Reusable Shipping Boxes Volume (K) Forecast, by Application 2020 & 2033
- Table 17: Mexico Reusable Shipping Boxes Revenue (undefined) Forecast, by Application 2020 & 2033
- Table 18: Mexico Reusable Shipping Boxes Volume (K) Forecast, by Application 2020 & 2033
- Table 19: Global Reusable Shipping Boxes Revenue undefined Forecast, by Application 2020 & 2033
- Table 20: Global Reusable Shipping Boxes Volume K Forecast, by Application 2020 & 2033
- Table 21: Global Reusable Shipping Boxes Revenue undefined Forecast, by Type 2020 & 2033
- Table 22: Global Reusable Shipping Boxes Volume K Forecast, by Type 2020 & 2033
- Table 23: Global Reusable Shipping Boxes Revenue undefined Forecast, by Country 2020 & 2033
- Table 24: Global Reusable Shipping Boxes Volume K Forecast, by Country 2020 & 2033
- Table 25: Brazil Reusable Shipping Boxes Revenue (undefined) Forecast, by Application 2020 & 2033
- Table 26: Brazil Reusable Shipping Boxes Volume (K) Forecast, by Application 2020 & 2033
- Table 27: Argentina Reusable Shipping Boxes Revenue (undefined) Forecast, by Application 2020 & 2033
- Table 28: Argentina Reusable Shipping Boxes Volume (K) Forecast, by Application 2020 & 2033
- Table 29: Rest of South America Reusable Shipping Boxes Revenue (undefined) Forecast, by Application 2020 & 2033
- Table 30: Rest of South America Reusable Shipping Boxes Volume (K) Forecast, by Application 2020 & 2033
- Table 31: Global Reusable Shipping Boxes Revenue undefined Forecast, by Application 2020 & 2033
- Table 32: Global Reusable Shipping Boxes Volume K Forecast, by Application 2020 & 2033
- Table 33: Global Reusable Shipping Boxes Revenue undefined Forecast, by Type 2020 & 2033
- Table 34: Global Reusable Shipping Boxes Volume K Forecast, by Type 2020 & 2033
- Table 35: Global Reusable Shipping Boxes Revenue undefined Forecast, by Country 2020 & 2033
- Table 36: Global Reusable Shipping Boxes Volume K Forecast, by Country 2020 & 2033
- Table 37: United Kingdom Reusable Shipping Boxes Revenue (undefined) Forecast, by Application 2020 & 2033
- Table 38: United Kingdom Reusable Shipping Boxes Volume (K) Forecast, by Application 2020 & 2033
- Table 39: Germany Reusable Shipping Boxes Revenue (undefined) Forecast, by Application 2020 & 2033
- Table 40: Germany Reusable Shipping Boxes Volume (K) Forecast, by Application 2020 & 2033
- Table 41: France Reusable Shipping Boxes Revenue (undefined) Forecast, by Application 2020 & 2033
- Table 42: France Reusable Shipping Boxes Volume (K) Forecast, by Application 2020 & 2033
- Table 43: Italy Reusable Shipping Boxes Revenue (undefined) Forecast, by Application 2020 & 2033
- Table 44: Italy Reusable Shipping Boxes Volume (K) Forecast, by Application 2020 & 2033
- Table 45: Spain Reusable Shipping Boxes Revenue (undefined) Forecast, by Application 2020 & 2033
- Table 46: Spain Reusable Shipping Boxes Volume (K) Forecast, by Application 2020 & 2033
- Table 47: Russia Reusable Shipping Boxes Revenue (undefined) Forecast, by Application 2020 & 2033
- Table 48: Russia Reusable Shipping Boxes Volume (K) Forecast, by Application 2020 & 2033
- Table 49: Benelux Reusable Shipping Boxes Revenue (undefined) Forecast, by Application 2020 & 2033
- Table 50: Benelux Reusable Shipping Boxes Volume (K) Forecast, by Application 2020 & 2033
- Table 51: Nordics Reusable Shipping Boxes Revenue (undefined) Forecast, by Application 2020 & 2033
- Table 52: Nordics Reusable Shipping Boxes Volume (K) Forecast, by Application 2020 & 2033
- Table 53: Rest of Europe Reusable Shipping Boxes Revenue (undefined) Forecast, by Application 2020 & 2033
- Table 54: Rest of Europe Reusable Shipping Boxes Volume (K) Forecast, by Application 2020 & 2033
- Table 55: Global Reusable Shipping Boxes Revenue undefined Forecast, by Application 2020 & 2033
- Table 56: Global Reusable Shipping Boxes Volume K Forecast, by Application 2020 & 2033
- Table 57: Global Reusable Shipping Boxes Revenue undefined Forecast, by Type 2020 & 2033
- Table 58: Global Reusable Shipping Boxes Volume K Forecast, by Type 2020 & 2033
- Table 59: Global Reusable Shipping Boxes Revenue undefined Forecast, by Country 2020 & 2033
- Table 60: Global Reusable Shipping Boxes Volume K Forecast, by Country 2020 & 2033
- Table 61: Turkey Reusable Shipping Boxes Revenue (undefined) Forecast, by Application 2020 & 2033
- Table 62: Turkey Reusable Shipping Boxes Volume (K) Forecast, by Application 2020 & 2033
- Table 63: Israel Reusable Shipping Boxes Revenue (undefined) Forecast, by Application 2020 & 2033
- Table 64: Israel Reusable Shipping Boxes Volume (K) Forecast, by Application 2020 & 2033
- Table 65: GCC Reusable Shipping Boxes Revenue (undefined) Forecast, by Application 2020 & 2033
- Table 66: GCC Reusable Shipping Boxes Volume (K) Forecast, by Application 2020 & 2033
- Table 67: North Africa Reusable Shipping Boxes Revenue (undefined) Forecast, by Application 2020 & 2033
- Table 68: North Africa Reusable Shipping Boxes Volume (K) Forecast, by Application 2020 & 2033
- Table 69: South Africa Reusable Shipping Boxes Revenue (undefined) Forecast, by Application 2020 & 2033
- Table 70: South Africa Reusable Shipping Boxes Volume (K) Forecast, by Application 2020 & 2033
- Table 71: Rest of Middle East & Africa Reusable Shipping Boxes Revenue (undefined) Forecast, by Application 2020 & 2033
- Table 72: Rest of Middle East & Africa Reusable Shipping Boxes Volume (K) Forecast, by Application 2020 & 2033
- Table 73: Global Reusable Shipping Boxes Revenue undefined Forecast, by Application 2020 & 2033
- Table 74: Global Reusable Shipping Boxes Volume K Forecast, by Application 2020 & 2033
- Table 75: Global Reusable Shipping Boxes Revenue undefined Forecast, by Type 2020 & 2033
- Table 76: Global Reusable Shipping Boxes Volume K Forecast, by Type 2020 & 2033
- Table 77: Global Reusable Shipping Boxes Revenue undefined Forecast, by Country 2020 & 2033
- Table 78: Global Reusable Shipping Boxes Volume K Forecast, by Country 2020 & 2033
- Table 79: China Reusable Shipping Boxes Revenue (undefined) Forecast, by Application 2020 & 2033
- Table 80: China Reusable Shipping Boxes Volume (K) Forecast, by Application 2020 & 2033
- Table 81: India Reusable Shipping Boxes Revenue (undefined) Forecast, by Application 2020 & 2033
- Table 82: India Reusable Shipping Boxes Volume (K) Forecast, by Application 2020 & 2033
- Table 83: Japan Reusable Shipping Boxes Revenue (undefined) Forecast, by Application 2020 & 2033
- Table 84: Japan Reusable Shipping Boxes Volume (K) Forecast, by Application 2020 & 2033
- Table 85: South Korea Reusable Shipping Boxes Revenue (undefined) Forecast, by Application 2020 & 2033
- Table 86: South Korea Reusable Shipping Boxes Volume (K) Forecast, by Application 2020 & 2033
- Table 87: ASEAN Reusable Shipping Boxes Revenue (undefined) Forecast, by Application 2020 & 2033
- Table 88: ASEAN Reusable Shipping Boxes Volume (K) Forecast, by Application 2020 & 2033
- Table 89: Oceania Reusable Shipping Boxes Revenue (undefined) Forecast, by Application 2020 & 2033
- Table 90: Oceania Reusable Shipping Boxes Volume (K) Forecast, by Application 2020 & 2033
- Table 91: Rest of Asia Pacific Reusable Shipping Boxes Revenue (undefined) Forecast, by Application 2020 & 2033
- Table 92: Rest of Asia Pacific Reusable Shipping Boxes Volume (K) Forecast, by Application 2020 & 2033
Frequently Asked Questions
1. What is the projected Compound Annual Growth Rate (CAGR) of the Reusable Shipping Boxes?
The projected CAGR is approximately 5.8%.
2. Which companies are prominent players in the Reusable Shipping Boxes?
Key companies in the market include Returnity Innovations, Amatech, Liviri, LimeLoop, RePack, TerraCycle, Temple- Inland, Reuse- Rethinking Packaging, Salazar, International Paper, Crown Holdings, Amcor, Rentacrate enterprises, BungoBox.
3. What are the main segments of the Reusable Shipping Boxes?
The market segments include Application, Type.
4. Can you provide details about the market size?
The market size is estimated to be USD XXX N/A as of 2022.
5. What are some drivers contributing to market growth?
N/A
6. What are the notable trends driving market growth?
N/A
7. Are there any restraints impacting market growth?
N/A
8. Can you provide examples of recent developments in the market?
N/A
9. What pricing options are available for accessing the report?
Pricing options include single-user, multi-user, and enterprise licenses priced at USD 3950.00, USD 5925.00, and USD 7900.00 respectively.
10. Is the market size provided in terms of value or volume?
The market size is provided in terms of value, measured in N/A and volume, measured in K.
11. Are there any specific market keywords associated with the report?
Yes, the market keyword associated with the report is "Reusable Shipping Boxes," which aids in identifying and referencing the specific market segment covered.
12. How do I determine which pricing option suits my needs best?
The pricing options vary based on user requirements and access needs. Individual users may opt for single-user licenses, while businesses requiring broader access may choose multi-user or enterprise licenses for cost-effective access to the report.
13. Are there any additional resources or data provided in the Reusable Shipping Boxes report?
While the report offers comprehensive insights, it's advisable to review the specific contents or supplementary materials provided to ascertain if additional resources or data are available.
14. How can I stay updated on further developments or reports in the Reusable Shipping Boxes?
To stay informed about further developments, trends, and reports in the Reusable Shipping Boxes, consider subscribing to industry newsletters, following relevant companies and organizations, or regularly checking reputable industry news sources and publications.
Methodology
Step 1 - Identification of Relevant Samples Size from Population Database


Step 2 - Approaches for Defining Global Market Size (Value, Volume* & Price*)

Note*: In applicable scenarios
Step 3 - Data Sources
Primary Research
- Web Analytics
- Survey Reports
- Research Institute
- Latest Research Reports
- Opinion Leaders
Secondary Research
- Annual Reports
- White Paper
- Latest Press Release
- Industry Association
- Paid Database
- Investor Presentations

Step 4 - Data Triangulation
Involves using different sources of information in order to increase the validity of a study
These sources are likely to be stakeholders in a program - participants, other researchers, program staff, other community members, and so on.
Then we put all data in single framework & apply various statistical tools to find out the dynamic on the market.
During the analysis stage, feedback from the stakeholder groups would be compared to determine areas of agreement as well as areas of divergence